The 2012 Posse Alumni Report - The Posse Foundation
The 2012 Posse Alumni Report - The Posse Foundation
The 2012 Posse Alumni Report - The Posse Foundation

Create successful ePaper yourself
Turn your PDF publications into a flip-book with our unique Google optimized e-Paper software.
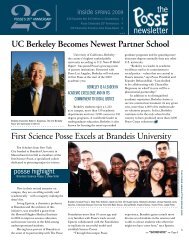
1.5) Projected United States<br />
Demographics by 2050<br />
0.2% Native<br />
Hawaiian and other<br />
Pacific Islander<br />
0.8% American<br />
Indian and Alaska Native<br />
3.0% Bi/Multiracial<br />
7.6% Asian<br />
11.8% African<br />
American/Black<br />
30.2%<br />
Hispanic<br />
U.S. Census 2008<br />
46.3%<br />
White<br />
multiracial populations compared to the general United<br />
States population (see Charts 1.3 and 1.4). As the United<br />
States becomes an increasingly multicultural country, where<br />
non-Hispanic whites are not expected to be the majority by<br />
2050, 3 it is critically important that prestigious American<br />
institutions of higher education, whose graduates are well<br />
positioned for the best entry opportunities in the workforce,<br />
reflect this changing reality (see Chart 1.5). <strong>Posse</strong> helps<br />
these institutions achieve more diverse campuses.<br />
Household Background<br />
Many <strong>Posse</strong> alumni (36 percent) grew up in singleparent<br />
families and most (61 percent) are first-generation<br />
college graduates. In addition, 39 percent come from<br />
homes where their parent(s)/guardian(s) had a high school<br />
diploma/GED or less, and 19 percent come from homes<br />
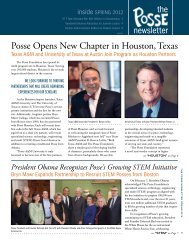
1.6) When you were growing<br />
up, what economic class were<br />
you in<br />
50%<br />
40%<br />
30%<br />
20%<br />
10%<br />
0<br />
20.7%<br />
Lower<br />
Class<br />
49.3%<br />
Working<br />
Class<br />
25.4%<br />
Middle<br />
Class<br />
4.6%<br />
Upper<br />
Middle<br />
Class<br />
0.0%<br />
Upper<br />
Class<br />
where their parent(s)/guardian(s) had less than a high<br />
school diploma/GED.<br />
Most <strong>Posse</strong> alumni also identified as coming from<br />
lower socio-economic backgrounds. 4 Over 70 percent<br />
reported that they were in the “lower class” or “working<br />
class” while growing up and not one alumnus reported<br />
coming from a family that was in the “upper class” (see<br />
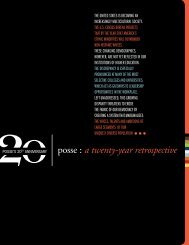
Chart 1.6). In contrast, 74 percent of students from the<br />
general student bodies at the most competitive colleges<br />
and universities in the country come from the top economic<br />
quartile (see Chart 1.7).<br />
<strong>Posse</strong> alumni also come from varied religious backgrounds.<br />
Although most alumni (57 percent) identified as<br />
Christian, they showed a greater representation of non-<br />
Christian religious groups (11 percent) as compared to that<br />
of the general American adult population (2 percent). 5<br />
61% of <strong>Posse</strong> alumni<br />
survey respondents are<br />
first-generation college<br />
graduates.<br />
1.7) Income Position of the<br />
Entering Class at Top Colleges<br />
Source: EPI, <strong>The</strong> State of Working America 2008/2009<br />
80%<br />
70%<br />
60%<br />
74%<br />
50%<br />
40%<br />
30%<br />
20%<br />
17%<br />
10%<br />
3%<br />
6%<br />
0<br />
Bottom<br />
25%<br />
Lower-<br />
Middle 25%<br />
Upper-<br />
Middle 25%<br />
Top<br />
25%<br />
<strong>Posse</strong> <strong>Alumni</strong> <strong>Report</strong> <strong>2012</strong> 5
![BOARD PACKET 10-12-2011[pdf] - The Posse Foundation](https://img.yumpu.com/50978218/1/190x245/board-packet-10-12-2011pdf-the-posse-foundation.jpg?quality=85)
![Posse Chicago, Spring 2011[pdf] - The Posse Foundation](https://img.yumpu.com/45186331/1/190x245/posse-chicago-spring-2011pdf-the-posse-foundation.jpg?quality=85)
![Posse D.C., Summer 2012[pdf] - The Posse Foundation](https://img.yumpu.com/42536642/1/190x247/posse-dc-summer-2012pdf-the-posse-foundation.jpg?quality=85)