Volume 11, Number 3, September, 2003 - Noise News International
Volume 11, Number 3, September, 2003 - Noise News International
Volume 11, Number 3, September, 2003 - Noise News International

Create successful ePaper yourself
Turn your PDF publications into a flip-book with our unique Google optimized e-Paper software.
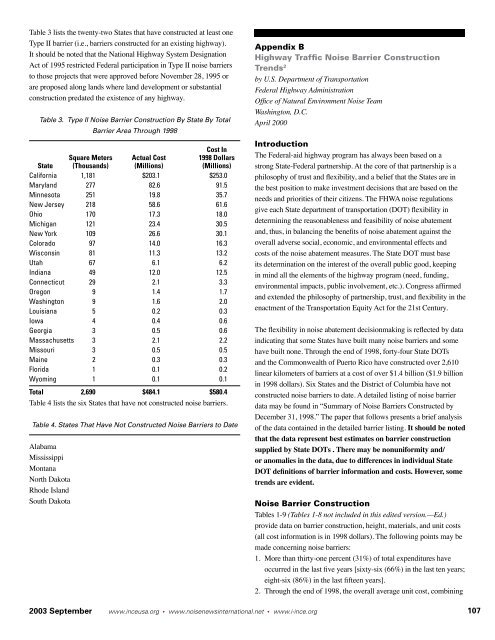
Table 3 lists the twenty-two States that have constructed at least one<br />
Type II barrier (i.e., barriers constructed for an existing highway).<br />
It should be noted that the National Highway System Designation<br />
Act of 1995 restricted Federal participation in Type II noise barriers<br />
to those projects that were approved before November 28, 1995 or<br />
are proposed along lands where land development or substantial<br />
construction predated the existence of any highway.<br />
Table 3. Type II <strong>Noise</strong> Barrier Construction By State By Total<br />
Barrier Area Through 1998<br />
Cost In<br />
Square Meters Actual Cost 1998 Dollars<br />
State (Thousands) (Millions) (Millions)<br />
California 1,181 $203.1 $253.0<br />
Maryland 277 82.6 91.5<br />
Minnesota 251 19.8 35.7<br />
New Jersey 218 58.6 61.6<br />
Ohio 170 17.3 18.0<br />
Michigan 121 23.4 30.5<br />
New York 109 26.6 30.1<br />
Colorado 97 14.0 16.3<br />
Wisconsin 81 <strong>11</strong>.3 13.2<br />
Utah 67 6.1 6.2<br />
Indiana 49 12.0 12.5<br />
Connecticut 29 2.1 3.3<br />
Oregon 9 1.4 1.7<br />
Washington 9 1.6 2.0<br />
Louisiana 5 0.2 0.3<br />
Iowa 4 0.4 0.6<br />
Georgia 3 0.5 0.6<br />
Massachusetts 3 2.1 2.2<br />
Missouri 3 0.5 0.5<br />
Maine 2 0.3 0.3<br />
Florida 1 0.1 0.2<br />
Wyoming 1 0.1 0.1<br />
Total 2,690 $484.1 $580.4<br />
Table 4 lists the six States that have not constructed noise barriers.<br />
Table 4. States That Have Not Constructed <strong>Noise</strong> Barriers to Date<br />
Alabama<br />
Mississippi<br />
Montana<br />
North Dakota<br />
Rhode Island<br />
South Dakota<br />
Appendix B<br />
Highway Traffic <strong>Noise</strong> Barrier Construction<br />
Trends 2<br />
by U.S. Department of Transportation<br />
Federal Highway Administration<br />
Office of Natural Environment <strong>Noise</strong> Team<br />
Washington, D.C.<br />
April 2000<br />
Introduction<br />
The Federal-aid highway program has always been based on a<br />
strong State-Federal partnership. At the core of that partnership is a<br />
philosophy of trust and flexibility, and a belief that the States are in<br />
the best position to make investment decisions that are based on the<br />
needs and priorities of their citizens. The FHWA noise regulations<br />
give each State department of transportation (DOT) flexibility in<br />
determining the reasonableness and feasibility of noise abatement<br />
and, thus, in balancing the benefits of noise abatement against the<br />
overall adverse social, economic, and environmental effects and<br />
costs of the noise abatement measures. The State DOT must base<br />
its determination on the interest of the overall public good, keeping<br />
in mind all the elements of the highway program (need, funding,<br />
environmental impacts, public involvement, etc.). Congress affirmed<br />
and extended the philosophy of partnership, trust, and flexibility in the<br />
enactment of the Transportation Equity Act for the 21st Century.<br />
The flexibility in noise abatement decisionmaking is reflected by data<br />
indicating that some States have built many noise barriers and some<br />
have built none. Through the end of 1998, forty-four State DOTs<br />
and the Commonwealth of Puerto Rico have constructed over 2,610<br />
linear kilometers of barriers at a cost of over $1.4 billion ($1.9 billion<br />
in 1998 dollars). Six States and the District of Columbia have not<br />
constructed noise barriers to date. A detailed listing of noise barrier<br />
data may be found in “Summary of <strong>Noise</strong> Barriers Constructed by<br />
December 31, 1998.” The paper that follows presents a brief analysis<br />
of the data contained in the detailed barrier listing. It should be noted<br />
that the data represent best estimates on barrier construction<br />
supplied by State DOTs . There may be nonuniformity and/<br />
or anomalies in the data, due to differences in individual State<br />
DOT definitions of barrier information and costs. However, some<br />
trends are evident.<br />
<strong>Noise</strong> Barrier Construction<br />
Tables 1-9 (Tables 1-8 not included in this edited version.—Ed.)<br />
provide data on barrier construction, height, materials, and unit costs<br />
(all cost information is in 1998 dollars). The following points may be<br />
made concerning noise barriers:<br />
1. More than thirty-one percent (31%) of total expenditures have<br />
occurred in the last five years [sixty-six (66%) in the last ten years;<br />
eight-six (86%) in the last fifteen years].<br />
2. Through the end of 1998, the overall average unit cost, combining<br />
<strong>2003</strong> <strong>September</strong> www.inceusa.org • www.noisenewsinternational.net • www.i-ince.org<br />
107