Bypassing Export Address Table Filters
Bypassing Export Address Table Filters
Bypassing Export Address Table Filters

You also want an ePaper? Increase the reach of your titles
YUMPU automatically turns print PDFs into web optimized ePapers that Google loves.
Skypher<br />
<strong>Bypassing</strong> <strong>Export</strong> address table <strong>Address</strong> Filter (EAF)<br />
Posted by SkyLined on November 17th, 2010 in Uncategorized · 0 Comments<br />
In early September this year Microsoft released their Enhanced Mitigation<br />
Experience Toolkit v2.0 (EMET), which includes a new mitigation called <strong>Export</strong><br />
address table <strong>Address</strong> Filter (EAF). I decided to have a look at how this mitigation<br />
attempts to prevent exploits from succeeding and how an attacker might bypass it.<br />
EAF works by setting a hardware breakpoint on the export address tables of the<br />
ntdll.dll and kernel32.dll modules in a process. When the breakpoint is triggered,<br />
EMET tries to determin if the code that is trying to access the export address table<br />
is valid code for that process or malicious code injected into the process through an<br />
exploit.<br />
This works because most exploits will at some point inject and run shellcode into<br />
the target process and one of the first thing most shellcodes do is determine where<br />
certain functions are loaded in memory by reading the export address table of<br />
ntdll.dll and/or kernel32.dll. At that point EAF should detect the shellcode and<br />
terminate the process, preventing the exploit from succeeding.<br />
I tested the effectiveness of EAF against one of my shellcodes. All my shellcodes<br />
use the same common techniques to find the base address of functions, which is to<br />
scan the export address table. So, EAF should prevent my shellcode and most<br />
others from working.<br />
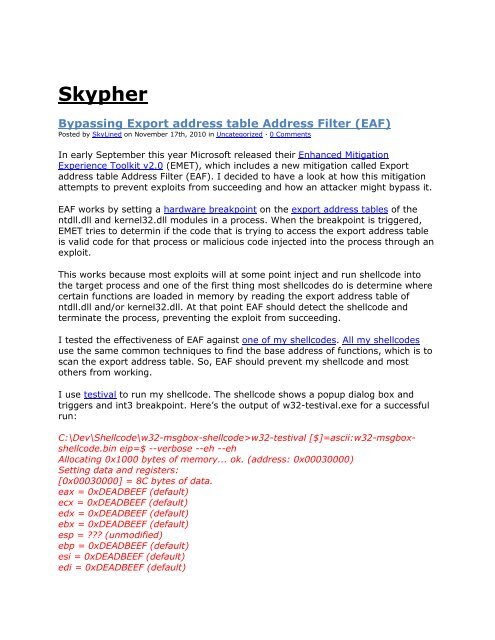
I use testival to run my shellcode. The shellcode shows a popup dialog box and<br />
triggers and int3 breakpoint. Here’s the output of w32-testival.exe for a successful<br />
run:<br />
C:\Dev\Shellcode\w32-msgbox-shellcode>w32-testival [$]=ascii:w32-msgboxshellcode.bin<br />
eip=$ --verbose --eh --eh<br />
Allocating 0x1000 bytes of memory... ok. (address: 0x00030000)<br />
Setting data and registers:<br />
[0x00030000] = 8C bytes of data.<br />
eax = 0xDEADBEEF (default)<br />
ecx = 0xDEADBEEF (default)<br />
edx = 0xDEADBEEF (default)<br />
ebx = 0xDEADBEEF (default)<br />
esp = (unmodified)<br />
ebp = 0xDEADBEEF (default)<br />
esi = 0xDEADBEEF (default)<br />
edi = 0xDEADBEEF (default)
eip = 0x00030000 ($)<br />
Registering Structured Exception Handler (SEH)...ok.<br />
Registering Vectored Exception Handler (VEH)...ok.<br />
Executing shellcode by jumping to 0x00030000...First chance debugger breakpoint<br />
exception at 0x0003008B.<br />
Second chance debugger breakpoint exception at 0x0003008B.<br />
C:\Dev\Shellcode\w32-msgbox-shellcode><br />
(You cannot see the popup dialog box in this output of course, but you will notice<br />
that the int3 breakpoint at the end of the shellcode was executed).<br />
After enabling EMET I tried executing the shellcode again and found that it still<br />
worked! So I contacted my friends at MS who developed the tool. They explained<br />
that in order to install the mitigations, EMET needs to create a new thread in the<br />
target process, which means the protection is not enabled immediately. So, I added<br />
a new feature to Testival to allow me to wait a bit before executing the shellcode<br />
and tried again. This time EMET successfully block the shellcode:<br />
C:\Dev\Shellcode\w32-msgbox-shellcode>w32-testival [$]=ascii:w32-msgboxshellcode.bin<br />
eip=$ --verbose --eh --eh --delay=1000<br />
Allocating 0x1000 bytes of memory... ok. (address: 0x00030000)<br />
Setting data and registers:<br />
[0x00030000] = 8C bytes of data.<br />
eax = 0xDEADBEEF (default)<br />
ecx = 0xDEADBEEF (default)<br />
edx = 0xDEADBEEF (default)<br />
ebx = 0xDEADBEEF (default)<br />
esp = (unmodified)<br />
ebp = 0xDEADBEEF (default)<br />
esi = 0xDEADBEEF (default)<br />
edi = 0xDEADBEEF (default)<br />
eip = 0x00030000 ($)<br />
Registering Structured Exception Handler (SEH)...ok.<br />
Registering Vectored Exception Handler (VEH)...ok.<br />
Waiting for 1000 milliseconds...ok.<br />
Executing shellcode by jumping to 0x00030000...First chance single step exception<br />
at 0x00030054: A trace trap or other single-instruction mechanism signaled that<br />
one instruction has been executed.<br />
Second chance exception 0xC0000409 at 0x00030054.<br />
C:\Dev\Shellcode\w32-msgbox-shellcode><br />
There is no popup this time and instead of the int3 at the end of the shellcode<br />
terminating the process, the process is terminated before the shellcode is finished
y a single step exception. This is because the EAF mitigation has detect that the<br />
shellcode accessed the export address table and triggered the single step exception<br />
to terminate the application rather than allow the shellcode to continue.<br />
So, EAF appears to works well against exploits that use common shellcode (except<br />
maybe in the first few milliseconds after the process is started). So, how do we<br />
bypass it<br />
I assumed that EAF works by checking where the instruction that is accessing the<br />
export address table is located: if it is located inside the code segment of a module<br />
loaded in memory, it must be valid code and allowed to continue, and otherwise it<br />
must be malicious and the process should be terminated. So, I decided to create a<br />
new version of my shellcode that uses a ret-into-libc-like approach to reading the<br />
address table. First, the shellcode should find out where ntdll.dll is loaded in<br />
memory as usual. Second, it should find out where the code segment for ntdll.dll is<br />
located. Third is should scan the code segment for a specific instruction sequence<br />
that can be used to read arbitrary memory. and Finally, it should call this<br />
instruction sequence to read the export address table, rather than read it directly.<br />
If all goes well, EAF will not intervene because it assumes that ntdll.dll is<br />
attempting to read the export address table rather than my shellcode.<br />
It turns out that the RtlGetCurrentPeb function has a sequence that I can use and<br />
that this is static across OS versions and SPs. Even better, it is 4 bytes long, which<br />
means it is easy to write code that finds it:<br />
ntdll32!RtlGetCurrentPeb:<br />
64a118000000 mov eax,dword ptr fs:[00000018h]<br />
8b4030 mov eax,dword ptr [eax+30h]<br />
c3 ret<br />
This code can be used to read arbitrary memory by setting EAX to point 30 bytes<br />
before the memory address you want to read and calling the second instruction.<br />
It also turns out that the export address table is located at the start of the code<br />
segment of ntdll.dll. The first time I tested my code, it was blocked by EAF while<br />
scanning for the instruction sequence in the code segment. Luckily, the<br />
RtlGetCurrentPeb function is not located anywhere near the start of the code<br />
segment, so it was relatively easy to avoid this by having my shellcode skip over<br />
the first 0×1000 bytes of the code segment when scanning for the sequence.<br />
So, here is the result for my modified shellcode, which is only 30 bytes larger than<br />
the original:<br />
C:\Dev\Shellcode\w32-msgbox-shellcode>w32-testival [$]=ascii:w32-msgboxshellcode-eaf.bin<br />
eip=$ –verbose –eh –eh –delay=1000<br />
Allocating 0×1000 bytes of memory… ok. (address: 0×00030000)
Setting data and registers:<br />
[0x00030000] = AB bytes of data.<br />
eax = 0xDEADBEEF (default)<br />
ecx = 0xDEADBEEF (default)<br />
edx = 0xDEADBEEF (default)<br />
ebx = 0xDEADBEEF (default)<br />
esp = (unmodified)<br />
ebp = 0xDEADBEEF (default)<br />
esi = 0xDEADBEEF (default)<br />
edi = 0xDEADBEEF (default)<br />
eip = 0×00030000 ($)<br />
Registering Structured Exception Handler (SEH)…ok.<br />
Registering Vectored Exception Handler (VEH)…ok.<br />
Waiting for 1000 milliseconds…ok.<br />
Executing shellcode by jumping to 0×00030000…First chance single step exception<br />
at 0x76FBA045: A trace trap or other single-instruction mechanism signaled that<br />
one instruction has been executed.<br />
First chance single step exception at 0x76FAFFCE: A trace trap or other singleinstruction<br />
mechanism signaled that one instruction has been executed.<br />
First chance single step exception at 0x76FAFFCE: A trace trap or other singleinstruction<br />
mechanism signaled that one instruction has been executed.<br />
First chance single step exception at 0x76FAFFCE: A trace trap or other singleinstruction<br />
mechanism signaled that one instruction has been executed.<br />
<br />
First chance single step exception at 0x76FAFFCE: A trace trap or other singleinstruction<br />
mechanism signaled that one instruction has been executed.<br />
First chance debugger breakpoint exception at 0x000300AA.<br />
Second chance debugger breakpoint exception at 0x000300AA.<br />
C:\Dev\Shellcode\w32-msgbox-shellcode>