Understanding Public Perceptions and Attitudes to homelessness in ...
Understanding Public Perceptions and Attitudes to homelessness in ...
Understanding Public Perceptions and Attitudes to homelessness in ...

Create successful ePaper yourself
Turn your PDF publications into a flip-book with our unique Google optimized e-Paper software.
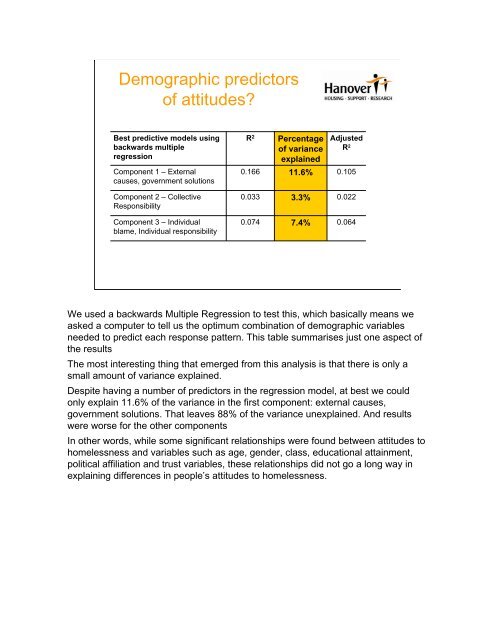
Demographic predic<strong>to</strong>rs<br />
of attitudes<br />
Best predictive models us<strong>in</strong>g<br />
backwards multiple<br />
regression<br />
Component 1 – External<br />
causes, government solutions<br />
Component 2 – Collective<br />
Responsibility<br />
Component 3 – Individual<br />
blame, Individual responsibility<br />
R 2<br />
Percentage<br />
of variance<br />
expla<strong>in</strong>ed<br />
Adjusted<br />
R 2<br />
0.166 11.6% 0.105<br />
0.033 3.3% 0.022<br />
0.074 7.4% 0.064<br />
We used a backwards Multiple Regression <strong>to</strong> test this, which basically means we<br />
asked a computer <strong>to</strong> tell us the optimum comb<strong>in</strong>ation of demographic variables<br />
needed <strong>to</strong> predict each response pattern. This table summarises just one aspect of<br />
the results<br />
The most <strong>in</strong>terest<strong>in</strong>g th<strong>in</strong>g that emerged from this analysis is that there is only a<br />
small amount of variance expla<strong>in</strong>ed.<br />
Despite hav<strong>in</strong>g a number of predic<strong>to</strong>rs <strong>in</strong> the regression model, at best we could<br />
only expla<strong>in</strong> 11.6% of the variance <strong>in</strong> the first component: external causes,<br />
government solutions. That leaves 88% of the variance unexpla<strong>in</strong>ed. And results<br />
were worse for the other components<br />
In other words, while some significant relationships were found between attitudes <strong>to</strong><br />
<strong>homelessness</strong> <strong>and</strong> variables such as age, gender, class, educational atta<strong>in</strong>ment,<br />
political affiliation <strong>and</strong> trust variables, these relationships did not go a long way <strong>in</strong><br />
expla<strong>in</strong><strong>in</strong>g differences <strong>in</strong> people’s attitudes <strong>to</strong> <strong>homelessness</strong>.