Understanding Public Perceptions and Attitudes to homelessness in ...
Understanding Public Perceptions and Attitudes to homelessness in ...
Understanding Public Perceptions and Attitudes to homelessness in ...

Create successful ePaper yourself
Turn your PDF publications into a flip-book with our unique Google optimized e-Paper software.
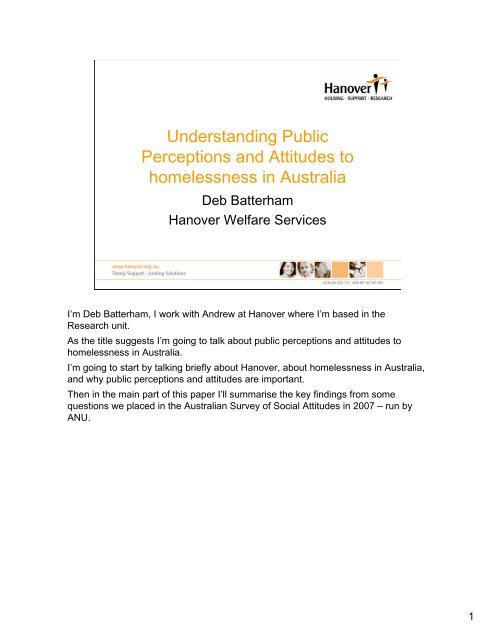
<strong>Underst<strong>and</strong><strong>in</strong>g</strong> <strong>Public</strong><br />
<strong>Perceptions</strong> <strong>and</strong> <strong>Attitudes</strong> <strong>to</strong><br />
<strong>homelessness</strong> <strong>in</strong> Australia<br />
Deb Batterham<br />
Hanover Welfare Services<br />
I’m Deb Batterham, I work with Andrew at Hanover where I’m based <strong>in</strong> the<br />
Research unit.<br />
As the title suggests I’m go<strong>in</strong>g <strong>to</strong> talk about public perceptions <strong>and</strong> attitudes <strong>to</strong><br />
<strong>homelessness</strong> <strong>in</strong> Australia.<br />
I’m go<strong>in</strong>g <strong>to</strong> start by talk<strong>in</strong>g briefly about Hanover, about <strong>homelessness</strong> <strong>in</strong> Australia,<br />
<strong>and</strong> why public perceptions <strong>and</strong> attitudes are important.<br />
Then <strong>in</strong> the ma<strong>in</strong> part of this paper I’ll summarise the key f<strong>in</strong>d<strong>in</strong>gs from some<br />
questions we placed <strong>in</strong> the Australian Survey of Social <strong>Attitudes</strong> <strong>in</strong> 2007 – run by<br />
ANU.<br />
1
About Hanover<br />
Hanover is an <strong>in</strong>dependent welfare agency established <strong>in</strong> 1964<br />
The name comes from its first location – Hanover street <strong>in</strong> north Fitzroy <strong>in</strong><br />
Melbourne<br />
Hanover has no structural l<strong>in</strong>ks <strong>to</strong> governments, churches or <strong>in</strong>stitutions<br />
We provide hous<strong>in</strong>g <strong>and</strong> support services <strong>to</strong> people experienc<strong>in</strong>g <strong>homelessness</strong> or<br />
hous<strong>in</strong>g crisis at 7 sites across Melbourne.<br />
We also do research <strong>and</strong> advocacy work – which, as I said, is where I fit <strong>in</strong><br />
2
Research agenda<br />
4 ma<strong>in</strong> themes:<br />
• Issues <strong>and</strong> impact<br />
• Practice <strong>and</strong> programs<br />
• <strong>Perceptions</strong> <strong>and</strong> attitudes<br />
• Human rights <strong>and</strong> citizenship<br />
We work <strong>to</strong> a research agenda which is organised around 4ma<strong>in</strong> themes.<br />
The first two themes concern the political, social <strong>and</strong> economic context that we<br />
operate <strong>in</strong>; <strong>and</strong> program evaluation <strong>and</strong> best practice. Context <strong>and</strong> service delivery<br />
The second two themes broaden Hanover’s research activity by challeng<strong>in</strong>g<br />
stereotypes <strong>and</strong> present<strong>in</strong>g alternative ways of th<strong>in</strong>k<strong>in</strong>g <strong>and</strong> talk<strong>in</strong>g about<br />
<strong>homelessness</strong> through human rights <strong>and</strong> citizenship.<br />
This research fits <strong>in</strong><strong>to</strong> the perceptions <strong>and</strong> attitudes theme.
About <strong>homelessness</strong> <strong>in</strong><br />
Australia<br />
105,000 Australians homeless on any given night.<br />
Figures from service providers:<br />
• More women than men<br />
• Indigenous people are overrepresented<br />
• One <strong>in</strong> every 3 is a child<br />
• Half of all people us<strong>in</strong>g <strong>homelessness</strong> services are<br />
parents with children<br />
• The most common cause of <strong>homelessness</strong> is domestic<br />
violence<br />
• Two thirds of children present<strong>in</strong>g at services are with<br />
their mothers escap<strong>in</strong>g domestic violence<br />
As some of you will no doubt know Homelessness is complex <strong>and</strong> the people who<br />
experience it are not a homogenous group<br />
<strong>Public</strong> perceptions of <strong>homelessness</strong> <strong>and</strong> the reality of <strong>homelessness</strong> don’t l<strong>in</strong>e up.<br />
Nation wide figures from <strong>homelessness</strong> services show that:<br />
More women than men access <strong>homelessness</strong> services<br />
Indigenous people are overrepresented (while they make up 2% of the Australian<br />
population, they make up 18% of people <strong>in</strong> <strong>homelessness</strong> services)<br />
One <strong>in</strong> every 3 people <strong>in</strong> a Homelessness service is a child (under 17,the majority<br />
under 10)<br />
Half of all people us<strong>in</strong>g <strong>homelessness</strong> services are <strong>in</strong> family units (parent/s with<br />
children), they’re also the most difficult <strong>to</strong> accommodate <strong>and</strong> most likely <strong>to</strong> be turned<br />
away<br />
The most common cause of <strong>homelessness</strong> <strong>in</strong> Australia is Domestic Violence –<br />
Which is overwhelm<strong>in</strong>gly men’s violence.<br />
Two thirds of children present<strong>in</strong>g at services are with their mothers escap<strong>in</strong>g<br />
domestic violence<br />
F<strong>in</strong>ancial difficulty, <strong>and</strong> Accommodation issues such as eviction, leases end<strong>in</strong>g <strong>and</strong><br />
overcrowd<strong>in</strong>g, are also reasons that people become homeless.<br />
Problematic drug <strong>and</strong> alcohol use <strong>and</strong> mental health are issues, but they are not the<br />
most common issues.<br />
* Problematic drug <strong>and</strong> alcohol use is an issue <strong>in</strong> 12% of periods of support.<br />
Mental health issues are an issue <strong>in</strong> about 19% of periods of support<br />
Yesterday Guy Johnson <strong>and</strong> Chris Chamberla<strong>in</strong> presented some research show<strong>in</strong>g<br />
that mental health was just as often caused by <strong>homelessness</strong> as it was precipitat<strong>in</strong>g<br />
4
About perceptions <strong>and</strong><br />
attitudes<br />
• Not just facts <strong>and</strong> figures – its the s<strong>to</strong>ries<br />
we tell with them <strong>and</strong> its values<br />
• The way we th<strong>in</strong>k about a social problems<br />
determ<strong>in</strong>es the k<strong>in</strong>ds of policy solutions on<br />
offer<br />
<strong>Perceptions</strong> <strong>and</strong> attitudes are important<br />
It’s not just about facts <strong>and</strong> figures! It’s about s<strong>to</strong>ries <strong>and</strong> it’s about values.<br />
Facts <strong>and</strong> figures are a necessary start<strong>in</strong>g po<strong>in</strong>t – but it doesn’t matter how many<br />
people are homeless – noth<strong>in</strong>g will change if we th<strong>in</strong>k the problem is them <strong>and</strong> that<br />
it’s their own fault.<br />
People tell s<strong>to</strong>ries about <strong>homelessness</strong>, <strong>and</strong> these s<strong>to</strong>ries <strong>in</strong>clude beliefs about the<br />
causes of <strong>homelessness</strong>, what it means <strong>to</strong> be homeless, <strong>and</strong> who’s responsible for<br />
it.<br />
These s<strong>to</strong>ries, these perceptions <strong>and</strong> attitudes are important because they<br />
determ<strong>in</strong>e the way we th<strong>in</strong>k about social problems. And the way we th<strong>in</strong>k <strong>and</strong> talk<br />
about a social problem determ<strong>in</strong>es the k<strong>in</strong>ds of policy solutions on offer.<br />
Is <strong>homelessness</strong> a problem caused by a lack of affordable hous<strong>in</strong>g<br />
Its it the consequence of the complex <strong>in</strong>tersection of economic <strong>and</strong> social policy<br />
Is it a result of <strong>in</strong>dividuals mak<strong>in</strong>g bad choices<br />
Is <strong>homelessness</strong> some k<strong>in</strong>d of chronic disease, a problem located soley with<strong>in</strong> the<br />
<strong>in</strong>dividuals who experience it.<br />
the policy responses will be different <strong>in</strong> each case.<br />
I th<strong>in</strong>k that Homelessness is a human rights issue.<br />
At Hanover we’re keen <strong>to</strong> reframe <strong>homelessness</strong> with<strong>in</strong> this context <strong>and</strong> challenge<br />
the stereotypes <strong>and</strong> beliefs that keep <strong>homelessness</strong> with<strong>in</strong> a moralistic welfare<br />
frame. But before we can challenge people’s attitudes we first need <strong>to</strong> underst<strong>and</strong><br />
them, know what they are.<br />
Which is why we did this research.<br />
5
2007 Australian Survey of<br />
Social <strong>Attitudes</strong> (AuSSA)<br />
• AuSSA conducted by ANU<br />
• National mailout survey<br />
• 2769 people across Australia participated<br />
We were fortunate <strong>to</strong> get some questions <strong>in</strong><strong>to</strong> the Australian Survey of Social<br />
<strong>Attitudes</strong> which is conducted by a team at Australian National University (ANU)<br />
Our questions were part of a national mail-out survey. Almost 3000 people across<br />
Australia participated.<br />
After each survey ANU release a book with chapters discuss<strong>in</strong>g the f<strong>in</strong>d<strong>in</strong>gs – we’ve<br />
submitted a chapter <strong>to</strong> be <strong>in</strong>cluded so the results presented here will hopefully be<br />
available <strong>in</strong> more detail <strong>in</strong> the next book.<br />
6
AuSSA 2007<br />
• 2 questions on <strong>homelessness</strong><br />
- What are the causes of <strong>homelessness</strong><br />
- Who is responsible for ‘solv<strong>in</strong>g’<br />
<strong>homelessness</strong><br />
Our two questions asked people <strong>to</strong> rate the extent they agreed with a list of causes<br />
of <strong>homelessness</strong>,<br />
<strong>and</strong> <strong>to</strong> rate how much responsibility different groups had <strong>in</strong> ‘solv<strong>in</strong>g’ or respond<strong>in</strong>g <strong>to</strong><br />
<strong>homelessness</strong>.<br />
7
Perceived causes of<br />
<strong>homelessness</strong><br />
Mental illness, substance/alcohol abuse<br />
Family breakdow n<br />
Economic problems<br />
Shortage of affordable hous<strong>in</strong>g<br />
Poor decision mak<strong>in</strong>g, lack of effort<br />
Government failure <strong>to</strong> provide for people<br />
0 20 40 60 80 100<br />
per cent agree<strong>in</strong>g <strong>to</strong> some degree<br />
Participants thought that the most common cause of <strong>homelessness</strong> was Mental<br />
illness, substance/alcohol abuse (89%, n = 2678).<br />
Followed by family breakdown (86%, n = 2673) (this <strong>in</strong>cluded domestic violence,<br />
marital discord, <strong>and</strong> relationship difficulties <strong>and</strong> as examples)<br />
And economic problems (80%, n = 2669)<br />
Two thirds thought that a shortage of affordable hous<strong>in</strong>g was a cause.<br />
Just less than half (47%) of those surveyed thought that poor decision mak<strong>in</strong>g or<br />
lack effort was a reason for <strong>homelessness</strong> – but it still around half of all those who<br />
responded<br />
Only 45% thought that government failure <strong>to</strong> provide for people was a cause of<br />
<strong>homelessness</strong>.<br />
Importantly, public perceptions on the ‘causes’ of <strong>homelessness</strong> don’t l<strong>in</strong>e up with<br />
the data we have. In particular beliefs about mental health <strong>and</strong> drug <strong>and</strong> alcohol<br />
abuse.<br />
8
Perceived responsibility for<br />
solv<strong>in</strong>g <strong>homelessness</strong><br />
Government <strong>and</strong> public<br />
services<br />
Homeless <strong>in</strong>dividuals<br />
<strong>and</strong>/or their families<br />
All members of the<br />
community<br />
Charities<br />
0 20 40 60 80 100<br />
Most or all responsibility for <strong>homelessness</strong><br />
Overwhelm<strong>in</strong>gly, people thought that most or all responsibility for solv<strong>in</strong>g<br />
<strong>homelessness</strong> sat with government <strong>and</strong> public services (70%, n = 2690)<br />
Only 20% of people believed that all members of the community were responsible<br />
(n = 2669)<br />
Still 41% believed that most or all responsibility rested with the <strong>in</strong>dividuals who were<br />
homeless <strong>and</strong>/or their families.<br />
These results highlight a lack of personal engagement with <strong>and</strong> ownership of the<br />
issue – its still seen as a problem for <strong>in</strong>dividuals, their families <strong>and</strong> government's.<br />
Not for the general community.<br />
That’s important for us.<br />
Fram<strong>in</strong>g <strong>homelessness</strong> as a human rights issue <strong>in</strong>volves foster<strong>in</strong>g a sense of<br />
responsibility <strong>and</strong> <strong>in</strong>volvement with<strong>in</strong> the general community.<br />
Because human rights are everyone’s responsibility.<br />
9
Further analysis<br />
Focused on the relationship between<br />
causes <strong>and</strong> responsibility<br />
We wanted <strong>to</strong> know whether responses <strong>to</strong> the items on the causes of <strong>homelessness</strong><br />
<strong>and</strong> responsibility for address<strong>in</strong>g <strong>homelessness</strong> were related.<br />
For example we wanted <strong>to</strong> know whether people who th<strong>in</strong>k <strong>homelessness</strong> is caused<br />
by poor decision mak<strong>in</strong>g or lack of effort are more likely <strong>to</strong> also th<strong>in</strong>k that homeless<br />
<strong>in</strong>dividuals <strong>and</strong>/or their families are responsible for ‘solv<strong>in</strong>g <strong>homelessness</strong>’.<br />
It’s fairly <strong>in</strong>tuitive <strong>and</strong> research undertaken <strong>in</strong> the United States suggests this would<br />
be the case.<br />
We started out by creat<strong>in</strong>g a correlation matrix <strong>to</strong> have a look at the relationships<br />
between items <strong>and</strong> <strong>to</strong> our delight there were some relationships, but there were a lot<br />
of them. We were keen <strong>to</strong> underst<strong>and</strong> whether there was a significant pattern <strong>to</strong><br />
these relationships.<br />
To do that we under<strong>to</strong>ok a Pr<strong>in</strong>cipal Components Analysis.<br />
The next slide has a table summaris<strong>in</strong>g the results of this analysis - I’m not sure<br />
whether people here speak fluent stats or not, or whether we have anyone <strong>in</strong> the<br />
audience whose likely <strong>to</strong> have a severe allergic reaction - flashbacks <strong>to</strong> stats<br />
lectures at uni, need<strong>in</strong>g <strong>to</strong> leave the room, or nap (I’ve seen some of these reaction<br />
<strong>in</strong> social workers before)..<br />
Anyway, I wasn’t quite sure what assumptions <strong>to</strong> make so I’ll do some expla<strong>in</strong><strong>in</strong>g as<br />
I go <strong>and</strong> I th<strong>in</strong>k it should make sense <strong>to</strong> everyone.<br />
10
The structure of attitudes<br />
<strong>to</strong>wards <strong>homelessness</strong><br />
External causes,<br />
government solution<br />
Component<br />
Collective responsibility<br />
Reason – poor decision mak<strong>in</strong>g lack of effort -.044 -.156 .773<br />
Reason – shortage of affordable hous<strong>in</strong>g .682 0.44 -.133<br />
Reason – mental illness, substance/alcohol .515 -.033 .455<br />
abuse<br />
Reason – government failure <strong>to</strong> provide for<br />
people<br />
.684 .169 -.266<br />
Reason – economic problems .766 .125 -0.27<br />
Individual blame,<br />
Individual responsibility<br />
Reason – family breakdown (<strong>in</strong>clud<strong>in</strong>g domestic<br />
violence)<br />
.731 .102 .166<br />
Responsibility - government <strong>and</strong> public services .412 .399 -.268<br />
Responsibility - charities .081 .771 .129<br />
Responsibility – homeless <strong>in</strong>dividuals <strong>and</strong>/or<br />
their families<br />
-.162 .387 .666<br />
Responsibility - all members of the community .148 .777 -.087<br />
Eigenvalue 2.548 1.588 1.4<br />
Variance expla<strong>in</strong>ed 25.5% 15.9% 14.0%<br />
Valid n 2564 2564 2564<br />
• Extraction method: Pr<strong>in</strong>cipal Component Analysis. Rotation Method: Varimax with Kaiser Normalisation.<br />
• Total variance expla<strong>in</strong>ed by this model: 55.4%<br />
A Pr<strong>in</strong>cipal Components Analysis looks at the pattern of relationships between<br />
items <strong>and</strong> groups <strong>to</strong>gether items that participants responded <strong>to</strong> <strong>in</strong> similar ways.<br />
If the relationships between the variables <strong>in</strong> a particular group are strong enough, if<br />
enough of the ‘variance’ <strong>in</strong> responses is expla<strong>in</strong>ed, that group of questions is<br />
separated out <strong>in</strong><strong>to</strong> a ‘component’.<br />
So a component is essentially a response pattern. Sometimes they are referred <strong>to</strong><br />
as fac<strong>to</strong>rs<br />
A number, similar <strong>to</strong> (but not the same as) a correlation coefficient, is given <strong>to</strong><br />
<strong>in</strong>dicate the strength <strong>and</strong> direction of the association or relationship between the<br />
item <strong>and</strong> the component. (which is what the numbers are <strong>in</strong> the table)<br />
To make it a little bit easier <strong>to</strong> look at, I’ve highlighted <strong>in</strong> yellow the items that make<br />
up each component. And I’ve named the components given the items that are<br />
<strong>in</strong>cluded <strong>in</strong> them.<br />
The important th<strong>in</strong>g <strong>to</strong> take from this analysis is:<br />
That 3 components or response patterns emerged
The structure of attitudes<br />
<strong>to</strong>wards <strong>homelessness</strong><br />
3 components emerged from the analysis<br />
• External causes, government solutions<br />
• Collective responsibility<br />
• Individual blame, Individual responsibility<br />
These were:<br />
External causes, government solutions<br />
Collective responsibility<br />
Individual blame, Individual responsibility<br />
What’s <strong>in</strong>terest<strong>in</strong>g about this result is that there were three rather than 2<br />
components that emerged.<br />
We had assumed (as other have before) that external causes <strong>and</strong> collective<br />
responsibility were part of the same ‘response pattern’. That once people thought<br />
that <strong>homelessness</strong> had causes external <strong>to</strong> the <strong>in</strong>dividuals <strong>in</strong>volved, that people<br />
would also feel a sense of collective responsibility for the solution.<br />
Sort f like be<strong>in</strong>g left or right w<strong>in</strong>g<br />
Not so.
Demographic predic<strong>to</strong>rs<br />
•Highest level of education<br />
•Gender<br />
•Trust<br />
•Individual <strong>in</strong>come<br />
•Household <strong>in</strong>come<br />
•Social class (self identified)<br />
•Political Party affiliation<br />
•Left - right spectrum – self rat<strong>in</strong>g<br />
Previous research has typically analysed attitudes <strong>to</strong>wards <strong>homelessness</strong> <strong>in</strong> terms<br />
of demographics. They’ve asked questions like: do women have more favourable<br />
attitudes than men Do people of certa<strong>in</strong> political persuasions People of certa<strong>in</strong><br />
ages or classes<br />
We were keen <strong>to</strong> see if our three components could be predicted by demographic<br />
fac<strong>to</strong>rs.<br />
Example: Are people who respond <strong>in</strong> the ‘collective responsibility pattern’ more<br />
likely <strong>to</strong> have higher levels of educational atta<strong>in</strong>ment, be of a certa<strong>in</strong> age or a<br />
particular <strong>in</strong>come bracket<br />
The survey conta<strong>in</strong>ed a number of demographic items which we used <strong>to</strong> test this<br />
hypothesis: <strong>and</strong> they are listed on the slide here.<br />
We found a number of small correlations between components <strong>and</strong> particular<br />
demographic items – but the correlations, while significant were very small.<br />
And we wanted <strong>to</strong> get a sense of how well all of these demographic items <strong>to</strong>gether<br />
predicted each component or response pattern.<br />
13
Demographic predic<strong>to</strong>rs<br />
of attitudes<br />
Best predictive models us<strong>in</strong>g<br />
backwards multiple<br />
regression<br />
Component 1 – External<br />
causes, government solutions<br />
Component 2 – Collective<br />
Responsibility<br />
Component 3 – Individual<br />
blame, Individual responsibility<br />
R 2<br />
Percentage<br />
of variance<br />
expla<strong>in</strong>ed<br />
Adjusted<br />
R 2<br />
0.166 11.6% 0.105<br />
0.033 3.3% 0.022<br />
0.074 7.4% 0.064<br />
We used a backwards Multiple Regression <strong>to</strong> test this, which basically means we<br />
asked a computer <strong>to</strong> tell us the optimum comb<strong>in</strong>ation of demographic variables<br />
needed <strong>to</strong> predict each response pattern. This table summarises just one aspect of<br />
the results<br />
The most <strong>in</strong>terest<strong>in</strong>g th<strong>in</strong>g that emerged from this analysis is that there is only a<br />
small amount of variance expla<strong>in</strong>ed.<br />
Despite hav<strong>in</strong>g a number of predic<strong>to</strong>rs <strong>in</strong> the regression model, at best we could<br />
only expla<strong>in</strong> 11.6% of the variance <strong>in</strong> the first component: external causes,<br />
government solutions. That leaves 88% of the variance unexpla<strong>in</strong>ed. And results<br />
were worse for the other components<br />
In other words, while some significant relationships were found between attitudes <strong>to</strong><br />
<strong>homelessness</strong> <strong>and</strong> variables such as age, gender, class, educational atta<strong>in</strong>ment,<br />
political affiliation <strong>and</strong> trust variables, these relationships did not go a long way <strong>in</strong><br />
expla<strong>in</strong><strong>in</strong>g differences <strong>in</strong> people’s attitudes <strong>to</strong> <strong>homelessness</strong>.
Conclusion<br />
•A more sophisticated underst<strong>and</strong><strong>in</strong>g<br />
required that moves beyond:<br />
– Collectivism / <strong>in</strong>dividualism<br />
– Demographic predic<strong>to</strong>rs of attitudes<br />
Apart from the f<strong>in</strong>d<strong>in</strong>g that perceptions <strong>and</strong> reality don’t l<strong>in</strong>e up – as other research<br />
has shown as well.<br />
I th<strong>in</strong>k the two key f<strong>in</strong>d<strong>in</strong>gs – the take home messages are:<br />
The structure of attitudes <strong>to</strong>wards <strong>homelessness</strong> cannot simply be reduced <strong>to</strong> a<br />
dicho<strong>to</strong>my between <strong>in</strong>dividualism versus collectivism that corresponds <strong>to</strong> the leftright<br />
political spectrum.<br />
These f<strong>in</strong>d<strong>in</strong>gs also suggest that focus<strong>in</strong>g on the demographic predic<strong>to</strong>rs of these<br />
attitudes, as so much public op<strong>in</strong>ion research has done, is a bit of a waste of time.<br />
These variables can’t expla<strong>in</strong> that much of what is actually go<strong>in</strong>g on.
Where <strong>to</strong> from here<br />
• More explora<strong>to</strong>ry qualitative work<br />
• Some experimental work<br />
• Tweak<strong>in</strong>g <strong>and</strong> f<strong>in</strong>e tun<strong>in</strong>g the items<br />
we have<br />
So what’s next<br />
In terms of further research <strong>in</strong> this area I th<strong>in</strong>k we need some more explora<strong>to</strong>ry<br />
qualitative work. What reasons <strong>and</strong> causes do people nom<strong>in</strong>ate of their own<br />
accord. And what strategies do people use <strong>to</strong> support their beliefs, what narratives<br />
do they use <strong>to</strong> express their beliefs about <strong>homelessness</strong><br />
Once we have a deeper underst<strong>and</strong><strong>in</strong>g of these th<strong>in</strong>gs we can do some social<br />
psychological research <strong>in</strong><strong>to</strong> what k<strong>in</strong>ds of <strong>in</strong>terventions shift people’s attitudes. How<br />
can we <strong>in</strong>fluence the narratives that people use. How can we get people’s<br />
perceptions <strong>to</strong> match up with reality. And how can we get people <strong>to</strong> th<strong>in</strong>k about<br />
<strong>homelessness</strong> as a human rights issue. As someth<strong>in</strong>g that everyone has a<br />
responsibility <strong>to</strong> do someth<strong>in</strong>g about.<br />
Thanks for your time
Thanks for your time!
Relationship between<br />
reasons <strong>and</strong> responsibility<br />
Reasons for <strong>homelessness</strong><br />
Responsibility for <strong>homelessness</strong><br />
Government<br />
<strong>and</strong> public<br />
services<br />
Charities<br />
Individuals<br />
<strong>and</strong>/or their<br />
families<br />
All members of<br />
the Community<br />
Poor decision mak<strong>in</strong>g/lack of<br />
effort<br />
-.101<br />
n = 2647<br />
.267<br />
n = 2629<br />
-.167<br />
n = 2632<br />
Shortage of affordable<br />
hous<strong>in</strong>g<br />
.265<br />
n = 2648<br />
.105<br />
n = 2630<br />
-.095<br />
n = 2633<br />
.127<br />
n = 2636<br />
Mental illness,<br />
substance/alcohol abuse<br />
.096<br />
n = 2665<br />
.062<br />
n = 2646<br />
0.58<br />
n = 2648<br />
.081<br />
n = 2650<br />
Government failure <strong>to</strong><br />
provide for people<br />
.416<br />
n = 2649<br />
.140<br />
n = 2634<br />
-.150<br />
n = 2633<br />
.204<br />
n = 2638<br />
Economic problems .240<br />
n = 2658<br />
.140<br />
n = 2646<br />
-.047*<br />
n = 2644<br />
.169<br />
n = 2649<br />
Family breakdown .171<br />
n = 2662<br />
.120<br />
n = 2646<br />
.193<br />
n = 2652<br />
• all correlations are statistically significant at p =.001 or less unless marked with an * which<br />
denotes significance at p