Unit Corporation - EnerCom, Inc.
Unit Corporation - EnerCom, Inc.
Unit Corporation - EnerCom, Inc.

Create successful ePaper yourself
Turn your PDF publications into a flip-book with our unique Google optimized e-Paper software.
Track Record of Reserve Growth<br />
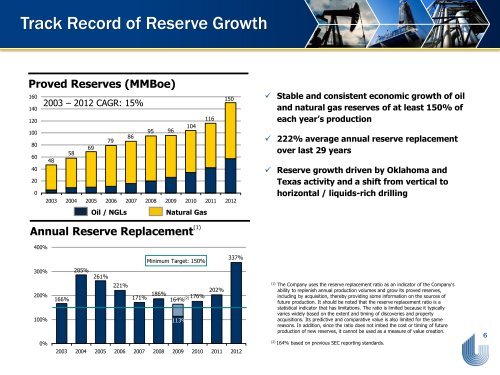
Proved Reserves (MMBoe)<br />
160<br />
150<br />
2003 – 2012 CAGR: 15%<br />
140<br />
120<br />
116<br />
104<br />
100<br />
95 96<br />
86<br />
79<br />
80<br />
69<br />
58<br />
60<br />
48<br />
40<br />
20<br />
0<br />
2003 2004 2005 2006 2007 2008 2009 2010 2011 2012<br />
Oil / NGLs<br />
Natural Gas<br />
Annual Reserve Replacement (1)<br />
400%<br />
337%<br />
Minimum Target: 150%<br />
300% 285%<br />
261%<br />
221%<br />
202%<br />
200%<br />
186%<br />
166% 171% 176%<br />
164% (2)<br />
100%<br />
113%<br />
0%<br />
2003 2004 2005 2006 2007 2008 2009 2010 2011 2012<br />
Stable and consistent economic growth of oil<br />
and natural gas reserves of at least 150% of<br />
each year’s production<br />
222% average annual reserve replacement<br />
over last 29 years<br />
Reserve growth driven by Oklahoma and<br />
Texas activity and a shift from vertical to<br />
horizontal / liquids-rich drilling<br />
(1)<br />
The Company uses the reserve replacement ratio as an indicator of the Company's<br />
ability to replenish annual production volumes and grow its proved reserves,<br />
including by acquisition, thereby providing some information on the sources of<br />
future production. It should be noted that the reserve replacement ratio is a<br />
statistical indicator that has limitations. The ratio is limited because it typically<br />
varies widely based on the extent and timing of discoveries and property<br />
acquisitions. Its predictive and comparative value is also limited for the same<br />
reasons. In addition, since the ratio does not imbed the cost or timing of future<br />
production of new reserves, it cannot be used as a measure of value creation.<br />
(2)<br />
164% based on previous SEC reporting standards.<br />
6