Hanson Morton Harris 2003 - Defense for SVP
Hanson Morton Harris 2003 - Defense for SVP
Hanson Morton Harris 2003 - Defense for SVP

You also want an ePaper? Increase the reach of your titles
YUMPU automatically turns print PDFs into web optimized ePapers that Google loves.
160 ANNALS NEW YORK ACADEMY OF SCIENCES<br />
2.5<br />
D<br />
o Actuarial<br />
o Clinical<br />
l:,. Empirical<br />
+ Structured Clinical<br />
"0<br />
1.5<br />
.'"<br />
= tJ<br />
•••<br />
-=Q<br />
U<br />
0.5<br />
Q<br />
DD<br />
D<br />
o<br />
DO<br />
D<br />
QJ<br />
-0.5<br />
0 10 20 30<br />
50<br />
60<br />
70<br />
80<br />
90<br />
Study Weight (inverse of variance)<br />
Note: only 1 case of structured<br />
clinical<br />
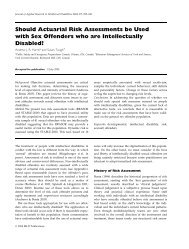
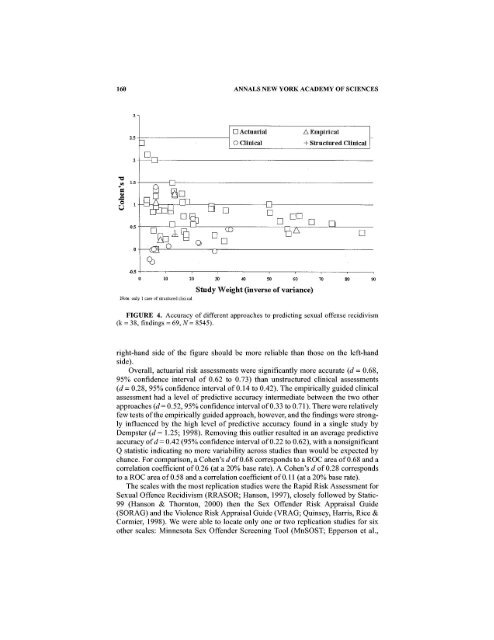
FIGURE 4. Accuracy of different approaches to predicting sexual offense recidivism<br />
(k = 38, findings = 69, N = 8545).<br />
right-hand<br />
side of the figure should be more reliable than those on the left-hand<br />
side).<br />
Overall, actuarial risk assessments were significantly more accurate (d = 0.68,<br />
95% confidence interval of 0.62 to 0.73) than unstructured clinical assessments<br />
(d = 0.28, 95% confidence interval of 0.14 to 0.42). The empirically guided clinical<br />
assessment had a level of predictive accuracy intermediate between the two other<br />
approaches (d = 0.52,95% confidence interval of 0.33 to 0.71). There were relatively<br />
few tests of the empirically guided approach, however, and the findings were strongly<br />
influenced by the high level of predictive accuracy found in a single study by<br />
Dempster (d = 1.25; 1998). Removing this outlier resulted in an average predictive<br />
accuracy of d = 0.42 (95% confidence interval of 0.22 to 0.62), with a nonsignificant<br />
Q statistic indicating no more variability across studies than would be expected by<br />
chance. For comparison, a Cohen's d of 0.68 corresponds to a ROC area of 0.68 and a<br />
correlation coefficient of 0.26 (at a 20% base rate). A Cohen's d of 0.28 corresponds<br />
to a ROC area of 0.58 and a correlation coefficient of 0.11 (at a 20% base rate).<br />
The scales with the most replication studies were the Rapid Risk Assessment <strong>for</strong><br />
Sexual Offence Recidivism (RRASOR; <strong>Hanson</strong>, 1997), closely followed by Static-<br />
99 (<strong>Hanson</strong> & Thornton, 2000) then the Sex Offender Risk Appraisal Guide<br />
(SORAG) and the Violence Risk Appraisal Guide (VRAG; Quinsey, <strong>Harris</strong>, Rice &<br />
Cormier, 1998). We were able to locate only one or two replication studies <strong>for</strong> six<br />
other scales: Minnesota Sex Offender Screening Tool (MnSOST; Epperson et aI.,