Integrated Math Topics (IMT1)
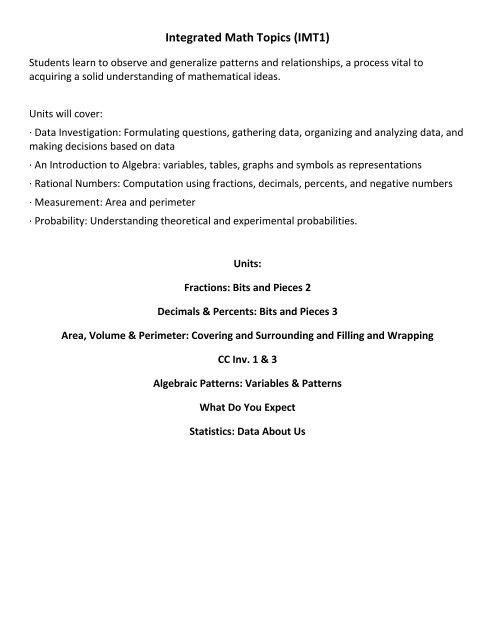
Integrated Math Topics (IMT1)
Integrated Math Topics (IMT1)
You also want an ePaper? Increase the reach of your titles
YUMPU automatically turns print PDFs into web optimized ePapers that Google loves.
<strong>Integrated</strong> <strong>Math</strong> <strong>Topics</strong> (<strong>IMT1</strong>)<br />
Students learn to observe and generalize patterns and relationships, a process vital to<br />
acquiring a solid understanding of mathematical ideas.<br />
Units will cover:<br />
· Data Investigation: Formulating questions, gathering data, organizing and analyzing data, and<br />
making decisions based on data<br />
· An Introduction to Algebra: variables, tables, graphs and symbols as representations<br />
· Rational Numbers: Computation using fractions, decimals, percents, and negative numbers<br />
· Measurement: Area and perimeter<br />
· Probability: Understanding theoretical and experimental probabilities.<br />
Units:<br />
Fractions: Bits and Pieces 2<br />
Decimals & Percents: Bits and Pieces 3<br />
Area, Volume & Perimeter: Covering and Surrounding and Filling and Wrapping<br />
CC Inv. 1 & 3<br />
Algebraic Patterns: Variables & Patterns<br />
What Do You Expect<br />
Statistics: Data About Us
Unit Details<br />
Fractions: Bits and Pieces 2<br />
This unit develops meaning for and skill with computations involving fractions.<br />
In Bits and Pieces 2, students will learn:<br />
<br />
<br />
<br />
<br />
<br />
<br />
<br />
<br />
To use benchmarks and other strategies to estimate the reasonableness of results of operations with<br />
fractions<br />
To develop ways to model sums, differences, products, and quotients with areas, strips, and number<br />
lines<br />
To use estimates and exact solutions to make decisions<br />
To look for and generalize patterns in numbers<br />
To use knowledge of fractions and equivalence of fractions to develop algorithms for adding,<br />
subtracting, multiplying, and dividing fractions<br />
To recognize when addition, subtraction, multiplication, or division is the appropriate operation to<br />
solve a problem<br />
To write fact families to show the inverse relationship between addition and subtraction, and between<br />
multiplication and division<br />
To solve problems using arithmetic operations on fractions<br />
Sample Problems:<br />
1. Bob grew three pumpkins that weighed 24 1/8 pounds, 18 ½ pounds, and 21 3/5 pounds. If he needs<br />
to transport them from the farm with his truck, what is the minimum weight his truck needs to be able<br />
to carry<br />
2. Josie had a cake pan that was ¾ full. She invited her friends over and they ate 2/3 of the cake. How<br />
much of the cake did her friends eat Use a drawing and an equation to support your answer.<br />
3. Ken used a 10 foot piece of lumber to build bookshelves. If he made three shelves that are each 2 ½<br />
feet long, how much lumber was left
Decimals & Percents: Bits and Pieces 3<br />
This unit is designed to build algorithms for the four basic operations with decimals, as well as<br />
opportunities for students to consider when such operations are useful in solving problems.<br />
The unit also uses the student's knowledge of operations with decimals to return to percents<br />
and further develop students understanding and skill in solving percent problems.<br />
In Bits and Pieces 3, students will learn:<br />
To connect to what they already know about operations on fractions and whole<br />
numbers;<br />
To use benchmarks and other strategies to estimate the answers to computations<br />
with decimals;<br />
To use algorithms for operations with decimals;<br />
To use the relationship between decimals and fractions to develop and understand<br />
why decimal algorithms work;<br />
To use the place value interpretation of decimals to make sense of short-cut<br />
algorithms for operations;<br />
To generalize number patterns to help make sense of decimal operations;<br />
To select an appropriate operation to use to solve a problem;<br />
To use decimals with measurements in real world situations;<br />
To solve problems using operations on decimals;<br />
To solve percent problems of the form a % of b equals c for any one of the variables a,<br />
b, or c; and to create and interpret circle graphs.<br />
Sample Problems:<br />
1. Li Ming’s allowance for transportation is $12.45. How many times can she ride the<br />
bus if it costs $0.75 a trip<br />
2. Use the number sentence 123 x 4 = 492 to help you solve the following:<br />
a. 12.3 x 4 b. 1.23 x 4 c. 0.123 x 4<br />
d. 0.123 x 40 e. 0.123 x 400 f. 0.123 x 4000<br />
3. Skateboards are on sale at Susan’s Skate Shop for 30% off.<br />
a. Express the discount as a fraction.<br />
b. If the regular price of a skateboard is $89, what is the discounted price<br />
c. What is the total cost of the discounted skateboard in part (b) if the sales<br />
tax is 10%
Area, Volume & Perimeter: CAS and FAW<br />
In Covering and Surrounding and Filling and Wrapping, students study perimeter, volume and<br />
area. Students explore the concepts and procedures that are related to area and perimeter.<br />
Specifically, the area and perimeter are found for tiled shapes, rectangles, parallelograms,<br />
triangles and circles.<br />
In Covering and Surrounding, students will learn:<br />
Area and how it relates to covering a figure;<br />
Perimeter and how it relates to surrounding a figure;<br />
To apply strategies for finding areas and perimeters of rectangular shapes and nonrectangular<br />
shapes;<br />
The relationships between perimeter and area, including that each can vary while the<br />
other stays fixed;<br />
To use relationships between the areas of simple geometric figures to each other (e.g.<br />
the area of a parallelogram is twice the area of a triangle with the same base and<br />
height);<br />
Formulas and procedures stated in words and/or symbols for finding areas and<br />
perimeters of rectangles, parallelograms, triangles, and circles;<br />
Techniques for estimating the area and perimeter of an irregular figure; and<br />
To recognize situations in which measuring perimeter or area will help answer<br />
practical questions.<br />
Sample Problems:<br />
1. Find the area of the shaded region to the nearest tenth.<br />
2. A neighbor asks you to help her design a rectangular pen for her dog, Ruff. Your<br />
neighbor has 42 meters of fencing to use for the pen.<br />
a. What design would give Ruff the most space for playing<br />
b. What design would give Ruff the best space for running<br />
3. Find the volume of this prism.
CC Investigation 1: Ratios and Rates<br />
In this investigation, students solve problems that involve ratio—a comparison of two<br />
quantities. Success in solving ratio problems requires students to use the correct ratio and<br />
then to decide whether to multiply or divide. Students also are introduced to rates, including<br />
unit rates.<br />
Students will use ratios to convert between customary and metric units of measurement.<br />
Success in converting units requires students to use the correct conversion factors and to<br />
decide whether to multiply or divide when making conversions.<br />
In Investigation 1, students will:<br />
Understand the concept of a unit rate associated with ratio a : b, and use rate language in the context<br />
of a ratio relationship.<br />
Make and tables of equivalent ratios, find missing values in the tables, and plot pairs of values on the<br />
coordinate plane.<br />
Solve unit rate problems.<br />
Use ratio reasoning to convert measurement units.<br />
Sample Problems:<br />
1. Michael paid $7.47 for 3 pounds of grapes. Write the cost of grapes as a unit rate.<br />
2.<br />
Which recipe has the greatest ratio of nuts to granola
CC Investigation 3: Integers & Coordinate Plane<br />
In this investigation, students will extend their previous understandings of number and the<br />
ordering of numbers to the full system of rational numbers, which includes negative rational<br />
numbers, and in particular negative integers. They will reason about the order and absolute<br />
value of rational numbers and about the locations of points in all four quadrants of the<br />
coordinate plane. Students will apply their knowledge of the coordinate plane to plot vertices<br />
of polygons and find the lengths of their horizontal or vertical sides.<br />
In Investigation 3, students will:<br />
Recognize that numbers with opposite signs are located on opposite sides of 0 on the number line, and<br />
that the opposite of the opposite of a number is the number.<br />
Understand how signs of the numbers in an ordered pair indicate the point’s location in a quadrant of<br />
the coordinate plane.<br />
Recognize how points indicated by ordered pairs that differ only by signs relate to reflections across<br />
one or both axes.<br />
Find and graph rational numbers on a number line and ordered pairs of rational numbers on a<br />
coordinate plane.<br />
Understand how a rational number’s absolute value is its distance from 0 on the number line.<br />
Interpret absolute value as magnitude for a quantity in a real-world situation and distinguish<br />
comparisons of absolute value from statements about order.<br />
Solve problems, including distance problems involving points with the same x-coordinate or same y-<br />
coordinate, by graphing points in all quadrants of the coordinate plane.<br />
Write an inequality to represent a real-world situation.<br />
Graph the solution to an inequality and recognize that inequalities of the form x > c or x < c have an<br />
infinite number of solutions.<br />
Draw polygons in the coordinate plane when given coordinates for the vertices.<br />
Sample Problems:<br />
1. Write the inequality represented by this graph.<br />
2. Nadia recorded the daily low temperatures, in degrees Celsius, on this vertical number line. On which<br />
days were the temperatures opposites
Algebraic Patterns: Variables and Patterns<br />
In Variables and Patterns, students will study some basic ideas of algebra and some ways to<br />
use those ideas to solve problems about variables and patterns relating variables.<br />
In Variables and Patterns, students will:<br />
<br />
<br />
<br />
<br />
<br />
<br />
<br />
<br />
Identify quantitative variables in situations<br />
Recognize situations where changes in variables are related in useful patterns;<br />
Describe patterns of change shown in words, tables and graphs of data;<br />
Construct tables and graphs to display relations among variables;<br />
Observe relationships between two quantitative variables as shown in a table, graph, or equation and<br />
describe how the relationship can be seen in each of the other forms of representation;<br />
Use algebraic symbols to write rules and equations relating variables;<br />
Use tables, graphs, and equations to solve problems;<br />
Use graphing calculators to construct tables and graphs of relations between variables and to answer<br />
questions about these relations.<br />
Sample Problems:<br />
1. Graph the data in the table.<br />
2. Complete the table given the rule.<br />
3. A phone company charges $39.99 monthly fee for 600 free minutes. Each additional minute costs<br />
$0.45. This month you used 725 minutes. How much do you owe<br />
4. A typist types 30 words per minute. Write a rule to represent the relationship between the number of<br />
typed words and the time in which they are typed.
What Do You Expect<br />
Students will develop strategies for finding and interpreting experimental and theoretical<br />
probabilities.<br />
In What Do You Expect, students will:<br />
Review and come to deeper understanding of experimental and theoretical<br />
probabilities and relationship between them;<br />
Review and further develop an understanding of possible outcomes in a situation;<br />
Review and come to a deeper understanding of the distinction between equally likely<br />
and non-equally likely outcomes;<br />
Understand the distinction between single, specific outcomes and sets of outcomes<br />
that comprise an event;<br />
Analyze situations involving independent events;<br />
Analyze situations involving dependent events;<br />
Understand how to use probabilities, such as using lists, counting trees, and area<br />
models;<br />
Use counting trees for finding theoretical probabilities in binomial and 50-50<br />
probability situations;<br />
Determine the expected value of a chance situation;<br />
Use probability and expected value of a chance situation;<br />
Use probability and expected value to make decisions;<br />
Find probabilities in situations that involve drawing with and without replacement;<br />
Sample Problems:<br />
1. Hannah’s teacher brought a bucket containing 72 blocks. The blocks are red, yellow,<br />
or blue. Hannah wants to figure out the number of blue blocks without emptying the<br />
bucket. She chooses a block from the bucket, records its color, and then replaces it. Of<br />
her 14 draws, she records blue 5 times. Based on Hannah’s experiment, how many of<br />
the blocks are blue<br />
2. There are 10 cans that look exactly the same. Three cans are corn, two are spinach,<br />
four are beans, and one is tomatoes. If Lori picks a can at random, is each vegetable<br />
equally likely to be in the can<br />
3. Brianna has 2 green marbles and 2 blue marbles. List all the different ways she can<br />
place the four marbles in the two containers.
Statistics: Data About Us<br />
In this unit, students will explore statistics as a process of data investigation involving a set of<br />
four interrelated components: Posing the question, collecting and analyzing the data, and<br />
interpreting the results.<br />
In Data About Us, students will learn:<br />
<br />
<br />
<br />
<br />
<br />
<br />
To use the process of data investigation by posing questions, collecting and analyzing<br />
data distributions, and making interpretations to answer questions.<br />
To represent distributions of data using line plots, bar graphs, stem-and-leaf plots,<br />
and coordinate graphs.<br />
To compute the mean, median, mode and the range of the data.<br />
The difference between categorical data and numerical data and identify which<br />
graphs and statistics may be used to represent each kind of data.<br />
To make informed decisions about which graph(s) and which of the measures of<br />
center (mean, median, or mode) and range may be used to describe a distribution of<br />
data.<br />
Strategies for comparing distributions of data.<br />
Sample Problems:<br />
1. Mr.Watkins arranged the quiz scores of his afternoon math class from least to greatest: 5, 5, 6, 6, 6, 7,<br />
7, 7, 7, 7, 8, 8, 8, 8, 8, 8, 9, 9, 9, 10, 10<br />
a. How many students are in Mr.Watkins’s afternoon math class<br />
b. How do the quiz scores vary<br />
c. What is the mode of the scores<br />
2. Earl rolls 6 six-sided number cubes and finds the sum of the numbers rolled.<br />
a. What are the least and greatest sums Earl can roll Explain.<br />
b. Earl rolled the number cubes several times and recorded each sum. Here are Earl’s results:<br />
27, 21, 17, 18, 21, 18, 25, 32, 8, 19, 21, 20, 26, 21, 11, 23, 33, 19, 9, 12, 17<br />
Make a stem-and-leaf plot to display Earl’s data.


