Hotel Price Index - Hotels.com Press Room
Hotel Price Index - Hotels.com Press Room
Hotel Price Index - Hotels.com Press Room

Create successful ePaper yourself
Turn your PDF publications into a flip-book with our unique Google optimized e-Paper software.
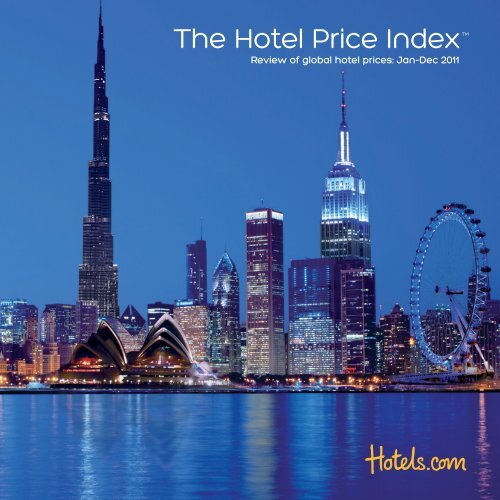
The <strong>Hotel</strong> <strong>Price</strong> <strong>Index</strong><br />
TM<br />
Review of global hotel prices: Jan-Dec 2011
INTRODUCTION<br />
The <strong>Hotel</strong>s.<strong>com</strong> <strong>Hotel</strong> <strong>Price</strong> <strong>Index</strong> TM (HPI ® ) is a regular<br />
survey of hotel prices in major destinations across the<br />
world. The HPI is based on bookings made on<br />
<strong>Hotel</strong>s.<strong>com</strong> and prices shown are those actually paid<br />
by customers per room night (rather than advertised<br />
rates) in 2011.<br />
Now in its eighth year, the HPI is respected as the<br />
definitive report on hotel prices paid around the world<br />
and increasingly used as a reference tool by media,<br />
hoteliers, analysts, tourism bodies and academics.<br />
Approximately 142,000 properties in more than 19,800<br />
global locations make up the sample set of hotels<br />
from which prices are taken.<br />
The international scale of <strong>Hotel</strong>s.<strong>com</strong> (in terms<br />
of both customers and destinations) makes the<br />
<strong>Hotel</strong> <strong>Price</strong> <strong>Index</strong> one of the most <strong>com</strong>prehensive<br />
benchmarks available, as it incorporates both chain<br />
and independent hotels, as well as options such as<br />
self-catering and bed and breakfast properties.<br />
The HPI tracks the real prices paid per room by<br />
<strong>Hotel</strong>s.<strong>com</strong> customers around the world using a<br />
weighted average based on the number of rooms sold<br />
in each of the markets in which <strong>Hotel</strong>s.<strong>com</strong> operates.<br />
Published by <strong>Hotel</strong>s.<strong>com</strong> in the first quarter of 2012
HOTELS ON THE GO<br />
The past six months have seen millions of downloads<br />
of <strong>Hotel</strong>s.<strong>com</strong>’s mobile app.<br />
The portfolio of devices on which the app is<br />
available has expanded rapidly, following the launch<br />
of a dedicated iPad application in September 2011<br />
which takes advantage of the iPad screen for a rich,<br />
immersive user experience. Already available on the<br />
App Store and Android Marketplace, the app is now<br />
also available for Windows Phone, Symbian and<br />
MeeGo devices, allowing customers to search and<br />
book almost 149,000 hotels around the world straight<br />
from their phone.<br />
Available in over 30 languages, additional<br />
enhancements include the ability to check their<br />
Wel<strong>com</strong>e Rewards status and choose from more<br />
than 20,000 exclusive last-minute deals. Users find the<br />
mobile apps particularly useful for these spur-of-themoment<br />
bookings, as they can find a hotel quickly and<br />
easily on-the-go, whether they are on a road trip, have<br />
missed their flight or are stranded in an unfamiliar city.
EARN A FREE NIGHT IN YOUR SLEEP<br />
In October 2011, we launched our customer loyalty<br />
programme Wel<strong>com</strong>e Rewards on all 85 sites around<br />
the world. This unique loyalty scheme offers our<br />
customers the ability to earn one free* night for every<br />
ten nights stayed in more than 65,000 partnering<br />
hotels worldwide. There is no <strong>com</strong>plicated points<br />
system and redemption is as easy as it sounds: Our<br />
customers simply stay for ten nights, either at one<br />
stretch or separately, in one or several of the partnering<br />
hotels and earn the eleventh night free* - whenever<br />
they want, without blackout dates.<br />
Unlike most reward programmes, which are usually<br />
specific to one brand, we allow our customers to<br />
collect their ten qualifying nights across independent<br />
and chain hotels and to redeem their free* night at<br />
any eligible hotel in our global network. The free* night<br />
is valued at the average rate of the ten stays but<br />
consumers also have the option to use the free* night<br />
for a higher rate room by paying the difference.<br />
You can sign up for the programme on<br />
www.hotels.<strong>com</strong> and earn a free night in your sleep!<br />
*(Subject to Wel<strong>com</strong>e Rewards terms and conditions as set out at www.hotels.<strong>com</strong>)
FOREWORD<br />
David Roche<br />
President <strong>Hotel</strong>s.<strong>com</strong><br />
Global price rise following steady overall<br />
recovery<br />
Business and economic volatility may well have<br />
led the TV news bulletins in 2011 as never before, as<br />
viewers waited for updates on the latest attempts<br />
to stave off sovereign bankruptcy or perhaps save a<br />
currency. However, at first glance, nobody has told the<br />
world’s hoteliers about their duty to provide headlinegrabbing<br />
developments. Global hotel prices increased<br />
by 4% on average in 2011 over 2010, continuing the<br />
process of steady recovery from the lows of 2008,<br />
albeit at a distinct walking pace. Occupancy rose<br />
by 2-3% across most of the year and this relatively<br />
modest increase in demand, coupled with slowly restrengthening<br />
economies in some nations, provided<br />
the conditions for slight increases in prices worldwide.<br />
As we enter a third consecutive year of moderate price<br />
rises for guests, the global average price is still lower<br />
than it was in 2005, such was the depth of the financial<br />
crash-inspired trough.<br />
Regional variations highlight local<br />
conditions<br />
There is certainly some more colour at a regional<br />
level. If the recent flow of economic news from North<br />
America suggests evidence of a recovery gathering<br />
speed, so do the prices paid in their hotels – up 5%<br />
in 2011 <strong>com</strong>pared to 2010, the biggest increase in<br />
the region since 2007. European and Middle Eastern<br />
hoteliers sympathised with the market’s stuttering<br />
economy and increased prices in their own currencies<br />
by only 2%. In the world’s faster growing economies,<br />
hotel prices kept pace with market movements. Latin<br />
America has now appeared as the region with the<br />
highest overall increase of all regions since the HPI<br />
launched in 2004 with its <strong>Index</strong> now at 121. The Pacific<br />
saw the most significant price increase by 8% during<br />
2011. Asia’s overall average rate fell by 2%, masking<br />
significant increases in some of the region’s business<br />
centres and cities.<br />
But averages can mask the much more volatile<br />
picture beneath. Four trends stand out:<br />
Natural and political events leave their<br />
mark<br />
First, the impact of political and natural events,<br />
highlighted in our <strong>Hotel</strong> <strong>Price</strong> <strong>Index</strong> review for the first<br />
half of 2011, continued through the full year. The unrest<br />
of the Arab Spring has hit prices across the region, with<br />
prices falling in places from Tunisia to Qatar, where
declining demand met a high level of hotel building. In<br />
Japan, the impact of the tsunami had reduced prices<br />
significantly at one point, although they closed the<br />
year down only slightly below the 2010 level overall as<br />
the Tokyo market recovered some of its demand.<br />
Weaker economies show resilience<br />
Second, we can finally report positive movement in<br />
some of the economies hit hardest over the past four<br />
years. <strong>Price</strong>s rose in Ireland where hoteliers have been<br />
struggling with the aftermath of the property bubble<br />
collapse. The unrest in Egypt proved to be less of an<br />
ill wind for Spain and Italy, which saw a recovery in<br />
leisure demand and posted price rises for the first time<br />
in some years.<br />
Currency is the big driver<br />
Third, currency movements continue to have a<br />
big impact on hotel demand, and therefore prices.<br />
Brazilians spent the spring of 2011 enjoying significant<br />
strength in the Real, and took off to spend it in the US<br />
as never before. As the currency’s strength fell by more<br />
than 20% during the summer, Brazilian wanderlust<br />
rather cooled and travellers stayed home, driving up<br />
demand, and prices, in the main domestic cities such<br />
as Rio de Janeiro and Sao Paulo. American travellers<br />
are spreading their wings a little more, too, posting<br />
increases in demand to both domestic destinations as<br />
well as to Europe and the Caribbean. The number of<br />
American travellers to Asian regions, which were hit by<br />
natural disasters, decreased only slightly.<br />
Business travellers on the move<br />
Lastly, the business travel market remained sound,<br />
keeping demand, and pricing, stable in the more<br />
business-focused markets around the world, with the<br />
overall spending on corporate trips up 9%* globally for<br />
2011. From Singapore to Hong Kong and Las Vegas,<br />
convention and business travel kept hotels busier and<br />
prices higher.<br />
This annual version of our report is now in its eighth<br />
year, and it remains the most <strong>com</strong>prehensive survey<br />
of hotel prices based on what consumers actually pay<br />
in over 85 countries to stay in over 142,000 hotels. If we<br />
sell sufficient nights to get a robust data sample, it’s<br />
in. So if you want to know what the Rugby World Cup<br />
did for the travel industry in Wellington and Auckland,<br />
where to get the most value for your travel budget, or<br />
even where to get five star luxury on the cheap, read<br />
on, it’s part of the service.<br />
*Global Business Travel Association
CONTENTS<br />
1. GLOBAL PRICE CHANGES 11<br />
2. PRICE CHANGES IN GLOBAL CITY DESTINATIONS 18<br />
GLOBAL HOTEL PRICE CHANGES 2011-2010 28<br />
3. PRICE CHANGES BY COUNTRY 30<br />
GLOBAL HOTEL PRICE CHANGES BY COUNTRY 2011-2010 36<br />
4. FOCUS ON THE UK 38<br />
UK HOTEL PRICE CHANGES 2011-2010 43<br />
5. PRICES PAID AT HOME AND AWAY 44<br />
6. WHERE TO STAY FOR £100 A NIGHT 46<br />
7. AVERAGE ROOM PRICES BY STAR RATING 48<br />
8. LUXURY FOR LESS 51<br />
9. TRAVEL HABITS 53<br />
Top overseas destinations for UK travellers<br />
Top UK destinations for visitors from overseas<br />
Top UK destinations for UK travellers<br />
10. TRAVEL TALK 56<br />
SEVEN WONDERS OF THE WORLD 59<br />
GLOBAL HOTEL PRICE CHANGES 2011-2010 62
The HPI report focuses on two main sources of data:<br />
The first section (Chapter 1) shows the global <strong>Hotel</strong><br />
<strong>Price</strong> <strong>Index</strong> for the full year 2011 <strong>com</strong>pared to 2010.<br />
The <strong>Index</strong> is <strong>com</strong>piled from transactions on<br />
<strong>Hotel</strong>s.<strong>com</strong> during this period, in local currency,<br />
weighted to reflect the size of each market. By<br />
representing hotel price movements in an index,<br />
<strong>Hotel</strong>s.<strong>com</strong> can illustrate the actual price movements<br />
as paid by consumers without foreign exchange<br />
fluctuations distorting the picture.<br />
The <strong>Index</strong> was started in 2004 at 100 and includes all<br />
bookings across all star ratings from one to five star.<br />
The second section (Chapters 2-8) shows hotel prices<br />
across the world, per room per night, as paid by UK<br />
travellers in 2011 <strong>com</strong>pared to 2010. This shows the<br />
changes in real prices paid by consumers, reflecting<br />
both movements in exchange rates and hotel<br />
pricing. <strong>Price</strong>s are rounded to the nearest Pound and<br />
percentage figures to the nearest percentage point.<br />
Chapter 9 covers the most popular destinations in 2011.<br />
The final chapter focuses on some additional, more<br />
light-hearted facts and travellers’ habits identified by<br />
<strong>Hotel</strong>s.<strong>com</strong>.<br />
Reports are also available in other currencies. Please<br />
contact press@hotels.co.uk.
1. GLOBAL PRICE CHANGES<br />
The average price of a hotel room around the world<br />
rose 4% in 2011 <strong>com</strong>pared with 2010, according to the<br />
latest <strong>Hotel</strong>s.<strong>com</strong> <strong>Hotel</strong> <strong>Price</strong> <strong>Index</strong>.<br />
The average cost of a room now stands at 104,<br />
<strong>com</strong>pared to 100 when the HPI was launched in 2004,<br />
indicating that the 2011 global average price was only<br />
slightly higher than when the <strong>Index</strong> was originally<br />
launched.<br />
<strong>Price</strong>s fell 2% in Asia year-on-year but rose in all other<br />
areas, including 8% in the Pacific, 5% in North America,<br />
4% in Latin America, 3% in the Caribbean and 2% in<br />
Europe and the Middle East.<br />
Asia sees overall price falls despite<br />
growth in Chinese economy<br />
• Asia was the only region to experience a notable<br />
drop in its overall rankings. In 2011, the HPI for Asia<br />
stood at 107, which was seven points higher than at<br />
the launch of the <strong>Index</strong> in 2004 but still significantly<br />
below its 2005 level (110).<br />
• In real terms, this means, on average, prices paid by<br />
travellers for hotel rooms in Asia fell 2% from 2010 to<br />
2011. <strong>Price</strong>s paid, and their pace of recovery, varied<br />
across the region. Large business and convention<br />
hubs, such as Singapore and Hong Kong, saw<br />
Figure 1 HPI quarterly breakdown from Q1 2004 to Q4 2011 globally<br />
130<br />
120<br />
<strong>Index</strong> Points<br />
110<br />
100<br />
90<br />
80<br />
Q1 04<br />
Q2 04<br />
Q3 04<br />
Q4 04<br />
Q1 05<br />
Q2 05<br />
Q3 05<br />
Q4 05<br />
Q1 06<br />
Q2 06<br />
Q3 06<br />
Q4 06<br />
Q1 07<br />
Q2 07<br />
Q3 07<br />
Q4 07<br />
Q1 08<br />
Q2 08<br />
Q3 08<br />
Q4 08<br />
Q1 09<br />
Q2 09<br />
Q3 09<br />
Q4 09<br />
Q1 10<br />
Q2 10<br />
Q3 10<br />
Q4 10<br />
Q1 11<br />
Q2 11<br />
Q3 11<br />
Q4 11<br />
The <strong>Hotel</strong> <strong>Price</strong> <strong>Index</strong> review of global hotel prices: Jan-Dec 2011<br />
11
ates remain high due to healthy corporate travel<br />
demand and luxury hotel development.<br />
• The growth of low cost carriers in some parts of<br />
the region also began to boost demand.<br />
• Other areas suffered a decline. Popular Thai<br />
destinations, for example, did not fare as well<br />
because of the extensive flooding that spread<br />
throughout the country’s northern and central<br />
regions from July 2011 until reaching Bangkok in<br />
October 2011.<br />
• Reduced occupancy and falling demand in Japan<br />
after the March 2011 earthquake drove hotel rates<br />
downward. The earthquake also had a knockon<br />
effect in other parts of the region as fewer<br />
Japanese executives and tourists travelled abroad.<br />
Figure 2 HPI by region: Europe and the Middle East, Asia, Pacific, North America, Latin America and Caribbean 2004-2011<br />
140<br />
<strong>Index</strong> Points<br />
130<br />
120<br />
110<br />
100<br />
90<br />
80<br />
Asia<br />
Caribbean<br />
Europe & Middle East<br />
Latin America<br />
North America<br />
Pacific<br />
Q1 04<br />
Q2 04<br />
Q3 04<br />
Q4 04<br />
Q1 05<br />
Q2 05<br />
Q3 05<br />
Q4 05<br />
Q1 06<br />
Q2 06<br />
Q3 06<br />
Q4 06<br />
Q1 07<br />
Q2 07<br />
Q3 07<br />
Q4 07<br />
Q1 08<br />
Q2 08<br />
Q3 08<br />
Q4 08<br />
Q1 09<br />
Q2 09<br />
Q3 09<br />
Q4 09<br />
Q1 10<br />
Q2 10<br />
Q3 10<br />
Q4 10<br />
Q1 11<br />
Q2 11<br />
Q3 11<br />
Q4 11<br />
12 The <strong>Hotel</strong> <strong>Price</strong> <strong>Index</strong> review of global hotel prices: Jan-Dec 2011
Johan Svanstrom<br />
Vice President<br />
<strong>Hotel</strong>s.<strong>com</strong> APAC<br />
Overall prices in the Asia-Pacific region have<br />
remained steady, thanks to key markets showing<br />
resilience through global economic dips in the latter<br />
half of 2011. Across Asia, hotel prices have fallen while<br />
the Pacific region saw a high increase.<br />
While the travel industry was hit by last year’s<br />
natural disasters in Japan and Thailand, the strength<br />
of business travel sustained occupancy and prices<br />
in many of the major destinations. Tokyo and other<br />
cities in Japan saw prices and demand fall abruptly<br />
in March but have since been on a recovery path.<br />
Elsewhere, Hong Kong experienced strong upward<br />
rate pressure throughout the year.<br />
In China, there was a varied picture. While Beijing saw<br />
a rise due to a steady increase in tourism and trade,<br />
Shanghai rates plummeted with the city unable to<br />
maintain healthy occupancy levels following the<br />
World Expo. A bit surprisingly, hotel prices in popular<br />
shopping and business hubs such as Kuala Lumpur<br />
and Singapore remained steady or only saw a<br />
small rise.<br />
There continues to be tailwind effects from increased<br />
flight options and strong regional economies,<br />
encouraging consumers’ travel spending. Currency<br />
exchange fluctuations could however yet again play<br />
a role for inbound demand which for most of 2011<br />
was disadvantaged by strong local Asian currencies<br />
Given growing demand in both leisure and corporate<br />
sectors, hotel prices and occupancy rates in Asia are<br />
likely to be on a modest upward trajectory this year.<br />
As usual though, deals and opportunities will arise in<br />
the region and active researching is re<strong>com</strong>mended.<br />
Pacific hits the heights<br />
• The biggest percentage increase in average prices<br />
occurred in the Pacific region, up 8%.<br />
• The HPI reached 118 points, a full 18 points above<br />
the level when the HPI launched in 2004. This jump<br />
was fuelled in part by the relative strengths of the<br />
economies and currencies in Australia and New<br />
Zealand, as well as the resilience of<br />
corporate travel.<br />
• Despite the rise, prices were still below the 2006<br />
level (120), which was wel<strong>com</strong>e news for travellers<br />
staying in this region.<br />
The <strong>Hotel</strong> <strong>Price</strong> <strong>Index</strong> review of global hotel prices: Jan-Dec 2011<br />
13
Latin America<br />
Javier Escobedo<br />
Vice President<br />
<strong>Hotel</strong>s.<strong>com</strong> Latin America<br />
The <strong>Hotel</strong> <strong>Price</strong> <strong>Index</strong> for Latin America rose 4% in 2011<br />
<strong>com</strong>pared to one year ago, underlining the growing<br />
economic power of our region, particularly in the<br />
largest country Brazil. The average cost of a room in<br />
a Brazilian hotel rose in 2011 because of a continuous<br />
increase in demand, a robust economy which grew<br />
by 4% and a rise in in<strong>com</strong>e across the board.<br />
Moreover, the Real steadily devalued over the second<br />
half of 2011, making some local destinations more<br />
appealing to potential travellers right in time for the<br />
summer season. Rio and São Paulo saw price hikes.<br />
In both cases, room supply failed to keep up with<br />
demand which, in turn, was heated by global megaevents,<br />
such as Rock in Rio, the U2 concert and the<br />
Formula 1 race.<br />
Business destinations, like Campinas and Curitiba,<br />
experienced steep hikes as well while the price<br />
development in beach destinations was more<br />
uneven. <strong>Price</strong>s dropped or grew little in Praia do Forte,<br />
Natal and other destinations that traditionally favour<br />
packages. They had to <strong>com</strong>pete harder as they<br />
faced expensive air hikes. Many travellers chose to go<br />
abroad or to alternative local destinations.<br />
Mexico kept the average prices more in line with the<br />
previous year. The local market conditions neither<br />
affected average room rates in top tourist sunspots<br />
nor in the three largest cities of Mexico City, Monterrey<br />
and Guadalajara. Global turmoil impacted the value<br />
of the Peso, boosting international demand for well<br />
known hotspots like Los Cabos and Cancun.<br />
• <strong>Price</strong>s paid by travellers for hotel rooms in Latin<br />
America rose 4% from 2010 to 2011 and the Latin<br />
American HPI stood at 121 in 2011, the highest of all<br />
regions surveyed.<br />
• This performance underlined the growing<br />
economic power of the region, especially the<br />
importance of its largest country, Brazil.<br />
• Despite the rise, the average price of a hotel room<br />
in Latin America was still cheaper in 2011 than it<br />
was five years ago (123).<br />
14 The <strong>Hotel</strong> <strong>Price</strong> <strong>Index</strong> review of global hotel prices: Jan-Dec 2011
Europe and Middle East region shows modest signs of recovery<br />
Matthew Walls<br />
Vice President<br />
<strong>Hotel</strong>s.<strong>com</strong> EMEA<br />
<strong>Hotel</strong> pricing trends are an interesting bellwether<br />
for the impact of wider environmental factors. In<br />
2010, across Europe and the Middle East, we saw<br />
significant geographical events such as the Icelandic<br />
volcano and unusually bad December weather in<br />
northern Europe cause significant disruption in the<br />
hotel sector.<br />
In 2011, whilst geological activity was thankfully<br />
reduced, the well-documented financial woes of the<br />
Eurozone became the biggest factor preying on the<br />
minds of hoteliers across the region. It is perhaps<br />
surprising therefore to report that average rates rose<br />
2% in 2011 <strong>com</strong>pared to 2010.<br />
There is no doubt that the economic downturn<br />
has caused a change in demand patterns but, in<br />
the leisure market, we’ve seen many customers<br />
increasingly trading off a reduced number of nights<br />
for a higher quality hotel room. European consumers<br />
are prepared to <strong>com</strong>promise on the number of<br />
annual trips but not on the quality of those trips so<br />
overall hotel pricing is holding up well.<br />
Business travel trends also feed significantly into the<br />
averages across Europe. The market for business<br />
meetings and conferences has declined somewhat<br />
in response to the economic slump but we have<br />
seen that situation turn into a positive for dealseeking<br />
leisure travellers as hoteliers in those typically<br />
four and five-star properties have sought to maintain<br />
their occupancy levels via some great deals.<br />
The only thing certain for 2012 is that the external<br />
environment will continue to impact pricing.<br />
• The HPI in Europe and the Middle East stood at 102<br />
points in 2011, just 2 points higher than when the<br />
<strong>Index</strong> was launched.<br />
• This meant that average hotel room prices in<br />
Europe and the Middle East were almost the same<br />
as in 2004, representing outstanding value for the<br />
traveller.<br />
• As European leaders grappled with the uncertainty<br />
of the Eurozone, the region overall experienced a 2%<br />
year-on-year price increase, the smallest rise of all<br />
regions.<br />
• Average room rates were higher in countries with<br />
particularly strong economies, such as Switzerland,<br />
The <strong>Hotel</strong> <strong>Price</strong> <strong>Index</strong> review of global hotel prices: Jan-Dec 2011<br />
15
Norway and Sweden. Some resorts in Italy and<br />
Spain also experienced room rate inflation as<br />
travellers moved to safer holiday destinations away<br />
from traditional favourites in Egypt and Tunisia.<br />
• The Arab Spring impacted average room rates in<br />
the Middle East as the civil unrest led travellers to<br />
stay away, forcing hoteliers to cut their rates in a bid<br />
to attract custom.<br />
• <strong>Price</strong>s for the region were still below the 2006<br />
level (107).<br />
Cairo<br />
North America<br />
Victor Owens<br />
Vice President<br />
<strong>Hotel</strong>s.<strong>com</strong> North America<br />
Like a speedy rollercoaster that leaves riders<br />
breathless yet excited for another go, the travel<br />
industry in 2011 took all of us on an interesting journey<br />
of ups and downs. What we’ve learned is that what<br />
goes down must <strong>com</strong>e back up!<br />
As we take a look back at 2011, we saw some major<br />
ups like a recovery in the business travel sector<br />
in North America with folks back on planes and<br />
staying at hotels. This usually means our economy is<br />
improving, which is a big upside. We saw customers<br />
choosing adventures outside their backyards and<br />
getting past the staycation trend. Of course, if<br />
your “backyard” is a lush and bountiful winery, a<br />
Championship golf course or family-friendly theme<br />
park, a road trip closer to home to explore the region<br />
is just as fun.<br />
The downs of 2011 included the Japanese earthquake<br />
and tsunami which had a major affect on North<br />
Americans traveling to the region. The HPI showed<br />
that the ranking of Tokyo dropped as an outbound<br />
16 The <strong>Hotel</strong> <strong>Price</strong> <strong>Index</strong> review of global hotel prices: Jan-Dec 2011
Caribbean prices heat up<br />
destination. The European debt crisis can be a big<br />
up for North Americans looking to cross the Atlantic<br />
to stretch their dollar which strengthened against<br />
the Pound and the Euro. London, Paris and Rome<br />
continue to hold tight to their positions on the<br />
podium but Barcelona and Madrid are inching up in<br />
popularity. Rioja, anyone<br />
• <strong>Price</strong>s for the Caribbean rose 3% year-on-year.<br />
For 2011, the HPI for the region stood at 118 points,<br />
which meant the Caribbean, together with the<br />
Pacific region, was second only to Latin America for<br />
growth in average room prices since 2004.<br />
• The region continued a pattern of modest recovery<br />
after steep percentage falls in 2008 and 2009 but<br />
rates were still far below the 2006 level (127).<br />
• Average prices paid by travellers for hotel rooms in<br />
North America (the USA and Canada) rose 5% yearon-year<br />
in 2011. For the first time since 2008, the<br />
region’s HPI passed the 100 mark again, reaching<br />
102, but room rates were just 2% higher than in 2004<br />
when the HPI was launched and still below the<br />
2005 level (107).<br />
Caribbean<br />
• As the US economy showed some signs of<br />
recovery as the year wore on, stronger demand<br />
from leisure and business travellers gave hoteliers<br />
the confidence to hold or increase their prices.<br />
The <strong>Hotel</strong> <strong>Price</strong> <strong>Index</strong> review of global hotel prices: Jan-Dec 2011<br />
17
2. PRICE CHANGES IN GLOBAL CITY<br />
DESTINATIONS<br />
The following sections reflect the actual prices paid by<br />
travellers from the UK in Pound Sterling (£) during 2011,<br />
<strong>com</strong>pared to prices paid in Pound Sterling the<br />
year before.<br />
UK travellers faced price rises in many of their favourite<br />
destinations. This could in part be explained by<br />
currency fluctuations but was also due to hoteliers in<br />
some areas raising rates and offering fewer discounts.<br />
However, events of global importance also had a<br />
fundamental impact on prices.<br />
European prices resilient despite<br />
Eurozone crisis<br />
Although London prices rose marginally by 1%,<br />
many traditional European city break destinations<br />
experienced steeper price rises caused by the Euro’s<br />
relatively strong performance against the Pound.<br />
Amsterdam increased 9% to £116, Venice and Barcelona<br />
were up 8% to £137 and £104 respectively, Brussels<br />
edged up 5% to £94 and Paris grew modestly by 3% to<br />
£125.<br />
dropped off and local hoteliers discounted prices in a<br />
bid to attract custom.<br />
Despite similar economic difficulties, Dublin prices<br />
rallied 7% to £73, helped in part by the May 2011 visits<br />
of US President Barack Obama and the Queen which<br />
raised the profile of the city. The Irish capital also<br />
benefited from popular events such as the Six Nations<br />
rugby match between Ireland and England in March<br />
2011 and the Take That concert in June 2011.<br />
The strength of the Nordic economies and currencies<br />
also led to increases in the capital cities of Sweden,<br />
Denmark and Finland. Average room prices in<br />
Stockholm increased 14% to £129 and Copenhagen<br />
rose 9% to £113. The strong performance of the Finnish<br />
economy, one of the few star performers of the<br />
Eurozone, also led to a 17% increase in Helsinki as<br />
average room prices soared to £107. As the Icelandic<br />
Amsterdam<br />
The effects of the Greek debt problem and subsequent<br />
civil unrest triggered a 10% slump to £80 in average<br />
hotel prices in Athens. Foreign and domestic demand<br />
18 The <strong>Hotel</strong> <strong>Price</strong> <strong>Index</strong> review of global hotel prices: Jan-Dec 2011
economy recovered from the double whammy of the<br />
ongoing banking crisis and the 2010 volcanic ash cloud.<br />
Reykjavik also increased 6%, taking prices to an average<br />
of £77 per night. Average room rates in Oslo remained<br />
unchanged from 2010 to 2011, holding their value at £113.<br />
There were also significant price rises in Baltic state<br />
cities, which have traditionally offered good value hotel<br />
ac<strong>com</strong>modation. Increased demand from travellers<br />
searching for low cost destinations caused average<br />
room rates to climb. Tallinn rose 11% to £60, Vilnius 10%<br />
to £54 and Riga 7% to £56.<br />
The repercussions of the Arab Spring spread to<br />
southern Europe, which experienced significant price<br />
increases for its average room rates as travellers<br />
relocated to “safer” destinations for their holidays.<br />
The Spanish island of Ibiza was home to the biggest<br />
percentage leap as demand soared for rooms, up 39%<br />
to £115. The second-highest rate paid for a European<br />
get-away was recorded in Amalfi on the Italian<br />
Mediterranean coast, which rose 27% to £183.<br />
Demand rises in US cities<br />
UK travellers exploiting the Pound’s relative strength<br />
against the US Dollar still found that hotel rooms in<br />
some of their favourite US destinations were more<br />
expensive.<br />
There was less discounting amongst hoteliers iin 2011<br />
than in 2010 as the market strengthened. Corporate<br />
travellers drove up room demand and prices, with<br />
convention centres such as San Francisco, Dallas and<br />
Las Vegas posting 14%, 13% and 11% increases to £113, £92<br />
and £78 respectively.<br />
San Francisco<br />
Across the US, New York had the largest increase in<br />
the supply of hotel rooms in 2011, especially at the<br />
upscale end of the market. However, average room<br />
rates still increased 4% to £173 as a result of robust<br />
demand from domestic travellers and European<br />
visitors in search of a currency bargain against the<br />
US Dollar.<br />
The <strong>Hotel</strong> <strong>Price</strong> <strong>Index</strong> review of global hotel prices: Jan-Dec 2011<br />
19
The still-burgeoning US technology sector continued<br />
to attract visitors both regionally and from overseas,<br />
particularly as technology IPOs were once again<br />
rumoured to be on the horizon. Palo Alto, home to<br />
Silicon Valley venture capitalists on Sand Hill Road and<br />
technology giants including Facebook, reported a 27%<br />
leap in room rates to £151 per night.<br />
Tripoli<br />
In Egypt, the popular tourist destination of Luxor<br />
plummeted 29% to £53 per night while the Red Sea<br />
resort of Sharm El Sheikh experienced a sharp drop of<br />
26% to £69. Tunis also fell significantly by 28%, bringing<br />
average room rates down to £77 per night.<br />
There was a knock-on effect for other countries in the<br />
Middle East as a perception of regional instability took<br />
hold amongst consumer and corporate travellers.<br />
Average hotel prices in Doha were down 27% to £122,<br />
Abu Dhabi dropped 10% to £104 and Marrakech slipped<br />
4% to £71. Dubai also fell 1% to £119, caused in part by<br />
increased capacity from more than 150 new hotel<br />
projects under construction in the Gulf states.<br />
Disasters fail to dampen room rate<br />
inflation in Australian and New Zealand<br />
cities<br />
Arab Spring turmoil and Libyan war see<br />
prices plummet in the Middle East<br />
The Middle East experienced the biggest drops in<br />
average hotel prices per night as the Arab Spring<br />
uprising unfolded in Tunisia and then spread across<br />
the region.<br />
Despite natural disasters that could have negatively<br />
impacted the region, average room rates grew in<br />
Australia and New Zealand, in part because both<br />
countries boasted strong currencies.<br />
Brisbane, which was hit by extensive flooding in<br />
January 2011, saw a 26% rise to £110 as business travel<br />
recovered quickly. Sydney, Perth and Melbourne also<br />
experienced robust demand. Buoyed by the strong<br />
20 The <strong>Hotel</strong> <strong>Price</strong> <strong>Index</strong> review of global hotel prices: Jan-Dec 2011
Australian economy, average hotel prices in the cities<br />
grew 17%, 22% and 15% to £119, £115 and £99 respectively.<br />
Tokyo<br />
Wellington and Auckland in New Zealand’s North Island<br />
also experienced an increase in demand as travellers<br />
relocated from the earthquake-hit South Island. The<br />
capital city saw a 22% increase to £72 and Auckland<br />
was up 9% to £70 a night. Bookings also picked up as<br />
fans arrived for the Rugby World Cup in September<br />
2011. The popular tourist location of Rotorua also saw<br />
a 15% increase to £64. Christchurch, which suffered a<br />
devastating earthquake in February 2011, posted the<br />
highest gain, up 41% to £81 on the back of a lack<br />
of supply.<br />
Japanese rates hit by natural disaster<br />
The average room rate fell in some of Japan’s largest<br />
cities as the March 2011 earthquake, tsunami and<br />
nuclear meltdown at the Fukushima atomic plant<br />
deterred travellers from visiting.<br />
The triple blow saw prices sink in Hiroshima by 16% to<br />
£67, in Kyoto by 11% to £91 and in Osaka by 6% to £65.<br />
Tokyo proved more resilient with a modest 2% drop in<br />
average room rates to £102.<br />
<strong>Price</strong>s keep building in BRIC cities<br />
The strength of the BRIC economies of Brazil, Russia,<br />
India and China was also largely reflected in hotel rates<br />
as corporate demand increased along with<br />
domestic custom.<br />
Rio de Janeiro was up 13% to £156, Sao Paulo grew<br />
7% to £126, Moscow rose 9% to £164, St Petersburg<br />
increased 8% to £113 and Mumbai added another 4% to<br />
its average room rate taking prices to £111. Hong Kong<br />
climbed 18% to £119, boosted by strong business as well<br />
The <strong>Hotel</strong> <strong>Price</strong> <strong>Index</strong> review of global hotel prices: Jan-Dec 2011<br />
21
as consumer interest from the mainland. However,<br />
Shanghai bucked the trend with a 17% slide to £76 as<br />
the market re-adjusted after the World Expo from April<br />
to October 2010 and the construction of new hotels<br />
increased room capacity.<br />
<strong>Price</strong>s stay high in luxury destinations<br />
Against a backdrop of a worsening global economy, UK<br />
travellers to upmarket destinations still faced high and<br />
rising prices because of strong demand.<br />
The Omani capital of Muscat remained the most<br />
expensive city featured in the HPI at £219. High-value<br />
customers seeking luxury hotel ac<strong>com</strong>modation, most<br />
notably from European countries such as Germany,<br />
fuelled the 18% rise in room rates.<br />
The “millionaires’ playground” of Monte Carlo remained<br />
the most expensive European destination at £185, and<br />
other upmarket leisure resorts such as Deauville and<br />
Como also featured high on the table after double-digit<br />
percentage jumps to £144 and £135 respectively.<br />
Figure 3 Average hotel prices in 2011 <strong>com</strong>pared with 2010<br />
Destination 2011 2010 % change<br />
Muscat £219 £185 18%<br />
Monte Carlo £185 £182 2%<br />
Amalfi £183 £144 27%<br />
New York £173 £166 4%<br />
Geneva £165 £147 12%<br />
Moscow £164 £150 9%<br />
Rio de Janeiro £156 £138 13%<br />
Palo Alto £151 £119 27%<br />
Deauville £144 £118 22%<br />
Boston £137 £128 7%<br />
Venice £137 £127 8%<br />
Singapore £136 £123 11%<br />
Como £135 £111 22%<br />
Stockholm £129 £114 14%<br />
Sao Paulo £126 £118 7%<br />
Paris £125 £122 3%<br />
Cancun £124 £98 27%<br />
Jerusalem £123 £105 17%<br />
Doha £122 £169 -27%<br />
Miami £122 £119 3%<br />
Dubai £119 £120 -1%<br />
Hong Kong £119 £101 18%<br />
Sydney £119 £101 17%<br />
22 The <strong>Hotel</strong> <strong>Price</strong> <strong>Index</strong> review of global hotel prices: Jan-Dec 2011
Destination 2011 2010 % change<br />
Washington £118 £121 -2%<br />
Amsterdam £116 £106 9%<br />
Rome £116 £114 2%<br />
LONDON £115 £114 1%<br />
Perth £115 £94 22%<br />
Ibiza £115 £82 39%<br />
Oslo £113 £113 0%<br />
San Francisco £113 £99 14%<br />
St Petersburg £113 £105 8%<br />
Copenhagen £113 £103 9%<br />
Los Angeles £111 £104 7%<br />
Mumbai £111 £106 4%<br />
Nairobi £111 £128 -14%<br />
Brisbane £110 £87 26%<br />
Beirut £109 £141 -23%<br />
Chicago £109 £102 6%<br />
Johannesburg £108 £119 -9%<br />
Cairo £108 £107 1%<br />
Vancouver £108 £105 3%<br />
Helsinki £107 £91 17%<br />
Montreal £107 £102 5%<br />
Cape Town £106 £119 -11%<br />
Frankfurt £106 £102 4%<br />
Antalya £105 £96 10%<br />
Destination 2011 2010 % change<br />
Barcelona £104 £96 8%<br />
Abu Dhabi £104 £116 -10%<br />
Tokyo £102 £103 -2%<br />
Melbourne £99 £86 15%<br />
Toronto £99 £94 4%<br />
Kiev £98 £98 0%<br />
Santiago £98 £89 10%<br />
Vienna £98 £94 4%<br />
Buenos Aires £96 £90 7%<br />
Brussels £94 £89 5%<br />
Adelaide £92 £91 1%<br />
Dallas £92 £81 13%<br />
New Orleans £92 £93 -2%<br />
Kyoto £91 £102 -11%<br />
Madrid £89 £86 4%<br />
Jakarta £88 £71 25%<br />
Casablanca £87 £79 10%<br />
Calcutta £87 £86 1%<br />
New Delhi £84 £85 -1%<br />
Lisbon £82 £82 -1%<br />
Christchurch £81 £58 41%<br />
Athens £80 £89 -10%<br />
Mexico City £80 £70 13%<br />
Las Vegas £78 £70 11%<br />
The <strong>Hotel</strong> <strong>Price</strong> <strong>Index</strong> review of global hotel prices: Jan-Dec 2011<br />
23
Destination 2011 2010 % change<br />
Tunis £77 £107 -28%<br />
Beijing<br />
Reykjavik £77 £72 6%<br />
Warsaw £76 £70 9%<br />
Shanghai £76 £91 -17%<br />
Dublin £73 £68 7%<br />
Berlin £73 £75 -3%<br />
Kuala Lumpur £72 £67 7%<br />
Wellington £72 £59 22%<br />
Prague £71 £67 5%<br />
Marrakech £71 £74 -4%<br />
Beijing £70 £69 2%<br />
Auckland £70 £64 9%<br />
Sharm El Sheikh £69 £93 -26%<br />
Hiroshima £67 £80 -16%<br />
Osaka £65 £69 -6%<br />
Rotorua £64 £56 15%<br />
Tallinn £60 £54 11%<br />
Bangkok £58 £58 0%<br />
Riga £56 £53 7%<br />
Vilnius £54 £50 10%<br />
Luxor £53 £75 -29%<br />
Manila £51 £57 -11%<br />
Hanoi £43 £52 -17%<br />
Phnom Penh £40 £52 -23%<br />
Fastest risers<br />
• The steepest percentage increase of 41% came<br />
in the New Zealand city of Christchurch, which<br />
recovered well from the earthquake in February<br />
2011. Wellington also grew 22%, buoyed by the<br />
Rugby World Cup. Brisbane in Australia increased<br />
26%, despite the floods in January 2011 as the city<br />
recovered well through strong corporate demand.<br />
Another indication of rising prices was evident in<br />
Perth, which climbed 22% as the Australian Dollar<br />
outperformed the Pound.<br />
• The Spanish isle of Ibiza saw the average room rate<br />
jump 39% as travellers, especially from Germany<br />
and Italy, re-located from troubled North African<br />
24 The <strong>Hotel</strong> <strong>Price</strong> <strong>Index</strong> review of global hotel prices: Jan-Dec 2011
hotspots such as Tunisia and Egypt. Additionally,<br />
the Italian resort of Amalfi experienced a 27% rise.<br />
• Luxury destinations witnessed some of the biggest<br />
leaps in average room rates, as evidenced by<br />
Deauville and Como both up 22%.<br />
• The strong Nordic economies meant that, for<br />
example, Helsinki became more expensive for UK<br />
travellers with an increase of 17%.<br />
• UK travellers to the popular Mexican resort of<br />
Cancun also found rooms more expensive, with a<br />
27% jump as more hotels moved to the all-inclusive<br />
model and global turmoil impacted the value of the<br />
Peso, boosting international demand for well known<br />
sun spots.<br />
• Jerusalem climbed 17% as hoteliers raised prices<br />
after a record 3.2 million visitors travelled to Israel in<br />
2010, supported by the increase in low-cost carriers<br />
into the market.<br />
• <strong>Hotel</strong> rates served as a practical barometer of the<br />
growing importance and development of cities in<br />
the rapidly-developing BRIC countries. Just one of<br />
the ways this was evidenced was by the average<br />
room rate in Hong Kong surging 18% due to an influx<br />
of foreign corporate and leisure visitors and more<br />
shoppers from China.<br />
• The Silicon Valley location of Palo Alto in California<br />
posted the biggest rise of the American locations<br />
featured in the report, up 27% due to its importance<br />
as a world technology hub.<br />
Figure 4 The biggest percentage price rises in 2011<br />
<strong>com</strong>pared with 2010<br />
Destination 2011 2010 % change<br />
Christchurch £81 £58 41%<br />
Ibiza £115 £82 39%<br />
Amalfi £183 £144 27%<br />
Cancun £124 £98 27%<br />
Palo Alto £151 £119 27%<br />
Brisbane £110 £87 26%<br />
Jakarta £88 £71 25%<br />
Deauville £144 £118 22%<br />
Perth £115 £94 22%<br />
Wellington £72 £59 22%<br />
Como £135 £111 22%<br />
Muscat £219 £185 18%<br />
Hong Kong £119 £101 18%<br />
Jerusalem £123 £105 17%<br />
Helsinki £107 £91 17%<br />
Sydney £119 £101 17%<br />
The <strong>Hotel</strong> <strong>Price</strong> <strong>Index</strong> review of global hotel prices: Jan-Dec 2011<br />
25
Fastest fallers<br />
• Five of the top six heaviest fallers were located in<br />
the Middle East. The Arab Spring and war in Libya<br />
led to a decline in demand from both international<br />
travellers and those within the region. Popular<br />
Egyptian destinations Luxor and Sharm El Sheikh<br />
dropped 29% and 26% respectively. There was also<br />
a steep fall in Tunis, where average room rates<br />
declined by 28%.<br />
• The effects of the political upheaval spread to other<br />
cities in the region. The Qatari capital Doha fell by<br />
27%, Beirut dropped 23% and Abu Dubai slipped 10%.<br />
These changes were also fuelled by a <strong>com</strong>bination<br />
of increased capacity as new hotels opened and<br />
the rising cost of flights to the region which kept<br />
travellers away.<br />
• Travellers to South Africa enjoyed lower prices<br />
in the aftermath of the 2010 football World Cup.<br />
Popular stadium cities experienced sharp price<br />
drops as demand tailed off and hoteliers modified<br />
their prices in the face of falling demand. <strong>Room</strong><br />
rates tumbled 11% in Cape Town, a base for many<br />
England supporters.<br />
• Far Eastern cities featured prominently in the list<br />
with prices falling in Phnom Penh by 23%, Hanoi<br />
by 17% and in Manila by 11%. There was a 17% drop<br />
in Shanghai as the city’s hotel sector re-adjusted<br />
after the World Expo in 2010 and because of greater<br />
room capacity from new developments.<br />
• The impact of the Japanese earthquake, tsunami<br />
and nuclear crisis of March 2011 hit Hiroshima, down<br />
16% and Kyoto, down 11%.<br />
Figure 5 The biggest percentage price falls in 2011<br />
<strong>com</strong>pared with 2010<br />
Destination 2011 2010 % change<br />
Luxor £53 £75 -29%<br />
Tunis £77 £107 -28%<br />
Doha £122 £169 -27%<br />
Sharm El Sheikh £69 £93 -26%<br />
Phnom Penh £52 £40 -23%<br />
Beirut £109 £141 -23%<br />
Hanoi £43 £52 -17%<br />
Shanghai £76 £91 -17%<br />
Hiroshima £67 £80 -16%<br />
Nairobi £128 £111 -14%<br />
Cape Town £106 £119 -11%<br />
Kyoto £91 £102 -11%<br />
Manila £51 £57 -11%<br />
Abu Dhabi £104 £116 -10%<br />
Athens £80 £89 -10%<br />
26 The <strong>Hotel</strong> <strong>Price</strong> <strong>Index</strong> review of global hotel prices: Jan-Dec 2011
Figure 6 The biggest percentage price rises and falls in 2011 <strong>com</strong>pared with 2010<br />
40%<br />
30%<br />
20%<br />
10%<br />
0%<br />
-10%<br />
-20%<br />
Christchurch<br />
Ibiza<br />
Amalfi<br />
Cancun<br />
Palo Alto<br />
Brisbane<br />
Jakarta<br />
Deauville<br />
Perth<br />
Wellington<br />
Como<br />
Muscat<br />
Hong Kong<br />
Jerusalem<br />
Helsinki<br />
Sydney<br />
Abu Dhabi<br />
Athens<br />
Cape Town<br />
Kyoto<br />
Manila<br />
Nairobi<br />
Hiroshima<br />
Hanoi<br />
Shanghai<br />
Phnom Penh<br />
Beirut<br />
Sharm El Sheikh<br />
Doha<br />
Tunis<br />
Luxor<br />
-30%<br />
Christchurch<br />
Kyoto<br />
The <strong>Hotel</strong> <strong>Price</strong> <strong>Index</strong> review of global hotel prices: Jan-Dec 2011<br />
27
GLOBAL HOTEL PRICE CHANGES<br />
2011-2010<br />
San Francisco<br />
14%<br />
£113<br />
7%<br />
£111<br />
-2%<br />
£92<br />
4%<br />
£173<br />
New Orleans<br />
New York<br />
Marrakech<br />
Dublin<br />
7%<br />
£73<br />
Paris<br />
London<br />
Helsinki<br />
17%<br />
£107<br />
Monte Carlo 2%<br />
£185<br />
Barcelona<br />
8%<br />
£104<br />
-4%<br />
£71<br />
1%<br />
£115<br />
3%<br />
£125<br />
Berlin<br />
-3%<br />
£73<br />
Los Angeles<br />
Cancun<br />
27%<br />
£124<br />
13%<br />
£156<br />
Rio de Janeiro<br />
Buenos Aires<br />
7%<br />
£96<br />
7%<br />
£126<br />
Sao Paulo<br />
28 The <strong>Hotel</strong> <strong>Price</strong> <strong>Index</strong> review of global hotel prices: Jan-Dec 2011
Geneva<br />
12% 14%<br />
£165 £171<br />
Sharm El Sheikh<br />
-26%<br />
£69<br />
Moscow<br />
9%<br />
£164<br />
Doha<br />
-27%<br />
£122<br />
Muscat<br />
18%<br />
£219<br />
Dubai<br />
-1%<br />
£119<br />
4%<br />
£111<br />
Bangkok<br />
0%<br />
£58<br />
Beijing<br />
2%<br />
£70<br />
Hong Kong<br />
18%<br />
£119<br />
Kyoto<br />
-11%<br />
£91<br />
Tokyo<br />
-2%<br />
£102<br />
Nairobi<br />
-14%<br />
£111<br />
Mumbai<br />
Singapore<br />
11%<br />
£136<br />
Cape Town<br />
-11%<br />
£106<br />
Perth<br />
22%<br />
£115<br />
Sydney<br />
17%<br />
£119<br />
The <strong>Hotel</strong> <strong>Price</strong> <strong>Index</strong> review of global hotel prices: Jan-Dec 2011<br />
29
3. PRICE CHANGES BY COUNTRY<br />
Oman became the most expensive country featured<br />
in the report for UK travellers after it posted the biggest<br />
increase in prices. A 19% hike caused the average<br />
cost of rooms to grow to £217. This occurred after the<br />
development of more upscale ac<strong>com</strong>modation and<br />
rising demand from European travellers. Switzerland,<br />
with its strong currency, was the most expensive<br />
European country of the nations analysed for UK<br />
travellers, up 11% to £146.<br />
<strong>Price</strong>s rose in two-thirds of countries favoured by UK<br />
travellers in 2011, according to the latest <strong>Hotel</strong><br />
<strong>Price</strong> <strong>Index</strong>.<br />
There were also significant falls triggered by political<br />
and economic crises and natural disasters.<br />
The biggest fallers were in the Middle East, where the<br />
Switzerland<br />
widespread political instability, civil unrest and the<br />
war in Libya led to a dramatic fall-off in demand and a<br />
slump in prices.<br />
The steepest drop came in Qatar where the average<br />
room rate fell 27% to £122. Average room rates in<br />
Egypt slipped 22% to £71 as tourists stayed away and<br />
Lebanon dropped 21%, as a result of protests and<br />
mounting violence in neighbouring Syria. There was<br />
also a 9% reduction to £61 in Tunisia where the Arab<br />
Spring began.<br />
The United Arab Emirates, including the popular tourist<br />
and business destination of Dubai, also dropped 2% as<br />
the fall-out from the uprisings spread across the region<br />
to effect even those markets which had avoided<br />
the turmoil.<br />
United Arab Emirates<br />
30 The <strong>Hotel</strong> <strong>Price</strong> <strong>Index</strong> review of global hotel prices: Jan-Dec 2011
Japan<br />
Lithuania was up 14% to £55, Estonia up 11% to £60 and<br />
Latvia up 8% to £57, rates that still represented excellent<br />
value for visitors.<br />
The South African hotel sector re-adjusted after the<br />
surge in prices before and during the 2010 football<br />
World Cup. A fall of 9% took the average room rate<br />
to £107.<br />
Average room rates in Japan slipped 6% as a result<br />
of the earthquake, tsunami and meltdown at the<br />
Fukushima nuclear plant in March 2011.<br />
There was a rally in prices in the struggling Eurozone<br />
countries of Spain and Italy, which both rose 5%.<br />
Portugal increased 2% as travellers switched away<br />
from North Africa and the Middle East to “safer” holiday<br />
destinations. The average Irish price also rose 6% to<br />
£73, despite mounting economic woes. This was partly<br />
due to the interest sparked by the State visits in May<br />
2011 and a stabilisation of prices that had fallen 35%, the<br />
heaviest slump in Europe, over the past three years.<br />
There was a 13% rise in the average hotel price in<br />
Australia, reflecting its strong currency and robust<br />
economy and a 12% rise in New Zealand, fuelled by<br />
high demand around the Rugby World Cup. Singapore<br />
also reported a big leap of 11% due to its burgeoning<br />
reputation as a tourist and business hub and the<br />
construction of new premium developments.<br />
Singapore<br />
The Baltic states showed some of the steepest<br />
increases from travellers attracted by low prices.<br />
The <strong>Hotel</strong> <strong>Price</strong> <strong>Index</strong> review of global hotel prices: Jan-Dec 2011<br />
31
Iceland bounced back after the chaos wrought by the<br />
volcanic ash cloud in April 2010 and the collapse of the<br />
domestic banking sector with prices up 6%.<br />
Oman<br />
Three of the BRIC nations posted increases: Brazil and<br />
Russia were both up 9%, and China up 5%, evidence<br />
of the countries’ growing economic importance as<br />
business hubs. In contrast, India was down 4% to £83<br />
as the value of the Rupee fell against the Pound.<br />
The average room rate in the USA rose 3% to £108 as<br />
there was less discounting among hoteliers. The return<br />
of the business traveller and influx of leisure travellers<br />
from the Eurozone boosted demand.<br />
Out of the 71 countries surveyed, the UK was one of 23<br />
where hotel prices fell, down 1% to £82.<br />
United Kingdom<br />
Figure 7 Average room prices and changes in 2011<br />
<strong>com</strong>pared with 2010 by country<br />
Destination 2011 2010 % change<br />
Oman £217 £182 19%<br />
Mauritius £161 £184 -13%<br />
Switzerland £146 £131 11%<br />
Russia £145 £132 9%<br />
Brazil £140 £129 9%<br />
Singapore £136 £123 11%<br />
Israel £133 £128 4%<br />
Norway £124 £120 3%<br />
Jordan £123 £121 2%<br />
Qatar £122 £169 -27%<br />
32 The <strong>Hotel</strong> <strong>Price</strong> <strong>Index</strong> review of global hotel prices: Jan-Dec 2011
Destination 2011 2010 % change<br />
Sweden £117 £105 12%<br />
United Arab Emirates £116 £119 -2%<br />
Kenya £116 £123 -6%<br />
Puerto Rico £115 £115 -1%<br />
Croatia £113 £115 -1%<br />
Saudi Arabia £113 £123 -8%<br />
Italy £112 £107 5%<br />
Lebanon £111 £140 -21%<br />
Denmark £111 £102 9%<br />
United States of America £108 £105 3%<br />
Australia £108 £95 13%<br />
Colombia £108 £103 5%<br />
South Africa £107 £118 -9%<br />
Mexico £106 £94 13%<br />
Dominican Republic £106 £100 6%<br />
Netherlands £106 £99 7%<br />
Finland £105 £91 15%<br />
France £103 £101 2%<br />
South Korea £103 £98 5%<br />
Canada £102 £101 1%<br />
Cyprus £102 £98 5%<br />
Chile £101 £92 11%<br />
Argentina £97 £91 7%<br />
Austria £97 £93 4%<br />
Destination 2011 2010 % change<br />
China £97 £92 5%<br />
Greece £97 £98 -1%<br />
Turkey £96 £97 -1%<br />
Belgium £94 £91 4%<br />
Indonesia £94 £94 -1%<br />
Ukraine £93 £87 7%<br />
Japan £92 £98 -6%<br />
Costa Rica £91 £88 3%<br />
Taiwan £90 £88 2%<br />
Germany £87 £85 3%<br />
Peru £87 £86 1%<br />
Malaysia £86 £78 10%<br />
Spain & Canary Islands £85 £81 5%<br />
India £83 £86 -4%<br />
UNITED KINGDOM £82 £83 -1%<br />
Portugal £82 £81 2%<br />
Iceland £78 £74 6%<br />
Malta £78 £81 -4%<br />
Ireland £73 £69 6%<br />
New Zealand £73 £65 12%<br />
Morocco £71 £72 -1%<br />
Czech Republic £71 £67 5%<br />
Egypt £71 £90 -22%<br />
Thailand £69 £65 6%<br />
The <strong>Hotel</strong> <strong>Price</strong> <strong>Index</strong> review of global hotel prices: Jan-Dec 2011<br />
33
Destination 2011 2010 % change<br />
Romania £69 £66 4%<br />
Hungary £67 £65 3%<br />
Poland £64 £64 0%<br />
Philippines £63 £65 -3%<br />
Tunisia £61 £67 -9%<br />
Slovakia £61 £63 -4%<br />
Estonia £60 £54 11%<br />
Bulgaria £59 £56 6%<br />
Latvia £57 £53 8%<br />
Lithuania £55 £49 14%<br />
Vietnam £55 £57 -3%<br />
Cambodia £43 £53 -20%<br />
Finland<br />
Figure 8 Average room prices and changes in 2011<br />
<strong>com</strong>pared with 2010 by price rises<br />
Destination 2011 2010 % change<br />
Oman £217 £182 19%<br />
Finland £105 £91 15%<br />
Lithuania £55 £49 14%<br />
Australia £108 £95 13%<br />
Mexico £106 £94 13%<br />
New Zealand £73 £65 12%<br />
Sweden £117 £105 12%<br />
Estonia £60 £54 11%<br />
Switzerland £146 £131 11%<br />
Singapore £136 £123 11%<br />
Chile £101 £92 11%<br />
Malaysia £86 £78 10%<br />
Russia £145 £132 9%<br />
Denmark £111 £102 9%<br />
Brazil £140 £129 9%<br />
Latvia £57 £53 8%<br />
34 The <strong>Hotel</strong> <strong>Price</strong> <strong>Index</strong> review of global hotel prices: Jan-Dec 2011
Figure 9 Average room prices and changes in 2011<br />
<strong>com</strong>pared with 2010 by price falls<br />
Destination 2011 2010 % change<br />
United Arab Emirates<br />
Qatar £122 £169 -27%<br />
Egypt £71 £90 -22%<br />
Lebanon £111 £140 -21%<br />
Cambodia £43 £53 -20%<br />
Mauritius £161 £184 -13%<br />
Tunisia £61 £67 -9%<br />
South Africa £107 £118 -9%<br />
Saudi Arabia £113 £123 -8%<br />
Japan £92 £98 -6%<br />
Kenya £116 £123 -6%<br />
Slovakia £61 £63 -4%<br />
India £83 £86 -4%<br />
Malta £78 £81 -4%<br />
Vietnam £55 £57 -3%<br />
Philippines £63 £65 -3%<br />
United Arab Emirates £116 £119 -2%<br />
The <strong>Hotel</strong> <strong>Price</strong> <strong>Index</strong> review of global hotel prices: Jan-Dec 2011<br />
35
£150<br />
£140<br />
Brazil<br />
£140 9%<br />
£130<br />
£120<br />
£110<br />
£100<br />
£90<br />
USA<br />
£108 3% Mexico<br />
£106 13%<br />
Canada<br />
£102 1%<br />
Argentina<br />
£97 7%<br />
Turkey<br />
£96 -1%<br />
£80<br />
UK<br />
£82 -1%<br />
Spain & Canary<br />
Islands<br />
£85 5%<br />
Germany<br />
£87 3%<br />
India<br />
£83 -4%<br />
£70<br />
Egypt<br />
£71 -22%<br />
Ireland<br />
£73 6%<br />
Thailand<br />
£69 6%<br />
New Zealand<br />
£73 12%<br />
£60<br />
Estonia<br />
£60 11%
£150<br />
Russia<br />
£145 9%<br />
Switzerland<br />
£146 11%<br />
£140<br />
Singapore<br />
£136 11%<br />
£130<br />
£120<br />
France<br />
£103 2%<br />
Netherlands<br />
£106 7%<br />
Italy<br />
£112 5%<br />
Sweden<br />
£117 12%<br />
Australia<br />
£108 13%<br />
£110<br />
£100<br />
Japan<br />
£92 -6%<br />
Indonesia<br />
£94 -1%<br />
China<br />
£97 5%<br />
£90<br />
Malaysia<br />
£86 10%<br />
£80<br />
GLOBAL HOTEL PRICE<br />
CHANGES BY COUNTRY 2011-2010<br />
£70<br />
£60
4. FOCUS ON THE UK<br />
<strong>Hotel</strong> room rates fell on average by just 1%, from £83 to<br />
£82 a night, across the UK from 2010 to 2011.<br />
Discounting by UK hoteliers in January absorbed the<br />
2.5% increase in Value Added Tax to 20% and a growth<br />
in budget hotel chains also kept prices down.<br />
of growth as Aberdeen rose 2% to £79 per night and<br />
Glasgow edged up 1% to £71 per night. However, room<br />
rates in Edinburgh slipped 4% to £96 a night.<br />
London<br />
However, the overall picture masked some dramatic<br />
price movements across the country.<br />
The most expensive UK destination was the university<br />
city of St. Andrews in Scotland. Average hotel prices<br />
in the city where Prince William met Kate Middleton<br />
were at £143, even with a 12% fall. In the rest of Scotland,<br />
Aberdeen and Glasgow both reported moderate signs<br />
St. Andrews<br />
Despite the riots in August 2011, which attracted<br />
worldwide headlines, London’s hotel sector remained<br />
resilient with the average cost of a room rising 1%<br />
to £115. The city reached full capacity for events<br />
such as the Chelsea Flower Show and Wimbledon<br />
tennis tournament. There was still availability on the<br />
weekend of the Royal Wedding in April 2011 with many<br />
sightseers making day trips or basing themselves in<br />
cheaper locations outside the city and then<br />
travelling in.<br />
A higher tolerance for <strong>com</strong>muting into London led<br />
to some dramatic price rises in towns close to the<br />
38 The <strong>Hotel</strong> <strong>Price</strong> <strong>Index</strong> review of global hotel prices: Jan-Dec 2011
capital, a possible indicator of what could happen<br />
in 2012 with the London Olympics and the Queen’s<br />
Diamond Jubilee. The average hotel price in Watford,<br />
for instance, soared 22% to £77, the second-highest rise<br />
in the UK, and High Wy<strong>com</strong>be leaped 19% to £67.<br />
Many of the major tourist destinations also<br />
experienced an increase in average room prices.<br />
Oxford and Cambridge both climbed 4% to £103 and £97<br />
respectively and York rose 5% to £91. Demand for these<br />
cities stayed steady, helped by an influx of travellers<br />
from the Eurozone taking advantage of the Euro’s<br />
relative strength against the Pound.<br />
Destinations in the Cotswolds experienced a surge in<br />
prices due to the area’s continuing popularity. Witney,<br />
Broadway and Chipping Norton posted rises of 31%, the<br />
highest in the survey, 21% and 16% respectively.<br />
Some traditional seaside resorts also reported big<br />
percentage price rises such as Weston-super-Mare<br />
up 21% to £56, Southend-on-Sea up 18% to £93 and<br />
Scarborough up 6% to £61.<br />
However, there were some pronounced price declines<br />
in Cornwall, with St Austell registering the biggest<br />
drop, down 20% to £103, Newquay down 16% to £79 and<br />
Penzance down 11% to £69.<br />
Oxford<br />
Scarborough<br />
The <strong>Hotel</strong> <strong>Price</strong> <strong>Index</strong> review of global hotel prices: Jan-Dec 2011<br />
39
Figure 10 Average price per room per night in 2011 <strong>com</strong>pared with 2010 across the UK<br />
Average price per room per night 2011 (£) <strong>Price</strong> rise year on year (%) <strong>Price</strong> fall year on year (%)<br />
150<br />
120<br />
90<br />
60<br />
30<br />
0<br />
St. Andrews<br />
Broadway<br />
St. Peter Port<br />
London<br />
Bath<br />
Windsor<br />
St. Helier<br />
Oxford<br />
St. Austell<br />
Windermere<br />
Cambridge<br />
Edinburgh<br />
Southend-on-Sea<br />
Chipping Norton<br />
York<br />
Stratford-upon- Avon<br />
Brighton<br />
Aviemore<br />
Witney<br />
Cheltenham<br />
Aberdeen<br />
Newquay<br />
Newcastle-upon-Tyne<br />
Manchester<br />
Durham<br />
Watford<br />
Canterbury<br />
Portsmouth<br />
Liverpool<br />
Inverness<br />
Cardiff<br />
Bristol<br />
Dundee<br />
Bournemouth<br />
Glasgow<br />
Perth<br />
St. Albans<br />
Penzance<br />
Swansea<br />
High Wy<strong>com</strong>be<br />
Leeds<br />
Southampton<br />
City of Derry<br />
Belfast<br />
Colchester<br />
Nottingham<br />
Sheffield<br />
Scarborough<br />
Birmingham<br />
Blackpool<br />
Weston-super-Mare<br />
Stevenage<br />
40 The <strong>Hotel</strong> <strong>Price</strong> <strong>Index</strong> review of global hotel prices: Jan-Dec 2011
Figure 11 Average price per room per night in 2011<br />
<strong>com</strong>pared with 2010 across the UK<br />
Destination 2011 2010 % change<br />
St. Andrews £143 £162 -12%<br />
Broadway £132 £108 21%<br />
St. Peter Port £116 £105 10%<br />
London £115 £114 1%<br />
Bath £114 £113 1%<br />
Windsor £111 £110 1%<br />
St. Helier £110 £104 5%<br />
Oxford £103 £99 4%<br />
St. Austell £103 £129 -20%<br />
Windermere £99 £122 -19%<br />
Cambridge £97 £94 4%<br />
Edinburgh £96 £101 -4%<br />
Southend-on-Sea £93 £78 18%<br />
Chipping Norton £91 £79 16%<br />
York £91 £87 5%<br />
Stratford-upon- Avon £88 £91 -3%<br />
Brighton £85 £84 2%<br />
Aviemore £83 £96 -13%<br />
Witney £83 £63 31%<br />
Cheltenham £82 £73 12%<br />
Aberdeen £79 £77 2%<br />
Newquay £79 £94 -16%<br />
Destination 2011 2010 % change<br />
Newcastle-upon-Tyne £79 £82 -4%<br />
Manchester £78 £77 1%<br />
Durham £77 £69 11%<br />
Watford £77 £63 22%<br />
Canterbury £77 £81 -5%<br />
Portsmouth £76 £79 -3%<br />
Liverpool £76 £77 -2%<br />
Inverness £75 £76 -2%<br />
Cardiff £74 £74 0%<br />
Bristol £74 £71 4%<br />
Dundee £73 £69 6%<br />
Bournemouth £73 £73 -1%<br />
Glasgow £71 £71 1%<br />
Southend-on-Sea<br />
The <strong>Hotel</strong> <strong>Price</strong> <strong>Index</strong> review of global hotel prices: Jan-Dec 2011<br />
41
Destination 2011 2010 % change<br />
Perth £71 £68 5%<br />
St. Albans £70 £63 10%<br />
Penzance £69 £78 -11%<br />
Swansea £68 £69 -2%<br />
High Wy<strong>com</strong>be £67 £57 19%<br />
Leeds £67 £65 3%<br />
Southampton £67 £72 -7%<br />
City of Derry £65 £60 7%<br />
Belfast £65 £68 -5%<br />
Colchester £63 £62 2%<br />
Nottingham £62 £57 8%<br />
Sheffield £62 £59 4%<br />
Scarborough £61 £58 6%<br />
Birmingham £61 £61 1%<br />
Blackpool £61 £64 -6%<br />
Weston-super-Mare £56 £46 21%<br />
Stevenage £53 £50 5%<br />
Perth<br />
42 The <strong>Hotel</strong> <strong>Price</strong> <strong>Index</strong> review of global hotel prices: Jan-Dec 2011
UK HOTEL PRICE CHANGES 2011-2010<br />
Glasgow<br />
1%<br />
£71<br />
-4%<br />
£96<br />
Edinburgh<br />
-4%<br />
£79<br />
Newcastle-upon-Tyne<br />
Belfast<br />
-5%<br />
£65<br />
Manchester<br />
1%<br />
£78<br />
3%<br />
£67<br />
Leeds<br />
Liverpool<br />
Birmingham<br />
-2%<br />
£76<br />
Cardiff 0%<br />
£74<br />
1%<br />
£61<br />
Witney<br />
31%<br />
£83<br />
8%<br />
£62<br />
Watford<br />
22%<br />
£77<br />
1%<br />
£115<br />
Nottingham<br />
London<br />
Newquay -3%<br />
£76<br />
-16%<br />
£79<br />
2%<br />
£85<br />
Brighton<br />
The <strong>Hotel</strong> <strong>Price</strong> <strong>Index</strong> review of global hotel prices: Jan-Dec 2011<br />
Portsmouth<br />
43
5. PRICES PAID AT HOME AND AWAY<br />
UK travellers were placed ninth in the table of the<br />
biggest spenders abroad on £99. However, they spent<br />
£17 less at £82 a night on domestic hotel rooms.<br />
The Japanese were the biggest spenders on hotel<br />
rooms when they travelled abroad in 2011, according<br />
to the <strong>Hotel</strong>s.<strong>com</strong> <strong>Hotel</strong> <strong>Price</strong> <strong>Index</strong>. They spent an<br />
average of £116 a night on hotel rooms when they<br />
headed overseas, £5 more than the Swiss and £8<br />
more than the Australians.<br />
The biggest Eurozone spenders on their travels were<br />
the Austrians who parted with an average £97 a night<br />
for a hotel room abroad.<br />
At the other end of the scale, the Mexicans were the<br />
savviest when outside their borders, paying £72 a night<br />
on average, according to the HPI.<br />
The biggest domestic spenders were the Swiss and<br />
the Norwegians who spent £137 and £121 respectively<br />
on hotel rooms at home. The Indians were those<br />
with the best eye for value within their own borders,<br />
spending just £56 when in a domestic destination.<br />
Japan<br />
India<br />
44 The <strong>Hotel</strong> <strong>Price</strong> <strong>Index</strong> review of global hotel prices: Jan-Dec 2011
Figure 12 Average room prices paid by travellers when travelling within their own countries versus those paid overseas<br />
in 2011<br />
Country Away Home Country Away Home<br />
Japan £116 £93<br />
Switzerland £111 £137<br />
Australia £108 £106<br />
United States of America £106 £75<br />
Norway £106 £121<br />
China £103 £94<br />
Russia £102 £99<br />
Sweden £101 £105<br />
UNITED KINGDOM £99 £82<br />
Brazil £98 £103<br />
Austria £97 £83<br />
Ireland £95 £73<br />
Hong Kong £95 £79<br />
Portugal £94 £66<br />
New Zealand £94 £65<br />
Denmark £93 £101<br />
Italy £92 £82<br />
Canada £92 £89<br />
India £91 £56<br />
France £90 £72<br />
Spain & Canary Islands £90 £68<br />
Germany £89 £75<br />
South Korea £88 £99<br />
Finland £88 £93<br />
Netherlands £88 £83<br />
Singapore £87 £118<br />
Mexico £72 £69<br />
Mexico<br />
The <strong>Hotel</strong> <strong>Price</strong> <strong>Index</strong> review of global hotel prices: Jan-Dec 2011<br />
45
6. WHERE TO STAY FOR £100 A NIGHT<br />
With the emphasis on value for money, travellers with<br />
£100 a night to spend on their hotel room could choose<br />
from a wide selection of destinations as they searched<br />
for quality for less.<br />
Two cities offered five-star hotel ac<strong>com</strong>modation<br />
for under £100 a night, Marrakech and Warsaw, both<br />
within a four-hour flight from the UK. There were 20<br />
destinations featured in the HPI offering four-star<br />
ac<strong>com</strong>modation for the same average sum, including<br />
Benidorm, Berlin, Budapest, Dublin, Lisbon and Tallinn<br />
in Europe, Bangkok, Beijing and Shanghai in Asia and<br />
Las Vegas in the United States.<br />
In <strong>com</strong>parison, £100 would have bought travellers a<br />
three-star hotel room in London and Edinburgh but<br />
only one-star in New York and Geneva.<br />
Marrakech<br />
Figure 13 The star rating that can be purchased with<br />
£100 per night in the world’s top cities<br />
Destination GBP 100<br />
Marrakech<br />
Warsaw<br />
Bali<br />
Bangkok<br />
Beijing<br />
Benidorm<br />
Berlin<br />
Brussels<br />
Budapest<br />
Cape Town<br />
Dubai<br />
Dublin<br />
Guangzhou<br />
Istanbul<br />
Las Vegas<br />
Lisbon<br />
Madrid<br />
Pisa<br />
Prague<br />
Shanghai<br />
Tallinn<br />
Vienna<br />
VVVVV<br />
VVVVV<br />
VVVV<br />
VVVV<br />
VVVV<br />
VVVV<br />
VVVV<br />
VVVV<br />
VVVV<br />
VVVV<br />
VVVV<br />
VVVV<br />
VVVV<br />
VVVV<br />
VVVV<br />
VVVV<br />
VVVV<br />
VVVV<br />
VVVV<br />
VVVV<br />
VVVV<br />
VVVV<br />
46 The <strong>Hotel</strong> <strong>Price</strong> <strong>Index</strong> review of global hotel prices: Jan-Dec 2011
Destination GBP 100<br />
Amsterdam<br />
Barcelona<br />
Cancun<br />
Chicago<br />
EDINBURGH<br />
Frankfurt<br />
Helsinki<br />
Hong Kong<br />
Jerusalem<br />
LONDON<br />
Los Angeles<br />
Melbourne<br />
Milan<br />
Moscow<br />
Mumbai<br />
Munich<br />
New Delhi<br />
Nice<br />
Orlando<br />
Rome<br />
Seattle<br />
Seoul<br />
Sydney<br />
Tokyo<br />
VVV<br />
VVV<br />
VVV<br />
VVV<br />
VVV<br />
VVV<br />
VVV<br />
VVV<br />
VVV<br />
VVV<br />
VVV<br />
VVV<br />
VVV<br />
VVV<br />
VVV<br />
VVV<br />
VVV<br />
VVV<br />
VVV<br />
VVV<br />
VVV<br />
VVV<br />
VVV<br />
VVV<br />
Destination GBP 100<br />
Toronto<br />
Boston<br />
Copenhagen<br />
Miami<br />
Montreal<br />
Oslo<br />
Paris<br />
San Francisco<br />
Seattle<br />
Singapore<br />
Stockholm<br />
Vancouver<br />
Venice<br />
Washington<br />
Zurich<br />
Geneva<br />
New York<br />
VVV<br />
VV<br />
VV<br />
VV<br />
VV<br />
VV<br />
VV<br />
VV<br />
VV<br />
VV<br />
VV<br />
VV<br />
VV<br />
VV<br />
VV<br />
V<br />
V<br />
The <strong>Hotel</strong> <strong>Price</strong> <strong>Index</strong> review of global hotel prices: Jan-Dec 2011<br />
47
7. AVERAGE ROOM PRICES BY STAR<br />
RATING<br />
<strong>Hotel</strong>s.<strong>com</strong> analysed the average prices paid for hotel<br />
rooms across different star ratings in the world’s top<br />
cities.<br />
The data demonstrates where UK travellers could find<br />
best value.<br />
The Polish capital of Warsaw offered the best deal<br />
on luxury for less with five-star rooms costing just<br />
£84 a night with Marrakech slightly higher at £90. The<br />
Moroccan city also provided one of the best four-star<br />
rates for only £64.<br />
At the other end of the scale, New York was home<br />
to the most expensive five-star rooms at £340 and<br />
the city also provided the most expensive four-star<br />
ac<strong>com</strong>modation at £200.<br />
Average prices in London at £225 were much lower<br />
than New York which offered five-star luxury for £340.<br />
The UK capital also slipped out of the Top 10 list of<br />
most expensive places for top-end ac<strong>com</strong>modation.<br />
Figure 14 Average hotel room prices by star rating<br />
during 2011<br />
Destination<br />
V V<br />
V V V<br />
V V<br />
V V<br />
V V V V V<br />
Amsterdam £77 £98 £121 £172<br />
Bali N/A £52 £97 £187<br />
Bangkok £23 £31 £64 £128<br />
Barcelona £65 £90 £105 £191<br />
Beijing £45 £45 £71 £122<br />
Benidorm £32 £63 £77 N/A<br />
Berlin £54 £56 £73 £114<br />
Boston £90 £124 £166 N/A<br />
Brussels £73 £82 £96 £119<br />
Budapest £33 £44 £64 £105<br />
Cancun £38 £86 £184 £233<br />
Cape Town £77 £75 £99 £178<br />
Chicago £73 £95 £127 £246<br />
Copenhagen £73 £105 £122 £158<br />
Dubai £50 £55 £84 £187<br />
Dublin £44 £62 £81 £143<br />
EDINBURGH £68 £78 £103 £144<br />
Frankfurt £71 £82 £103 £179<br />
Geneva £106 £131 £169 £287<br />
Guangzhou N/A £57 £96 £188<br />
Helsinki £62 £93 £111 £170<br />
Hong Kong £43 £89 £127 £225<br />
48 The <strong>Hotel</strong> <strong>Price</strong> <strong>Index</strong> review of global hotel prices: Jan-Dec 2011
Destination<br />
V V<br />
V V V<br />
V V<br />
V V<br />
V V V V V<br />
Istanbul £47 £65 £88 £147<br />
Jerusalem £70 £90 £167 £202<br />
Las Vegas £33 £45 £83 £148<br />
Lisbon £48 £56 £77 £115<br />
LONDON £67 £89 £130 £225<br />
Los Angeles £63 £99 £183 £231<br />
Madrid £56 £73 £87 £148<br />
Marrakech N/A £52 £64 £90<br />
Melbourne N/A £68 £103 £153<br />
Miami £68 £108 £183 N/A<br />
Milan N/A £80 £114 £207<br />
Montreal £71 £103 £138 N/A<br />
Moscow N/A £92 £151 £209<br />
Mumbai £43 £72 £107 £155<br />
Munich £67 £83 £106 £166<br />
New Delhi £29 £45 £105 £154<br />
New York £110 £156 £200 £340<br />
Nice £66 £89 £134 £214<br />
Orlando £38 £64 £116 £163<br />
Oslo £60 £101 £123 £157<br />
Paris £78 £108 £156 £326<br />
Pisa N/A £78 £85 £121<br />
Prague N/A £52 £68 £124<br />
Rome £75 £95 £118 £226<br />
Destination<br />
V V<br />
V V V<br />
V V<br />
V V<br />
V V<br />
V V V<br />
San Francisco £73 £111 £149 N/A<br />
Seattle £75 £101 £138 £151<br />
Seoul N/A £64 £114 £173<br />
Shanghai £22 £52 £74 £150<br />
Singapore £56 £101 £145 £234<br />
Stockholm £69 £105 £137 £160<br />
Sydney £55 £77 £122 £187<br />
Tallinn £40 £44 £63 £112<br />
Tokyo £52 £86 £147 £292<br />
Toronto £71 £94 £131 N/A<br />
Vancouver £73 £101 £142 £251<br />
Venice £82 £115 £142 £254<br />
Vienna £43 £77 £90 £158<br />
Warsaw N/A £64 £76 £84<br />
Washington £80 £115 £147 £254<br />
Zurich £84 £131 £155 £171<br />
<strong>Hotel</strong> star ratings explained<br />
There is no universal star rating system. Each<br />
country has its own, and in some cases, such<br />
as the UK, more than one. This means travellers<br />
should be aware of a possible disparity of<br />
standards and facilities when booking rooms with<br />
the same star ratings in different countries.<br />
The <strong>Hotel</strong> <strong>Price</strong> <strong>Index</strong> review of global hotel prices: Jan-Dec 2011<br />
49
Figure 15 Top 10 most expensive cities for five-star<br />
hotels<br />
Destination<br />
V V V V V<br />
New York £340<br />
Paris £326<br />
Tokyo £292<br />
Geneva £287<br />
Venice £254<br />
Washington £254<br />
Vancouver £251<br />
Chicago £246<br />
Singapore £234<br />
Cancun £233<br />
New York<br />
Paris<br />
50 The <strong>Hotel</strong> <strong>Price</strong> <strong>Index</strong> review of global hotel prices: Jan-Dec 2011
8. LUXURY FOR LESS<br />
The falling cost of luxury<br />
UK travellers searching for the best in hotel<br />
ac<strong>com</strong>modation were able to benefit from dramatic<br />
price falls across the world in 2011.<br />
For example, five-star prices tumbled 26% in Cape<br />
Town as the market re-adjusted from the heavy<br />
demand inflated by the 2010 football World Cup. There<br />
was also a 5% fall for four-star hotels in the South<br />
African city to £99.<br />
Orlando, one the most popular overseas destinations<br />
for UK travellers, saw five-star room rates drop 4%<br />
to £163.<br />
Cape Town<br />
The Far East also offered some of the better discounts<br />
on high-end ac<strong>com</strong>modation. There were falls in both<br />
four- and five-star rooms in Shanghai, down 19% and<br />
12% to £74 and £150, as hoteliers lowered their prices<br />
following high demand in 2010 for the World Expo.<br />
There were good savings on four-star rates in other<br />
Asian destinations such as New Delhi, down 24%,<br />
and Beijing, down 4%, as well as Seoul and flood-hit<br />
Bangkok, both down 3%.<br />
Tokyo, which saw a fall-off in demand after the<br />
earthquake, also experienced a 5% reduction on fourstar<br />
ac<strong>com</strong>modation to £147 and 2% on five-star<br />
to £292.<br />
In Western Europe, five-star rooms cost 8% less in the<br />
Cote d’Azur resort of Nice at £214. There was also a 7%<br />
fall in Edinburgh, the only British city to feature on the<br />
list, with average rates dropping to £144.<br />
Five-star deals at another popular destination,<br />
Marrakech, also fell 5% to £90 due to increased capacity<br />
and a fall-off in demand caused by the negative<br />
perception of the North African region generated by<br />
widespread civil unrest and the war in Libya.<br />
The <strong>Hotel</strong> <strong>Price</strong> <strong>Index</strong> review of global hotel prices: Jan-Dec 2011<br />
51
Figure 16 The falling cost of luxury: where prices at<br />
top-end hotels fell by the greatest extent between 2010<br />
and 2011<br />
Destination Star Rating 2011 2010 % change<br />
VVVVV<br />
VVVV<br />
VVVV<br />
VVVVV<br />
VVVVV<br />
VVVVV<br />
VVVV<br />
VVVVV<br />
VVVV<br />
VVVV<br />
VVVV<br />
VVVVV<br />
VVVVV<br />
VVVVV<br />
VVVV<br />
VVVV<br />
VVVV<br />
VVVV<br />
VVVV<br />
VVVVV<br />
Cape Town £178 £240 -26%<br />
New Delhi £105 £139 -24%<br />
Shanghai £74 £91 -19%<br />
Shanghai £150 £171 -12%<br />
Jerusalem £202 £225 -10%<br />
Nice £214 £233 -8%<br />
Biarritz £140 £152 -8%<br />
EDINBURGH £144 £154 -7%<br />
Sao Paulo £166 £176 -6%<br />
Cape Town £99 £105 -5%<br />
Tokyo £147 £155 -5%<br />
Marrakech £90 £94 -5%<br />
Orlando £163 £170 -4%<br />
Beijing £122 £127 -4%<br />
Benidorm £77 £80 -4%<br />
Marrakech £64 £66 -4%<br />
Seoul £114 £118 -3%<br />
Bangkok £64 £66 -3%<br />
Berlin £73 £75 -3%<br />
Tokyo £292 £299 -2%<br />
Figure 17 Affordable luxury: 15 destinations with the<br />
best-value five-star hotels in 2011<br />
Destination<br />
V V V V V<br />
Warsaw £84<br />
Marrakech £90<br />
Budapest £105<br />
Tallinn £112<br />
Berlin £114<br />
Lisbon £115<br />
Brussels £119<br />
Cairo £119<br />
Pisa £121<br />
Beijing £122<br />
Prague £124<br />
Bangkok £128<br />
Dublin £143<br />
EDINBURGH £144<br />
Istanbul £147<br />
52 The <strong>Hotel</strong> <strong>Price</strong> <strong>Index</strong> review of global hotel prices: Jan-Dec 2011
9. TRAVEL HABITS<br />
Top overseas destinations for UK<br />
travellers<br />
New York retained its position as the most popular<br />
overseas destination for UK travellers in 2011, despite<br />
the average room rate increasing 4% to £173. In fact, as<br />
the Pound gained against the US Dollar, other US cities<br />
featured in the Top 20 list: Las Vegas, San Francisco,<br />
Los Angeles, Orlando and Miami.<br />
Paris was the second-most popular overseas<br />
destination and top European city for UK travellers.<br />
Other traditional European city break favourites also<br />
ranked prominently with Amsterdam, Dublin, Rome,<br />
Barcelona and Berlin all in the top 10.<br />
Other locations included Dubai and the Far East cities<br />
of Hong Kong, Bangkok and Singapore. However, Tokyo,<br />
which was 28th on the list last year, fell out of the top<br />
40 following the aftermath of the earthquake in<br />
March 2011.<br />
Figure 18 Top overseas destinations for UK travellers<br />
Rank Destination Country<br />
1 New York United States<br />
2 Paris France<br />
3 Las Vegas United States<br />
4 Amsterdam Netherlands<br />
5 Dublin Ireland<br />
6 Rome Italy<br />
7 Barcelona Spain & Canary Islands<br />
8 Berlin Germany<br />
9 Dubai United Arab Emirates<br />
10 San Francisco United States<br />
11 Los Angeles United States<br />
12 Orlando United States<br />
13 Hong Kong China<br />
14 Madrid Spain & Canary Islands<br />
15 Bangkok Thailand<br />
16 Prague Czech Republic<br />
17 Venice Italy<br />
18 Sydney Australia<br />
19 Miami United States<br />
20 Singapore Singapore<br />
The <strong>Hotel</strong> <strong>Price</strong> <strong>Index</strong> review of global hotel prices: Jan-Dec 2011<br />
53
Top UK destinations for visitors from<br />
overseas<br />
The top five destinations for visitors to the UK<br />
remained the same as in 2010: London, Edinburgh,<br />
Manchester, Liverpool, and Glasgow.<br />
However, Cambridge moved up three places from 17th<br />
to 14th and Bath climbed from 18th to 15th.<br />
London<br />
Figure 19 Top UK destinations for overseas travellers<br />
Rank Destination<br />
1 London<br />
2 Edinburgh<br />
3 Manchester<br />
4 Liverpool<br />
5 Glasgow<br />
6 Birmingham<br />
7 Belfast<br />
8 Brighton<br />
9 Bristol<br />
10 Aberdeen<br />
11 Oxford<br />
12 Leeds<br />
13 Cardiff<br />
14 Cambridge<br />
15 Bath<br />
16 York<br />
17 Southampton<br />
18 Newcastle-upon-Tyne<br />
19 Nottingham<br />
20 Bournemouth<br />
54 The <strong>Hotel</strong> <strong>Price</strong> <strong>Index</strong> review of global hotel prices: Jan-Dec 2011
Top UK destinations for UK travellers<br />
London again held its place as the most popular<br />
domestic destination, according to the <strong>Hotel</strong>s.<strong>com</strong><br />
<strong>Hotel</strong> <strong>Price</strong> <strong>Index</strong>.<br />
Manchester and Edinburgh came in at number two<br />
and three with Birmingham and Glasgow <strong>com</strong>pleting<br />
the top five list of the most popular home destinations<br />
for UK travellers.<br />
Edinburgh<br />
Figure 20 Top UK destinations for UK travellers<br />
Rank Destination<br />
1 London<br />
2 Manchester<br />
3 Edinburgh<br />
4 Birmingham<br />
5 Glasgow<br />
6 Liverpool<br />
7 Bristol<br />
8 Leeds<br />
9 Cardiff<br />
10 Brighton<br />
11 Bournemouth<br />
12 York<br />
13 Nottingham<br />
14 Belfast<br />
15 Southampton<br />
16 Newcastle-upon-Tyne<br />
17 Blackpool<br />
18 Sheffield<br />
19 Reading<br />
20 Bath<br />
The <strong>Hotel</strong> <strong>Price</strong> <strong>Index</strong> review of global hotel prices: Jan-Dec 2011<br />
55
10. TRAVEL TALK<br />
Attractive accents, the ears have it<br />
When it <strong>com</strong>es to falling in love, Brits find European<br />
accents the most attractive in the world. A <strong>Hotel</strong>s.<strong>com</strong><br />
survey of 2,000 UK adults found that Italian accents<br />
topped the poll for Brits. Here are the top rankings for<br />
the nationalities we prefer to hear:<br />
• Italians, associated with passion, scored the<br />
highest at 20%.<br />
• The Emerald Isle brogue appealed to 13%.<br />
• Spanish señors and señoritas sounded sweet<br />
at 13%.<br />
• The classically romantic French were fourth at 11%.<br />
• There’s nothing like the girl or guy next door, as 11%<br />
of all Brits confessed to liking an English accent the<br />
best.<br />
Venice<br />
Brits hit the language barriers on their<br />
travels<br />
Perhaps one of the reasons Brits love foreign accents<br />
so much is that our own grasp of other languages<br />
can be a bit dubious. Here are some findings of a<br />
<strong>Hotel</strong>s.<strong>com</strong> survey about UK travellers speaking other<br />
languages:<br />
• 19% couldn’t translate “bonjour.”<br />
• 64% were unable to say anything in a<br />
foreign tongue.<br />
56 The <strong>Hotel</strong> <strong>Price</strong> <strong>Index</strong> review of global hotel prices: Jan-Dec 2011
Too paw for a holiday<br />
In a survey of 2,000 adults in the UK, <strong>Hotel</strong>s.<strong>com</strong> has<br />
found that 52% of Brits are planning to cut back on<br />
everyday spending in order to save money to go on<br />
holiday in 2012.<br />
Items Brits plan to cut back on range from food (32%)<br />
and alcohol (39%) to bare essentials such as<br />
deodorant (2%).<br />
Nearly a quarter fear they will not be able to afford to<br />
go away in 2012, while 26% aim to sell possessions in<br />
order to be able to afford it.<br />
Surprisingly, 6% of Brits are planning to go as far as<br />
cutting back on food for their dog or cat!<br />
• 34% were willing to give the local lingo a go when<br />
abroad.<br />
• Only 13% of Britons are able to speak French, 8%<br />
German and 6% Spanish.<br />
• 61% rarely try to speak a foreign language because<br />
they worried about making a mistake (35%),<br />
assumed everyone spoke English (23%) or were not<br />
bothered (16%).<br />
Top 10 items Brits plan to cut back<br />
on in order to get away in 2012:<br />
Clothes 62%<br />
Nights out 50%<br />
Meals at restaurants 48%<br />
Lunch at work 44%<br />
Alcohol 39%<br />
Food 32%<br />
Gig tickets 22%<br />
Magazines 20%<br />
Shoes 18%<br />
The <strong>Hotel</strong> <strong>Price</strong> <strong>Index</strong> review of global hotel prices: Jan-Dec 2011<br />
57
What a wonderful world<br />
<strong>Hotel</strong>s.<strong>com</strong> surveyed people from 24 countries to see<br />
what they thought about the ancient and modern<br />
Wonders of the World 1 . Here are some of the findings:<br />
• 72% recognised The Great Pyramid of Giza, making<br />
it the best-known of the seven ancient Wonders.<br />
• 67% identified The Hanging Gardens of Babylon as<br />
another ancient Wonder, even though it is disputed<br />
whether they even existed. Despite this, 5% of the<br />
French and Koreans claim to have visited them.<br />
• 8% also claimed to have visited the Colossus of<br />
Rhodes, which was destroyed by an earthquake<br />
more than 2,000 years ago.<br />
• More than one in 10 sadly said they had never heard<br />
of the Seven Wonders of the World, with 34% of<br />
Japanese in the dark.<br />
Amongst the British results:<br />
• Of the ancient Seven Wonders of the World, the<br />
only one that still exists today, the Great Pyramid<br />
of Giza, was revealed to have been visited by 21% of<br />
those surveyed.<br />
• 3% believed that they have visited the statue<br />
of Zeus at Olympia, despite the statue being<br />
destroyed by Roman Emperor Caligua in the fifth<br />
Century, and a further 5% admitted to having visited<br />
the Temple of Artemis at Olympia, although it was<br />
destroyed by fire in 401 AD.<br />
• The survey also revealed the UK landmarks that<br />
the British believed should be included in list of the<br />
‘Ancient Seven Wonders of Britain’. These include<br />
St Paul’s Cathedral (42%), Edinburgh Castle (39%) and<br />
Big Ben (36%).<br />
• When asked about the new Seven Wonders of<br />
the World, 68% recognised the Great Wall of China,<br />
followed by 59% for the Taj Mahal and 44% for the<br />
Colosseum in Rome.<br />
1 Details on the new Wonders of the World can be found here: http://www.new7wonders.<strong>com</strong>/<br />
58 The <strong>Hotel</strong> <strong>Price</strong> <strong>Index</strong> review of global hotel prices: Jan-Dec 2011
SEVEN WONDERS OF THE WORLD<br />
Which Ancient Wonders of the World can you identify<br />
44% 51% 67%<br />
Temple of<br />
Artemis at<br />
Ephesus<br />
Lighthouse<br />
of Alexandria<br />
Hanging<br />
Gardens of<br />
Babylon<br />
72% 59% 45% 31%<br />
Great Pyramid<br />
of Giza<br />
Colossus of<br />
Rhodes<br />
Statue of Zeus<br />
at Olympia<br />
Mausoleum of<br />
Maussollos at<br />
Halicarnassus<br />
Which Modern Wonders of the World can you identify<br />
32% 43% 59%<br />
Petra<br />
Jordan<br />
Machu Picchu<br />
Peru<br />
Taj Mahal<br />
India<br />
68% 44% 36% 31%<br />
Great Wall of<br />
China<br />
Colosseum<br />
Italy<br />
Christ the<br />
Redeemer<br />
Brazil<br />
Chichen Itza<br />
Mexico<br />
Which building would you add to the Wonders of the World<br />
10% 10% 11%<br />
Leaning Tower<br />
of Pisa<br />
Italy<br />
Angkor Wat<br />
Cambodia<br />
Moai<br />
Easter Island<br />
13% 11% 10% 8%<br />
Stonehenge<br />
England<br />
Terracotta<br />
Army<br />
China<br />
Eiffel Tower<br />
France<br />
Sydney Opera<br />
House<br />
Australia<br />
The <strong>Hotel</strong> <strong>Price</strong> <strong>Index</strong> review of global hotel prices: Jan-Dec 2011<br />
59
ABOUT HOTELS.COM<br />
As part of the Expedia Inc group, which operates in<br />
all major markets, <strong>Hotel</strong>s.<strong>com</strong> offers almost 149,000<br />
quality hotels, B&Bs and serviced apartments<br />
worldwide. If a customer can find the same deal for<br />
less on a prepaid hotel, <strong>Hotel</strong>s.<strong>com</strong> will match it.<br />
<strong>Hotel</strong>s.<strong>com</strong> benefits from one of the largest hotel<br />
contracting teams in the industry negotiating the best<br />
rates for its customers, plus there are more than<br />
3 million reviews from users who have actually stayed<br />
in the hotels to ensure customers make an informed<br />
choice when booking.<br />
During 2011, <strong>Hotel</strong>s.<strong>com</strong> launched a specially-designed<br />
app for the iPad and several smart phone apps, all<br />
available to download for free. These allow users to<br />
search and book more than 20,000 last minute deals<br />
from around the world. Available in more than 30<br />
languages, the apps also allow users to sort and filter<br />
hotels, browse user reviews plus find last minute hotel<br />
deals close to their location. <strong>Hotel</strong>s.<strong>com</strong> has recently<br />
launched its Wel<strong>com</strong>e Rewards customer loyalty<br />
programme worldwide, where customers can earn<br />
a free night for every ten nights stayed (subject to<br />
Wel<strong>com</strong>e Rewards terms and conditions as set out at<br />
www.hotels.<strong>com</strong>).<br />
online travel websites in the U.S, and won first place in<br />
six other categories, including the key service areas of<br />
customer satisfaction, customer support and booking<br />
process, achieving a total of 12 top three places overall,<br />
improving its scores in 14 out of the 16 categories,<br />
<strong>com</strong>pared to the 2010 results.<br />
Travellers can book online or by contacting one of the<br />
multilingual call centres on 0203 024 8216.<br />
The <strong>com</strong>pany currently operates more than 85<br />
<strong>Hotel</strong>s.<strong>com</strong> sites around the world including 33 sites<br />
in 24 languages across EMEA. The European sites<br />
attract several million unique users every month and<br />
thousands of people book bed night through<br />
<strong>Hotel</strong>s.<strong>com</strong> every day.<br />
In 2011, <strong>Hotel</strong>s.<strong>com</strong> was named “Best Overall Customer<br />
Experience” according to a study by Keynote<br />
Competitive Research that examined nine of the top<br />
60 The <strong>Hotel</strong> <strong>Price</strong> <strong>Index</strong> review of global hotel prices: Jan-Dec 2011
For further information<br />
For more information/press enquiries or spokespeople<br />
for any global region, please contact:<br />
Yvonne Bonanati<br />
+44 (0)20 7019 2815<br />
ybonanati@hotels.<strong>com</strong><br />
Kate Hopcraft<br />
Zoe Chan<br />
+44 (0)20 7019 2165<br />
khopcraft@hotels.<strong>com</strong><br />
+852 3607 5719<br />
zchan@expedia.<strong>com</strong><br />
Alison Couper<br />
+44 (0)20 7019 2360<br />
acouper@hotels.<strong>com</strong><br />
The <strong>Hotel</strong> <strong>Price</strong> <strong>Index</strong> review of global hotel prices: Jan-Dec 2011<br />
61
GLOBAL HOTEL PRICE CHANGES<br />
2011-2010
© 2012 <strong>Hotel</strong>s.<strong>com</strong>, L.P. The <strong>Hotel</strong> <strong>Price</strong> <strong>Index</strong> (HPI ® ), this report and its contents are the copyright of <strong>Hotel</strong>s.<strong>com</strong>, L.P. All rights reserved.<br />
Any reproduction of this report or its contents must acknowledge www.hotels.<strong>com</strong> as the source.