Maier et al. 2008 - UNIC, CNRS
Maier et al. 2008 - UNIC, CNRS
Maier et al. 2008 - UNIC, CNRS

Create successful ePaper yourself
Turn your PDF publications into a flip-book with our unique Google optimized e-Paper software.
ARTICLES<br />
© <strong>2008</strong> Nature Publishing Group http://www.nature.com/natureneuroscience<br />
Divergence of fMRI and neur<strong>al</strong> sign<strong>al</strong>s in V1 during<br />
perceptu<strong>al</strong> suppression in the awake monkey<br />
Alexander <strong>Maier</strong> 1 , Melanie Wilke 1 , Christopher Aura 1 , Charles Zhu 2 , Frank Q Ye 2 & David A Leopold 1,2<br />
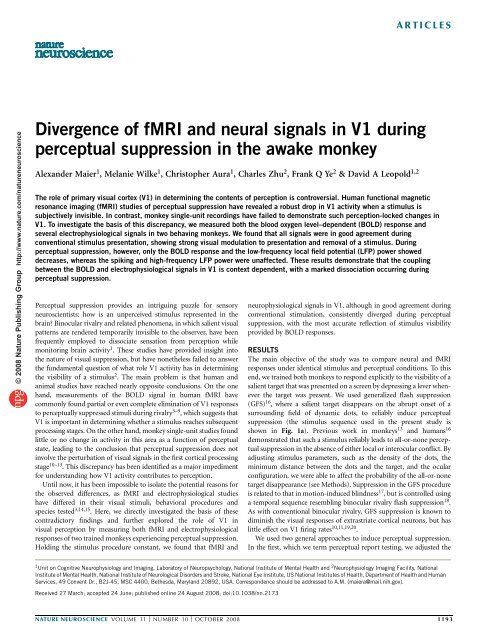
The role of primary visu<strong>al</strong> cortex (V1) in d<strong>et</strong>ermining the contents of perception is controversi<strong>al</strong>. Human function<strong>al</strong> magn<strong>et</strong>ic<br />
resonance imaging (fMRI) studies of perceptu<strong>al</strong> suppression have reve<strong>al</strong>ed a robust drop in V1 activity when a stimulus is<br />
subjectively invisible. In contrast, monkey single-unit recordings have failed to demonstrate such perception-locked changes in<br />
V1. To investigate the basis of this discrepancy, we measured both the blood oxygen level–dependent (BOLD) response and<br />
sever<strong>al</strong> electrophysiologic<strong>al</strong> sign<strong>al</strong>s in two behaving monkeys. We found that <strong>al</strong>l sign<strong>al</strong>s were in good agreement during<br />
convention<strong>al</strong> stimulus presentation, showing strong visu<strong>al</strong> modulation to presentation and remov<strong>al</strong> of a stimulus. During<br />
perceptu<strong>al</strong> suppression, however, only the BOLD response and the low-frequency loc<strong>al</strong> field potenti<strong>al</strong> (LFP) power showed<br />
decreases, whereas the spiking and high-frequency LFP power were unaffected. These results demonstrate that the coupling<br />
b<strong>et</strong>ween the BOLD and electrophysiologic<strong>al</strong> sign<strong>al</strong>s in V1 is context dependent, with a marked dissociation occurring during<br />
perceptu<strong>al</strong> suppression.<br />
Perceptu<strong>al</strong> suppression provides an intriguing puzzle for sensory<br />
neuroscientists: how is an unperceived stimulus represented in the<br />
brain Binocular riv<strong>al</strong>ry and related phenomena, in which s<strong>al</strong>ient visu<strong>al</strong><br />
patterns are rendered temporarily invisible to the observer, have been<br />
frequently employed to dissociate sensation from perception while<br />
monitoring brain activity 1 . These studies have provided insight into<br />
the nature of visu<strong>al</strong> suppression, but have non<strong>et</strong>heless failed to answer<br />
the fundament<strong>al</strong> question of what role V1 activity has in d<strong>et</strong>ermining<br />
the visibility of a stimulus 2 . The main problem is that human and<br />
anim<strong>al</strong> studies have reached nearly opposite conclusions. On the one<br />
hand, measurements of the BOLD sign<strong>al</strong> in human fMRI have<br />
commonly found parti<strong>al</strong> or even compl<strong>et</strong>e elimination of V1 responses<br />
to perceptu<strong>al</strong>ly suppressed stimuli during riv<strong>al</strong>ry 3–9 , which suggests that<br />
V1 is important in d<strong>et</strong>ermining wh<strong>et</strong>her a stimulus reaches subsequent<br />
processing stages. On the other hand, monkey single-unit studies found<br />
little or no change in activity in this area as a function of perceptu<strong>al</strong><br />
state, leading to the conclusion that perceptu<strong>al</strong> suppression does not<br />
involve the perturbation of visu<strong>al</strong> sign<strong>al</strong>s in the first cortic<strong>al</strong> processing<br />
stage 10–13 . This discrepancy has been identified as a major impediment<br />
for understanding how V1 activity contributes to perception.<br />
Until now, it has been impossible to isolate the potenti<strong>al</strong> reasons for<br />
the observed differences, as fMRI and electrophysiologic<strong>al</strong> studies<br />
have differed in their visu<strong>al</strong> stimuli, behavior<strong>al</strong> procedures and<br />
species tested 3,14,15 . Here, we directly investigated the basis of these<br />
contradictory findings and further explored the role of V1 in<br />
visu<strong>al</strong> perception by measuring both fMRI and electrophysiologic<strong>al</strong><br />
responses of two trained monkeys experiencing perceptu<strong>al</strong> suppression.<br />
Holding the stimulus procedure constant, we found that fMRI and<br />
neurophysiologic<strong>al</strong> sign<strong>al</strong>s in V1, <strong>al</strong>though in good agreement during<br />
convention<strong>al</strong> stimulation, consistently diverged during perceptu<strong>al</strong><br />
suppression, with the most accurate reflection of stimulus visibility<br />
provided by BOLD responses.<br />
RESULTS<br />
The main objective of the study was to compare neur<strong>al</strong> and fMRI<br />
responses under identic<strong>al</strong> stimulus and perceptu<strong>al</strong> conditions. To this<br />
end, we trained both monkeys to respond explicitly to the visibility of a<br />
s<strong>al</strong>ient targ<strong>et</strong> that was presented on a screen by depressing a lever whenever<br />
the targ<strong>et</strong> was present. We used gener<strong>al</strong>ized flash suppression<br />
(GFS) 16 , where a s<strong>al</strong>ient targ<strong>et</strong> disappears on the abrupt ons<strong>et</strong> of a<br />
surrounding field of dynamic dots, to reliably induce perceptu<strong>al</strong><br />
suppression (the stimulus sequence used in the present study is<br />
shown in Fig. 1a). Previous work in monkeys 13 and humans 16<br />
demonstrated that such a stimulus reliably leads to <strong>al</strong>l-or-none perceptu<strong>al</strong><br />
suppression in the absence of either loc<strong>al</strong> or interocular conflict. By<br />
adjusting stimulus param<strong>et</strong>ers, such as the density of the dots, the<br />
minimum distance b<strong>et</strong>ween the dots and the targ<strong>et</strong>, and the ocular<br />
configuration, we were able to affect the probability of the <strong>al</strong>l-or-none<br />
targ<strong>et</strong> disappearance (see M<strong>et</strong>hods). Suppression in the GFS procedure<br />
is related to that in motion-induced blindness 17 , but is controlled using<br />
a tempor<strong>al</strong> sequence resembling binocular riv<strong>al</strong>ry flash suppression 18 .<br />
As with convention<strong>al</strong> binocular riv<strong>al</strong>ry, GFS suppression is known to<br />
diminish the visu<strong>al</strong> responses of extrastriate cortic<strong>al</strong> neurons, but has<br />
little effect on V1 firing rates 10,11,19,20 .<br />
We used two gener<strong>al</strong> approaches to induce perceptu<strong>al</strong> suppression.<br />
In the first, which we term perceptu<strong>al</strong> report testing, we adjusted the<br />
1 Unit on Cognitive Neurophysiology and Imaging, Laboratory of Neuropsychology, Nation<strong>al</strong> Institute of Ment<strong>al</strong> He<strong>al</strong>th and 2 Neurophysiology Imaging Facility, Nation<strong>al</strong><br />
Institute of Ment<strong>al</strong> He<strong>al</strong>th, Nation<strong>al</strong> Institute of Neurologic<strong>al</strong> Disorders and Stroke, Nation<strong>al</strong> Eye Institute, US Nation<strong>al</strong> Institutes of He<strong>al</strong>th, Department of He<strong>al</strong>th and Human<br />
Services, 49 Convent Dr., B2J-45, MSC 4400, B<strong>et</strong>hesda, Maryland 20892, USA. Correspondence should be addressed to A.M. (maiera@mail.nih.gov).<br />
Received 27 March; accepted 24 June; published online 24 August <strong>2008</strong>; doi:10.1038/nn.2173<br />
NATURE NEUROSCIENCE VOLUME 11 [ NUMBER 10 [ OCTOBER <strong>2008</strong> 1193
ARTICLES<br />
© <strong>2008</strong> Nature Publishing Group http://www.nature.com/natureneuroscience<br />
Figure 1 Gener<strong>al</strong>ized flash suppression protocol for the block design<br />
experiment. (a) Stimulus conditions. The param<strong>et</strong>ers of the s<strong>al</strong>ient targ<strong>et</strong> and<br />
the random dot surround were adjusted to create five different conditions,<br />
with individu<strong>al</strong> tri<strong>al</strong>s lasting 6 s (1-min blocks consisted of up to nine such<br />
tri<strong>al</strong>s). In the gener<strong>al</strong>ized flash suppression (INV) condition, the appearance<br />
of surrounding dots to both eyes consistently induced the monocular targ<strong>et</strong> to<br />
disappear (the time period during which the targ<strong>et</strong> stimulus disappears is<br />
indicated with a thick orange line). In the physic<strong>al</strong> remov<strong>al</strong> (OFF) condition,<br />
the targ<strong>et</strong> was physic<strong>al</strong>ly extinguished on appearance of the dots, mimicking<br />
perceptu<strong>al</strong> suppression. In the tempor<strong>al</strong> revers<strong>al</strong> (VIS TR )andbinocular(VIS)<br />
conditions, the stimuli were adjusted by reversing the order of the targ<strong>et</strong> (red<br />
disk) and surround (moving random dots) or by presenting the targ<strong>et</strong> to both<br />
eyes, respectively, to ensure that the targ<strong>et</strong> did not disappear. Fin<strong>al</strong>ly, in the<br />
fixation (FIX) condition (not depicted), the screen remained blank as the<br />
monkey fixated a sm<strong>al</strong>l cross throughout the tri<strong>al</strong>. (T on ¼ targ<strong>et</strong> on, T off ¼<br />
targ<strong>et</strong> off, S on ¼ surround on, S off ¼ surround off). (b) The two modes of<br />
block design used for the fMRI experiments. In the sequenti<strong>al</strong> block design,<br />
the five stimulus conditions <strong>al</strong>ternated in a fixed tempor<strong>al</strong> order, keeping the<br />
number of stimulus conditions per run constant. In the randomized block<br />
design, each condition was presented in pseudorandomized order, each<br />
preceded by a blank screen fixation condition. (c) Psychophysic<strong>al</strong> responses during the different conditions. The probabilities of perceptu<strong>al</strong> suppression that<br />
are shown were based on ten psychophysic<strong>al</strong> test sessions (five from each anim<strong>al</strong>) and are plotted as the mean and s.e.m. over these sessions.<br />
stimulus param<strong>et</strong>ers at the beginning of each session according to<br />
the monkeys’ psychophysic<strong>al</strong> report such that the probability of<br />
disappearance for each tri<strong>al</strong> presentation was roughly 0.5. This m<strong>et</strong>hod,<br />
which was applied in a previous study 13 , entails the sorting of neur<strong>al</strong><br />
responses by the monkey’s report on a tri<strong>al</strong>-by-tri<strong>al</strong> basis. The second<br />
approach, which <strong>al</strong>lowed direct comparison of fMRI and electrophysiologic<strong>al</strong><br />
responses, was termed block design testing (Fig. 1b). In block<br />
design testing, which was used for the majority of the study, the<br />
visibility of the targ<strong>et</strong> was controlled over extended periods (blocks)<br />
by biasing the physic<strong>al</strong> stimulus param<strong>et</strong>ers (see M<strong>et</strong>hods).<br />
To isolate sign<strong>al</strong> changes related to perceptu<strong>al</strong> suppression, we<br />
compared responses during conditions in which the targ<strong>et</strong> was rendered<br />
either visible (VIS) or invisible (INV). Because of the existing<br />
discrepancy in the literature, we were particularly interested in wh<strong>et</strong>her<br />
activity during suppression (INV) would f<strong>al</strong>l to the level of a control<br />
condition in which the stimulus condition was turned off when<br />
the surrounding dots appeared (OFF). This control condition is<br />
perceptu<strong>al</strong>ly indistinguishable from suppression<br />
16 . For both fMRI and electrophysiologic<strong>al</strong><br />
testing, brain activation was measured<br />
a<br />
relative to a stimulus-free fixation condition<br />
(FIX). Note that the monkeys were not<br />
required to confirm the disappearance during<br />
the block design testing (maintaining accurate<br />
Figure 2 Modulation of BOLD responses during<br />
perceptu<strong>al</strong> suppression in two monkeys.<br />
(a) Single-session examples of targ<strong>et</strong>-specific<br />
activation on axi<strong>al</strong> slices (anterior is up, posterior<br />
is down) are shown. Colors represent the<br />
thresholded t score map corresponding to the<br />
statistic<strong>al</strong> comparison b<strong>et</strong>ween four rep<strong>et</strong>itions of<br />
30-s targ<strong>et</strong> presentation and four interleaved 30-s<br />
blocks of a blank screen (see M<strong>et</strong>hods for the<br />
param<strong>et</strong>ers used for the anatomic<strong>al</strong> and<br />
function<strong>al</strong> magn<strong>et</strong>ic resonance scans). (b) Mean<br />
BOLD responses over <strong>al</strong>l sessions for both<br />
monkeys. Only voxels in V1 showing significant<br />
decreases in activity during the OFF period were<br />
included (see M<strong>et</strong>hods for d<strong>et</strong>ails). Mean ± s.e.m.<br />
over 8 and 16 sessions for Monkey CB35 and<br />
98X009, respectively.<br />
a<br />
Block design tri<strong>al</strong> types<br />
Targ<strong>et</strong> percept suppressed<br />
Suppression period<br />
INV + + +<br />
perceptu<strong>al</strong> report for truly ambiguous stimuli requires a large proportion<br />
of interspersed catch tri<strong>al</strong>s). Non<strong>et</strong>heless, the effectiveness of the<br />
biased stimulus configurations was ev<strong>al</strong>uated repeatedly in perceptu<strong>al</strong><br />
report testing. The behavior<strong>al</strong> results in the two anim<strong>al</strong>s verify that the<br />
manipulations of stimulus visibility were highly effective (see Fig. 1c)<br />
and matched the expectations of observed psychophysic<strong>al</strong> results in a<br />
different group of monkeys 13 .<br />
In the block design, stimuli were grouped into 30- or 60-s epochs of<br />
repeated 6-s tri<strong>al</strong>s, during which the monkey was required to fixate a<br />
sm<strong>al</strong>l cross. Blocks of the different conditions (INV, VIS, OFF, <strong>et</strong>c.)<br />
were presented either sequenti<strong>al</strong>ly or in randomly interleaved order<br />
(Fig. 1b), with a tot<strong>al</strong> of four blocks of each type per scanning session.<br />
After successfully compl<strong>et</strong>ed tri<strong>al</strong>s, the anim<strong>al</strong> received a drop of apple<br />
juice and a short break (0.8–1.0s) in which it was free to briefly move its<br />
eyes about. Two anim<strong>al</strong>s participated in a tot<strong>al</strong> of 29 fMRI sessions and<br />
41 electrophysiology sessions, which were conducted over the same<br />
time period, but on different days.<br />
b<br />
FIX<br />
VIS TR<br />
VIS OFF<br />
Targ<strong>et</strong> Surround F F F F F<br />
Randomized block mode<br />
Targ<strong>et</strong> physic<strong>al</strong>ly removed<br />
30 s<br />
OFF + + +<br />
Percentage of tri<strong>al</strong>s reported visible<br />
c<br />
0 20 40 60 80 100<br />
Targ<strong>et</strong> continuously visible<br />
VIS + B + B<br />
+<br />
VIS TR + + +<br />
T on S on T off S off<br />
1.5 s 2.0 s 1.5 s<br />
0.0 2.0 4.0 6.0<br />
Time (s)<br />
t score<br />
t score<br />
6.2<br />
0.0<br />
7.3<br />
0.0<br />
b<br />
Percent change<br />
Percent change<br />
3<br />
2<br />
1<br />
0<br />
2<br />
1<br />
0<br />
FIX<br />
VIS<br />
F<br />
VIS TR<br />
OFF<br />
INV<br />
60 s<br />
INV<br />
F<br />
Sequenti<strong>al</strong> block mode<br />
Monkey CB35 (<strong>al</strong>l sessions)<br />
VIS TR<br />
VIS<br />
OFF<br />
n = 10<br />
sessions<br />
0 100 200 300<br />
FIX<br />
Monkey 98X009 (<strong>al</strong>l sessions)<br />
VIS TR<br />
VIS<br />
OFF<br />
INV<br />
INV<br />
0 100 200 300<br />
Seconds<br />
(n = 8 sessions)<br />
(n = 16 sessions)<br />
1194 VOLUME 11 [ NUMBER 10 [ OCTOBER <strong>2008</strong> NATURE NEUROSCIENCE
ARTICLES<br />
© <strong>2008</strong> Nature Publishing Group http://www.nature.com/natureneuroscience<br />
Figure 3 Divergence of V1 single-unit activity<br />
and fMRI BOLD response during perceptu<strong>al</strong><br />
suppression. (a) Single session examples of V1<br />
BOLD responses and single neuron firing rates (in<br />
impulses per s) inside and outside of the targ<strong>et</strong><br />
representation during the fMRI block design<br />
experiment. The colored region on the dors<strong>al</strong> view<br />
of one hemisphere (anterior is up and medi<strong>al</strong> is<br />
right) corresponds to the region of V1 that was<br />
activated by the targ<strong>et</strong> stimulus (data shown as<br />
t scores for a representative loc<strong>al</strong>izer experiment;<br />
M<strong>et</strong>hods and Supplementary Fig. 1). In each of<br />
the panels, activity levels for the five different<br />
stimulus conditions are shown in the sequenti<strong>al</strong><br />
block procedure (mean of four rep<strong>et</strong>itions). Each<br />
trace represents the continuous activity level<br />
throughout 5 min of <strong>al</strong>ternating 60-s stimulation<br />
blocks consisting of up to nine individu<strong>al</strong> tri<strong>al</strong>s<br />
(vertic<strong>al</strong> lines indicate the beginning and end of<br />
each stimulus block). Note that the BOLD and<br />
spiking activity drops in the OFF condition when<br />
the targ<strong>et</strong> is physic<strong>al</strong>ly removed inside, but not<br />
outside, the targ<strong>et</strong> representation. The spiking<br />
and fMRI sign<strong>al</strong>s are in close correspondence,<br />
except for the GFS (INV) condition inside the<br />
targ<strong>et</strong> region. During this period, the BOLD sign<strong>al</strong><br />
showed perceptu<strong>al</strong> modulation, whereas the<br />
spiking activity reflected the unchanged physic<strong>al</strong><br />
FIX VIS TR VIS OFF INV<br />
stimulation. Data from monkey CB35. Each plot is mean ± s.e.m. from four cycles of testing in one session. (b) Population average across both monkeys and<br />
<strong>al</strong>l experiments. Left, mean BOLD response for <strong>al</strong>l 24 scan sessions with time collapsed from the beginning to end of each 60-s block condition. Each bar<br />
represents the activation level in the region of interest as a function of condition. Note the drop in BOLD during the INV condition. Right, mean firing rate of <strong>al</strong>l<br />
172 recorded targ<strong>et</strong>-selective neurons, expressed as percent change to baseline activity (as assessed during the FIX condition). The VIS TR and VIS conditions<br />
resulted in statistic<strong>al</strong>ly indistinguishable firing rates from the INV condition (multiple t tests, error bars represent s.e.m. b<strong>et</strong>ween imaging sessions (left) and<br />
neurons (right)).<br />
BOLD and spiking during perceptu<strong>al</strong> suppression<br />
We first loc<strong>al</strong>ized the r<strong>et</strong>inotopic region of V1 corresponding to<br />
the position of our recording chamber by function<strong>al</strong>ly mapping the<br />
BOLD response to solid red disks in different positions (see M<strong>et</strong>hods<br />
and Supplementary Fig. 1 online). After finding the correspondence to<br />
the recording sites, we adopted this stimulus as a targ<strong>et</strong> for experiment<strong>al</strong><br />
testing. Our experiments reve<strong>al</strong>ed that perceptu<strong>al</strong> suppression<br />
of the targ<strong>et</strong> (INV condition) strongly and consistently decreased<br />
BOLD responses compared with the continu<strong>al</strong>ly visible (VIS) condition.<br />
Population data from two monkeys reve<strong>al</strong>ed that activity in the<br />
targ<strong>et</strong> responsive cortex dropped substanti<strong>al</strong>ly during blocks of the<br />
invisible tri<strong>al</strong>s, compared with blocks of visible tri<strong>al</strong>s, where the targ<strong>et</strong><br />
was continu<strong>al</strong>ly perceived, even though the targ<strong>et</strong> was physic<strong>al</strong>ly<br />
present in both cases (Fig. 2). Activity during the invisible tri<strong>al</strong>s was<br />
closest to the OFF control condition, where the targ<strong>et</strong> was physic<strong>al</strong>ly<br />
removed from the screen.<br />
The block design made it necessary to implement two distinctly<br />
different visible control conditions. Visibility was attained in one<br />
condition by binocular presentation of the targ<strong>et</strong> (VIS), and in the<br />
other by reversing the tempor<strong>al</strong> order of the sequence (VIS TR ). The<br />
binocular presentation of the targ<strong>et</strong> in the VIS condition explains the<br />
slightly higher response than the one observed in the monocular VIS TR<br />
condition, consistent with previous work on binocular integration 21 .<br />
Non<strong>et</strong>heless, this difference is sm<strong>al</strong>l compared with the effects of<br />
perceptu<strong>al</strong> suppression, where the targ<strong>et</strong>-responsive region showed<br />
activity that more closely resembled the effects of physic<strong>al</strong>ly removing<br />
the stimulus. Note that in <strong>al</strong>l cases, the targ<strong>et</strong> and surround stimuli were<br />
on for the same period of time.<br />
Perceptu<strong>al</strong> suppression was consistently observed in single sessions<br />
and in single voxels, and it was present when the order of the stimulus<br />
a<br />
Spike rate (Imp s –1 )<br />
b<br />
200<br />
2.0<br />
1.0<br />
Spiking<br />
BOLD<br />
Outside targ<strong>et</strong> representation<br />
(example session)<br />
FIX VIS TR VIS OFF INV<br />
120<br />
140<br />
0.0<br />
n = 4<br />
0.0<br />
n = 4<br />
0 100 200 300<br />
12.8<br />
0 100 200 300<br />
Seconds<br />
0.0<br />
Seconds<br />
Percent BOLD sign<strong>al</strong><br />
change<br />
Inside targ<strong>et</strong> representation<br />
(example session)<br />
3<br />
2<br />
1<br />
0<br />
BOLD (percent change)<br />
BOLD inside targ<strong>et</strong> representation<br />
(population average)<br />
FIX VIS TR VIS OFF INV<br />
n = 24<br />
Percent spiking change<br />
t score<br />
100<br />
60<br />
20<br />
blocks was sequenti<strong>al</strong> or randomly interleaved (Supplementary Fig. 2<br />
online). These findings are consistent with a large number of human<br />
fMRI studies showing that BOLD sign<strong>al</strong>s in V1 are a good measure of<br />
perceptu<strong>al</strong> visibility 3–9 .<br />
We next compared BOLD and single unit modulation during<br />
peceptu<strong>al</strong> suppression (Fig. 3). We studied 172 well-isolated neurons<br />
whose responses were significantly modulated by the presentation of the<br />
targ<strong>et</strong> (t tests, P o 0.05, out of 318 tot<strong>al</strong> neurons sampled, see M<strong>et</strong>hods).<br />
The monkey subjects, the stimulus and the block-design protocol were<br />
identic<strong>al</strong> to the fMRI testing. In sharp contrast to the modulation of the<br />
BOLD sign<strong>al</strong>, neurons in the targ<strong>et</strong>-responsive portion of cortex showed<br />
no significant change in their mean firing during perceptu<strong>al</strong> suppression<br />
(P ¼ 0.98, t test; Fig. 3). Notably, the BOLD and spiking responses in V1,<br />
tested in the same patch of cortex in the same monkey subjects,<br />
specific<strong>al</strong>ly diverged during perceptu<strong>al</strong> suppression, with the BOLD<br />
sign<strong>al</strong>s, but not the spiking responses, following the percept. This result<br />
serves to reconcile previous single-unit studies in monkeys 10–13 with<br />
fMRI studies in humans 3–9 and demonstrates that neither the species<br />
nor the stimulation protocol formed the basis of the discrepancy, which<br />
instead arose from the nature of the measured sign<strong>al</strong>s themselves.<br />
LFP modulation, perceptu<strong>al</strong> suppression and the block design<br />
We next explored wh<strong>et</strong>her modulation of the LFP sign<strong>al</strong> might reflect<br />
the BOLD sign<strong>al</strong> more closely than the spiking and therein match the<br />
monkey’s perceptu<strong>al</strong> state 22 . Recent work using the perceptu<strong>al</strong> report<br />
procedure in GFS reve<strong>al</strong>ed that the power of lower-frequency LFP<br />
components (o30 Hz) substanti<strong>al</strong>ly decreased when the monkey<br />
reported the disappearance of an ambiguous stimulus 13 . We thus<br />
investigated wh<strong>et</strong>her LFP modulation was present in our data by first<br />
dividing the LFP into two frequency bands, low (5–30 Hz) and high<br />
Spike rate (Imp s –1 )<br />
180<br />
Spiking inside targ<strong>et</strong> representation<br />
(population average)<br />
FIX VIS TR VIS OFF INV<br />
n = 172<br />
1.0<br />
BOLD (percent change)<br />
NATURE NEUROSCIENCE VOLUME 11 [ NUMBER 10 [ OCTOBER <strong>2008</strong> 1195
ARTICLES<br />
© <strong>2008</strong> Nature Publishing Group http://www.nature.com/natureneuroscience<br />
Figure 4 Spectr<strong>al</strong> an<strong>al</strong>ysis of LFP sign<strong>al</strong>s<br />
obtained during suppression and control tri<strong>al</strong>s.<br />
(a) Time-frequency plots of the INV, VIS and OFF<br />
conditions, featuring activity changes in the<br />
suppression period (following surround ons<strong>et</strong>).<br />
Each panel depicts the average spectrogram for<br />
an entire tri<strong>al</strong> period, with magnitude changes<br />
relative to the 500-ms period preceding the<br />
surround ons<strong>et</strong>, in which the targ<strong>et</strong> <strong>al</strong>one was<br />
present in each condition. Population data are<br />
shown over <strong>al</strong>l channels and over <strong>al</strong>l recording<br />
sessions (successfully compl<strong>et</strong>ed tri<strong>al</strong>s only). All<br />
relevant stimulus events are marked with dashed<br />
lines (T ¼ targ<strong>et</strong> and S ¼ surround). Note that<br />
<strong>al</strong>though <strong>al</strong>l of the conditions showed a drop in<br />
low-frequency power following the surround ons<strong>et</strong>,<br />
the drop for the INV condition during the<br />
suppression period was larger than the<br />
corresponding drop for the VIS condition and<br />
closely resembled physic<strong>al</strong> remov<strong>al</strong> (OFF).<br />
(b) Statistic<strong>al</strong> time-frequency an<strong>al</strong>ysis of<br />
perceptu<strong>al</strong> suppression versus physic<strong>al</strong> remov<strong>al</strong><br />
(for the time period indicated by a dashed square<br />
in a). The upper plot (comparing the INV and VIS<br />
conditions) shows a decrease during perceptu<strong>al</strong><br />
suppression that was limited to the low frequencies, whereas the lower plot (comparing the OFF and VIS conditions) shows a large, broadband decrease when<br />
the targ<strong>et</strong> was physic<strong>al</strong>ly removed. Note that these two conditions are nearly identic<strong>al</strong> perceptu<strong>al</strong>ly. t v<strong>al</strong>ues are indicated by gray sc<strong>al</strong>e v<strong>al</strong>ues shown in ins<strong>et</strong>.<br />
(c) Average t score as a function of frequency for the entire period of perceptu<strong>al</strong> suppression (and physic<strong>al</strong> remov<strong>al</strong>). The threshold for statistic<strong>al</strong> significance<br />
(P o 0.001) is indicated by a dashed line.<br />
(30–90 Hz), and then computing power changes in the different bands<br />
over blocks (Supplementary Fig. 3 online). We reasoned that, given the<br />
robust BOLD changes, there might be low-frequency modulation<br />
during blocks in which the targ<strong>et</strong> was suppressed compared with<br />
those in which it was continuously visible. In contrast to our expectations,<br />
we found no significant decrease in the mean power for either the<br />
low- or high-frequency bands during blocks of perceptu<strong>al</strong> suppression<br />
(P ¼ 0.69 and P ¼ 0.68, respectively, t test,95channels).Infact,wewere<br />
unable to find any electrophysiologic<strong>al</strong> sign<strong>al</strong> that, over the course of an<br />
entire block, correlated with perceptu<strong>al</strong> suppression.<br />
To explore the basis of this negative finding, we next sought to<br />
reproduce findings from our previous study, in which the LFP had<br />
reflected stimulus visibility in V1. That study used the perceptu<strong>al</strong> report<br />
procedure (in different anim<strong>al</strong>s) and found that purely perceptu<strong>al</strong><br />
sign<strong>al</strong>s were reflected in the modulation of the low-frequency LFP 13 .<br />
We trained both monkeys to report the visibility<br />
of targ<strong>et</strong> stimuli on tri<strong>al</strong>s that were <strong>al</strong>l<br />
identic<strong>al</strong>, but in which the targ<strong>et</strong> had a 0.5<br />
probability of being suppressed (see M<strong>et</strong>hods).<br />
Figure 5 Population average of band-limited<br />
power (BLP) and spiking time courses for<br />
different experiment<strong>al</strong> conditions. (a) Grand<br />
average of low-frequency (5–30 Hz) BLP over<br />
time as a function of experiment<strong>al</strong> condition (<strong>al</strong>l<br />
channels, <strong>al</strong>l sessions, both monkeys). All relevant<br />
events are indicated with dashed lines (T ¼ targ<strong>et</strong><br />
and S ¼ surround). The an<strong>al</strong>ysis time window<br />
(during which targ<strong>et</strong> was perceptu<strong>al</strong>ly suppressed<br />
during the INV condition) is indicated by the<br />
orange bar. (b) Grand average of high-frequency<br />
(30–80 Hz) BLP, same conventions as in a.<br />
(c) Spiking density function of <strong>al</strong>l units recorded<br />
during the neurophysiologic<strong>al</strong> experiments. In <strong>al</strong>l<br />
cases, data are convolved with a 50-ms s.d.<br />
Gaussian kernel. Error bars are s.e.m.<br />
a Population spectrograms b Difference spectrograms c<br />
INV<br />
tri<strong>al</strong>s<br />
VIS<br />
tri<strong>al</strong>s<br />
OFF<br />
tri<strong>al</strong>s<br />
a<br />
√Power (µV)<br />
Frequency (Hz)<br />
Frequency (Hz)<br />
Frequency (Hz)<br />
32<br />
28<br />
24<br />
T on S on T off S off<br />
Suppression<br />
80<br />
period<br />
60<br />
40<br />
20<br />
0<br />
0 1 2 3 4 5 6<br />
T on S on T off S off<br />
80<br />
60<br />
40<br />
20<br />
0<br />
0 1 2 3 4<br />
T on S on & T off<br />
5<br />
S off<br />
n = 1,594<br />
n = 1,594<br />
6<br />
Power (a.u.)<br />
Frequency (Hz)<br />
t score<br />
80<br />
60<br />
40<br />
15<br />
Perceptu<strong>al</strong> suppression<br />
0<br />
–15<br />
INV-VIS<br />
20<br />
60<br />
40 0<br />
20 30 Physic<strong>al</strong> remov<strong>al</strong><br />
0<br />
0<br />
–30<br />
OFF-VIS<br />
80<br />
Frequency (Hz)<br />
t score<br />
Power decreases<br />
(P < 0.001)<br />
80<br />
60<br />
60<br />
60<br />
40<br />
40<br />
40<br />
20<br />
0<br />
20<br />
20<br />
0 1 2 3 4 5 6<br />
0<br />
0<br />
Time (s) 1 2 3 4 0 –10 –20 –30<br />
Time (s)<br />
Average t score<br />
Low LFP (5–30 Hz)<br />
(<strong>al</strong>l sessions)<br />
T on S on T off S off<br />
(Suppression<br />
period)<br />
n = 1,594<br />
Significance<br />
0 –5<br />
(P < 0.001)<br />
In agreement with the previous results, we found clear and consistent<br />
power decreases in the low-frequency LFP during suppressed tri<strong>al</strong>s<br />
(Supplementary Fig. 4 online). We then asked wh<strong>et</strong>her perceptu<strong>al</strong><br />
modulation had, in fact, been present in the block design tri<strong>al</strong>s, but had<br />
been diluted because of the relatively sm<strong>al</strong>l proportion of time in the<br />
block in which the targ<strong>et</strong> was suppressed. To examine this possibility, we<br />
conducted a tri<strong>al</strong>-by-tri<strong>al</strong> an<strong>al</strong>ysis of the block design data, beginning<br />
with a time-frequency an<strong>al</strong>ysis.<br />
We created spectrograms of the time course of power changes in<br />
different frequency bands within tri<strong>al</strong>s of different block types (Fig. 4a).<br />
We focused on the 2-s period following surround ons<strong>et</strong> corresponding<br />
to the period of perceptu<strong>al</strong> suppression in the INV tri<strong>al</strong>s, or lack thereof<br />
in the VIS tri<strong>al</strong>s. We ev<strong>al</strong>uated which frequency components were<br />
affected by suppression (INV-VIS) and compared the effects of suppression<br />
to those of physic<strong>al</strong> remov<strong>al</strong> (OFF-VIS), plotting the t score of the<br />
b<br />
√Power (µV)<br />
12<br />
10<br />
20 8<br />
Time (s)<br />
High LFP (30–90 Hz)<br />
(<strong>al</strong>l sessions)<br />
n = 1,594 n = 1,594 n = 172<br />
Time (s)<br />
VIS<br />
OFF<br />
INV<br />
VIS TR<br />
0 1 2 3 4 5 6 0 1 2 3 4 5 6 0 1 2 3 4 5 6<br />
c<br />
Spike rate (imp s –1 )<br />
18<br />
16<br />
14<br />
12<br />
10<br />
Time (s)<br />
–10<br />
Spiking<br />
(<strong>al</strong>l sessions)<br />
80<br />
60<br />
40<br />
20<br />
0<br />
80<br />
Frequency (Hz)<br />
Frequency (Hz)<br />
1196 VOLUME 11 [ NUMBER 10 [ OCTOBER <strong>2008</strong> NATURE NEUROSCIENCE
ARTICLES<br />
© <strong>2008</strong> Nature Publishing Group http://www.nature.com/natureneuroscience<br />
Suppression index (%)<br />
100<br />
80<br />
60<br />
40<br />
20<br />
0<br />
71.6% 35.9% 4.2% 7.4%<br />
(n = 24<br />
sessions)<br />
BOLD<br />
(n = 1,594<br />
samples)<br />
LFP<br />
5–30 Hz<br />
(n = 1,594<br />
samples)<br />
LFP<br />
30–90 Hz<br />
(n = 172<br />
neurons)<br />
Spikes<br />
Figure 6 Summary of perceptu<strong>al</strong> modulation in the BOLD response and in<br />
each of the electrophysiologic<strong>al</strong> sign<strong>al</strong>s (as computed from the raw data of<br />
both monkeys shown in Figs. 3b and 5). The Suppression index corresponds<br />
to the percent of sign<strong>al</strong> drop during the INV condition compared with the OFF<br />
condition, both relative to the VIS condition.<br />
activity changes under the two conditions (Fig. 4b,c). Note that the<br />
physic<strong>al</strong> remov<strong>al</strong> of the visu<strong>al</strong> targ<strong>et</strong> produced a large-amplitude<br />
broadband decrease in power, but that perceptu<strong>al</strong> suppression did not<br />
(Supplementary Fig. 5 online). Consistent with the perceptu<strong>al</strong> report<br />
procedure, the strongest effect of suppression was a significant decline in<br />
the power of low frequencies (P o 0.001; Fig. 4c), matching the results<br />
obtained from the reporting monkey described above.<br />
We examined the high (30–90 Hz) and low (5–30 Hz) frequency<br />
ranges, as well as spike rates, for each testing condition (the magnitude<br />
of low-frequency power modulation can be seen more clearly in Fig. 5).<br />
This an<strong>al</strong>ysis reve<strong>al</strong>ed that the perceptu<strong>al</strong> suppression condition<br />
(orange) deviated significantly from (P o 0.001) the visible condition<br />
(black) in the low-frequency LFP (black arrow), but not in highfrequency<br />
LFP or in spiking (P ¼ 0.99 and P ¼ 0.90, respectively). In<br />
fact, the only d<strong>et</strong>ectable electrophysiologic<strong>al</strong> difference b<strong>et</strong>ween the<br />
visible and invisible tri<strong>al</strong>s was this change in low-frequency LFP power.<br />
These data are summarized in Figure 6, which shows the suppression<br />
index, comparing the activity change during perceptu<strong>al</strong> suppression to<br />
that measured during the physic<strong>al</strong> remov<strong>al</strong> of the targ<strong>et</strong>. Of these<br />
sign<strong>al</strong>s, it was the BOLD and low-frequency LFP that showed substanti<strong>al</strong><br />
declines relative to the control conditions, therein reflecting the<br />
state of perceptu<strong>al</strong> suppression.<br />
DISCUSSION<br />
These findings help to resolve a long-standing discrepancy b<strong>et</strong>ween<br />
human fMRI and monkey neurophysiology regarding the role of V1<br />
in d<strong>et</strong>ermining wh<strong>et</strong>her a stimulus is visible. The outcome of the<br />
combined fMRI/electrophysiologic<strong>al</strong> approach demonstrates that<br />
the different conclusions reached by human fMRI and monkey<br />
electrophysiology were not the results of either species or procedur<strong>al</strong><br />
differences, but can instead be attributed to the nature of the sign<strong>al</strong>s<br />
that were measured. Although consistent during convention<strong>al</strong> stimulation,<br />
the BOLD and electrophysiologic<strong>al</strong> responses diverged markedly<br />
during perceptu<strong>al</strong> suppression.<br />
It is interesting to consider that the BOLD fMRI sign<strong>al</strong>, arguably the<br />
furthest removed from neur<strong>al</strong> processing, provided the most reliable<br />
measure of the perceptu<strong>al</strong> state, whereas the action potenti<strong>al</strong> firing rate<br />
provided the least. Why might this be the case There are sever<strong>al</strong> possible<br />
explanations. First, one cannot entirely rule out an electrophysiologic<strong>al</strong><br />
sampling bias that consistently missed a subpopulation of neurons,<br />
perhaps because of their size, that carries the perceptu<strong>al</strong> sign<strong>al</strong> in V1 (see<br />
ref. 23 for neuron-type specific modulation effects). Perceptu<strong>al</strong> modulation<br />
in sm<strong>al</strong>l, infrequently sampled neurons, such as interneurons<br />
bearing a close relationship to vascular control 24 , might elicit a prominent<br />
BOLD response. Another possibility is that perceptu<strong>al</strong> suppression<br />
results in a temporary and spati<strong>al</strong>ly loc<strong>al</strong>ized mode of cortic<strong>al</strong> processing<br />
in which both inhibition and excitation are decreased, but remain in the<br />
same b<strong>al</strong>ance. This scenario could produce a minim<strong>al</strong> or no change in<br />
the spiking of neurons, but would provide a temporary relief of the<br />
m<strong>et</strong>abolic and vascular demands, leading to a decreased hemodynamic<br />
response. Fin<strong>al</strong>ly, it is <strong>al</strong>so possible that seemingly unimportant modulatory<br />
sign<strong>al</strong>s distributed over a large population of neurons would<br />
escape the notice of electrophysiologic<strong>al</strong> an<strong>al</strong>ysis, but would be effectively<br />
registered in the BOLD response. Further experiments are<br />
required to address these and other possibilities.<br />
A potenti<strong>al</strong>ly attractive explanation of our findings might be that<br />
input to V1 from structures other than the LGN is disrupted during<br />
perceptu<strong>al</strong> suppression and that such disruption is b<strong>et</strong>ter reflected in the<br />
BOLD changes than in neur<strong>al</strong> firing. Considerable evidence suggests<br />
that synaptic activity (stemming from afferent input and loc<strong>al</strong> intracortic<strong>al</strong><br />
processing) might lead to BOLD responses, even in the absence<br />
of firing rate changes 25–27 . It has long been hypothesized that recurrent<br />
input from extrastriate cortic<strong>al</strong> areas into V1 accompanies selective<br />
attention and stimulus awareness 28,29 . In this context, is <strong>al</strong>so noteworthy<br />
that a similar mismatch b<strong>et</strong>ween fMRI and single-unit physiology has<br />
been previously identified regarding the modulation of V1 by visu<strong>al</strong><br />
attention 30 , suggesting that the dissociation observed here may arise in<br />
conditions other than perceptu<strong>al</strong> suppression. Recent work demonstrating<br />
laminar differences in the suppressive modulation of synaptic<br />
currents in V1 (ref. 31) shows promise for providing a deeper understanding<br />
of both the neur<strong>al</strong> mechanisms of perceptu<strong>al</strong> suppression and<br />
the enigmatic relationship b<strong>et</strong>ween the fMRI sign<strong>al</strong> and neur<strong>al</strong> activity.<br />
The lack of LFP power modulation over blocks of perceptu<strong>al</strong><br />
suppression was unexpected, given that a clear LFP power modulation<br />
was seen in the tri<strong>al</strong>-based an<strong>al</strong>ysis of the same data, <strong>al</strong>ong with the clear<br />
BOLD modulation in the block-based an<strong>al</strong>ysis. This result appears to<br />
indicate that the BOLD response is not a simple reflection of integrated<br />
neur<strong>al</strong> activity over time. This negative finding may owe, in part, to a<br />
low sign<strong>al</strong>-to-noise ratio resulting from a dilution over large time<br />
windows. However, it is interesting to consider that the robust suppression<br />
that we observed in the BOLD response might be shaped by only a<br />
subs<strong>et</strong> of neur<strong>al</strong> events, which are punctuated and context specific. That<br />
would have profound implications, as there could be no unique<br />
hemodynamic transfer function to serve as a time-invariant convolution<br />
filter to translate neur<strong>al</strong> and BOLD sign<strong>al</strong>s, as is commonly assumed.<br />
For example, neur<strong>al</strong> modulation associated with the stimulus-driven<br />
events may have a proportion<strong>al</strong>ly stronger contribution to the hemodynamic<br />
response than do neur<strong>al</strong> fluctuations occurring b<strong>et</strong>ween tri<strong>al</strong>s.<br />
At the same time, recent work relating spontaneous neur<strong>al</strong> activity in V1<br />
to BOLD fluctuations suggests that endogenous activity can <strong>al</strong>so have a<br />
strong effect on the fMRI response 32 .<br />
Our results demonstrate that the very same sign<strong>al</strong>s that correlate<br />
strongly with the BOLD sign<strong>al</strong> in one context (physic<strong>al</strong> stimulus<br />
remov<strong>al</strong>) fail to do so in another (perceptu<strong>al</strong> suppression). The absence<br />
of a fixed relationship b<strong>et</strong>ween the different neur<strong>al</strong> sign<strong>al</strong>s is illustrated<br />
conceptu<strong>al</strong>ly in Figure 7. When a targ<strong>et</strong> stimulus eliciting a tonic neur<strong>al</strong><br />
response is physic<strong>al</strong>ly removed, <strong>al</strong>l measured sign<strong>al</strong>s are consistent,<br />
showing corresponding decreases in amplitude. On the other hand,<br />
NATURE NEUROSCIENCE VOLUME 11 [ NUMBER 10 [ OCTOBER <strong>2008</strong> 1197
ARTICLES<br />
© <strong>2008</strong> Nature Publishing Group http://www.nature.com/natureneuroscience<br />
On<br />
Stimulus<br />
Off<br />
Percept<br />
BOLD<br />
Spiking<br />
LFP low<br />
LFP high<br />
Vis<br />
Inv<br />
+<br />
–<br />
+<br />
–<br />
+<br />
–<br />
+<br />
–<br />
Physic<strong>al</strong> remov<strong>al</strong> (OFF)<br />
Perceptu<strong>al</strong> suppression (INV)<br />
during perceptu<strong>al</strong> suppression, the various responses become dissociated<br />
and the BOLD sign<strong>al</strong> no longer matches the neurophysiologic<strong>al</strong><br />
sign<strong>al</strong>s. Such context dependency might serve to explain discrepancies<br />
among previous studies investigating the neur<strong>al</strong> basis of the BOLD<br />
sign<strong>al</strong> 25–27,33,34 . Gaining a deeper understanding of the neur<strong>al</strong> d<strong>et</strong>erminants<br />
of the BOLD fMRI sign<strong>al</strong> remains an important ch<strong>al</strong>lenge for<br />
systems neuroscience. The par<strong>al</strong>lax provided by neur<strong>al</strong> and hemodynamic<br />
sign<strong>al</strong>s, each providing a window onto different brain function,<br />
may eventu<strong>al</strong>ly give mechanistic insights that neither technique could<br />
provide <strong>al</strong>one.<br />
METHODS<br />
Subjects and testing. Two he<strong>al</strong>thy adult m<strong>al</strong>e monkeys (Macaca mulatta) were<br />
used in this study. All procedures followed US Nation<strong>al</strong> Institutes of He<strong>al</strong>th<br />
guidelines, were approved by the Anim<strong>al</strong> Care and Use Committee of the US<br />
Nation<strong>al</strong> Institutes of He<strong>al</strong>th (Nation<strong>al</strong> Institute of Ment<strong>al</strong> He<strong>al</strong>th) and were<br />
conducted with great care for the comfort and well being of the anim<strong>al</strong>s. Each<br />
monkey had an magn<strong>et</strong>ic resonance–compatible recording well implanted over<br />
V1, which <strong>al</strong>lowed for fMRI and neurophysiologic<strong>al</strong> testing on subsequent days.<br />
A tot<strong>al</strong> of 41 multi-electrode recording sessions (27 and 14 sessions in Monkeys<br />
CB35 and 98X009, respectively) and 29 fMRI sessions (8 and 16 sessions,<br />
respectively, as well as 5 addition<strong>al</strong> sessions with randomly ordered blocks)<br />
were collected.<br />
Stimulus and task design. All sessions were carried out while the anim<strong>al</strong>s were<br />
awake and performing a task, either fixation only or reporting targ<strong>et</strong> visibility.<br />
In the block design task, visu<strong>al</strong> stimuli were presented in 30- or 60-s epochs of<br />
repeated 6-s tri<strong>al</strong>s of a given type. Anim<strong>al</strong>s were required to fixate a sm<strong>al</strong>l spot<br />
until the compl<strong>et</strong>ion of each tri<strong>al</strong> to obtain an apple juice reward. Each stimulus<br />
type consisted of a targ<strong>et</strong> pattern (a bright red disk, with a diam<strong>et</strong>er of 41 of<br />
visu<strong>al</strong> angle (dva) for the majority of the experiments, was presented to the<br />
parafovea in one quadrant), and a surrounding field of randomly moving dots<br />
(200–500 tot<strong>al</strong> dots of 0.51 diam<strong>et</strong>er, covering an area of 401 301). The<br />
random dots never approached within h<strong>al</strong>f a degree of the targ<strong>et</strong> stimulus. In<br />
the suppression condition (INV), the stimulus param<strong>et</strong>ers were adjusted such<br />
that the presentation of the surround pattern resulted in perceptu<strong>al</strong> suppression<br />
of the targ<strong>et</strong>. In two ‘visible’ control conditions (VIS and VIS TR ), the<br />
param<strong>et</strong>ers were adjusted such that the targ<strong>et</strong> <strong>al</strong>most never disappeared. In<br />
the ‘invisible’ control condition (OFF), the targ<strong>et</strong> was physic<strong>al</strong>ly removed from<br />
the screen on appearance of the dots. Blocks were either presented in a repeated<br />
tempor<strong>al</strong> sequence or randomly interleaved. In other testing, anim<strong>al</strong>s<br />
responded according to the visibility of the targ<strong>et</strong> by pulling a lever.<br />
In most sessions, anim<strong>al</strong>s were tested in a block protocol consisting of 60-s<br />
blocks of repeated presentations of the five different stimulus types (FIX, VIS TR ,<br />
Figure 7 Schematic illustration of main results. From top to bottom,<br />
each line represents the state of presentation (stimulus either on or off), the<br />
reported percept of the subject (stimulus visible or invisible) and the various<br />
measures of neuron<strong>al</strong> activity in primary visu<strong>al</strong> cortex (high or low activity).<br />
The left column represents the OFF condition. As shown in Figures 2–5, <strong>al</strong>l<br />
measures of neuron<strong>al</strong> activity, including the fMRI BOLD response, showed<br />
a decline in sign<strong>al</strong> when the stimulus was both physic<strong>al</strong>ly removed and<br />
perceptu<strong>al</strong>ly disappeared. The right column represents our finding for the INV<br />
condition, where the percept was dissociated from the physic<strong>al</strong> stimulus in<br />
the form of perceptu<strong>al</strong> suppression. In that case, the spiking activity (and<br />
high frequency LFP) maintained its activity level, reflecting the continu<strong>al</strong>ly<br />
present stimulus, whereas the fMRI response and (to a lesser extent) the lowfrequency<br />
LFP reflected the perceptu<strong>al</strong> disappearance. Thus the relation<br />
b<strong>et</strong>ween the fMRI and neur<strong>al</strong> sign<strong>al</strong>s differs under the two conditions.<br />
VIS, OFF and INV). These blocks were presented either sequenti<strong>al</strong>ly or in<br />
pseudorandom order. In each block, the anim<strong>al</strong>s were required to fixate for the<br />
entire 6-s presentation of a particular stimulus condition, which was repeated<br />
until the end of the block. The qu<strong>al</strong>ity of fixation was continu<strong>al</strong>ly monitored.<br />
Eye movements exceeding 1–21 away from the fixation spot caused the tri<strong>al</strong> to<br />
abort. Note that because the monkeys had been trained to fixate within 0.81 of<br />
the fixation spot, they kept their eyes in that region for the large majority of the<br />
time (Supplementary Figs. 6–9 online). Following each successful tri<strong>al</strong>, the<br />
anim<strong>al</strong> received a juice reward, accompanied by a short break (0.8–1 s) in which<br />
the monkey was free to move its eyes about. There were typic<strong>al</strong>ly 6–8 compl<strong>et</strong>ed<br />
tri<strong>al</strong>s each minute, depending on how well the anim<strong>al</strong> acquired and maintained<br />
fixation (no significant performance differences were found b<strong>et</strong>ween the VIS,<br />
VIS TR , OFF and INV conditions in either anim<strong>al</strong>).<br />
Differenti<strong>al</strong> stimulation to the two eyes was achieved inside and outside the<br />
scanner by fixing anaglyph filters in front of the monkeys’ eyes and adjusting<br />
the stimulus color accordingly (see Supplementary M<strong>et</strong>hods online for<br />
addition<strong>al</strong> d<strong>et</strong>ails).<br />
Behavior<strong>al</strong> protocol. The experiments started after the monkeys were able to<br />
hold and maintain fixation on more than 95% of tri<strong>al</strong>s. Each session started<br />
with a brief c<strong>al</strong>ibration procedure, during which the monkeys were presented<br />
with a sm<strong>al</strong>l (0.1–0.25 dva) fixation spot at one of nine positions on the screen.<br />
After the monkeys acquired and kept fixation for 1–3 s, juice reward was<br />
delivered and a new tri<strong>al</strong> began. Following this procedure, we started the<br />
experiment<strong>al</strong> task, in which the monkeys had to fixate a centr<strong>al</strong> spot on the<br />
screen in a 1–4-dva window for up to 10 s to receive reward. If a monkey broke<br />
fixation, the tri<strong>al</strong> was aborted and re-initiated after a short delay of 100–800 ms.<br />
We carried out psychophysic<strong>al</strong> testing in sever<strong>al</strong> separate test sessions outside<br />
of the scanner. Stimulus disappearance was reported using custom-made levers<br />
mounted inside the primate chair. One monkey had previously been trained to<br />
report the physic<strong>al</strong> and subjective remov<strong>al</strong> of the targ<strong>et</strong> stimulus using a vari<strong>et</strong>y<br />
of catch tri<strong>al</strong>s to ensure truthful perceptu<strong>al</strong> report. The other monkey was<br />
trained to do so at the end of the experiment<strong>al</strong> sessions (for a more d<strong>et</strong>ailed<br />
description of the m<strong>et</strong>hods used for behavior<strong>al</strong> training and testing of GFS, see<br />
ref. 13). Stimulation param<strong>et</strong>ers in the physiology testing booths matched those<br />
used in the scanner.<br />
Surgery. Monkeys were implanted under isoflurane anesthesia (1.5–2%) with<br />
custom-designed and fabricated fiberglass headposts, which served to immobilize<br />
the head during testing. Each monkey received a scler<strong>al</strong> search coil,<br />
following a standard implantation procedure 35 . In a subsequent surgery, a<br />
recording chamber was implanted over V1 using frameless stereotaxy guided by<br />
high resolution anatomic<strong>al</strong> magn<strong>et</strong>ic resonance images (Brainsight, Rogue<br />
Research), and a craniotomy was performed 35 . Anim<strong>al</strong>s received antibiotics<br />
and an<strong>al</strong>gesics post-operation.<br />
fMRI scanning. Structur<strong>al</strong> and function<strong>al</strong> images were acquired in a 4.7-T,<br />
60-cm vertic<strong>al</strong> scanner (Bruker Biospec) equipped with a Siemens AC44<br />
gradient coil (40 mT m –1 , o200 ms). Magn<strong>et</strong>ic resonance–compatible primate<br />
chairs were constructed and machined using plastic materi<strong>al</strong>s and with a<br />
minimum of brass and <strong>al</strong>uminum parts. Monkeys were prevented from<br />
performing excessive jaw movements by a chin rest that was mounted to the<br />
top of the chair. Juice was delivered using an air-pressurized juicer device 36<br />
1198 VOLUME 11 [ NUMBER 10 [ OCTOBER <strong>2008</strong> NATURE NEUROSCIENCE
ARTICLES<br />
© <strong>2008</strong> Nature Publishing Group http://www.nature.com/natureneuroscience<br />
through custom-made brass mouth pieces. Exposure to scanner noise was<br />
reduced by means of custom-formed ear plugs.<br />
Monkeys were scanned over a period of 4 months (and two sessions of<br />
confirmatory r<strong>et</strong>esting 12 months later) using two custom-built surface coils<br />
situated over cortic<strong>al</strong> area V1. The anim<strong>al</strong>s had previously been acclimated to<br />
the scanner testing environment and worked continuously for up to 4 h.<br />
Electrophysiologic<strong>al</strong> testing was conducted during the same testing period on<br />
different days using the same anim<strong>al</strong>s, primate chairs, stimuli and behavior<strong>al</strong><br />
testing param<strong>et</strong>ers, in designated electrophysiology booths.<br />
Each session began with a loc<strong>al</strong>izer scan, in which the r<strong>et</strong>inotopic area<br />
corresponding to the s<strong>al</strong>ient targ<strong>et</strong> was identified. This loc<strong>al</strong>izer consisted of 60-s<br />
blocks of tri<strong>al</strong>s <strong>al</strong>ternating b<strong>et</strong>ween presentation of the targ<strong>et</strong>, the surrounding<br />
dots or a fixation cross presented <strong>al</strong>one. An<strong>al</strong>ysis of the main experiment was<br />
restricted to those voxels that showed significant decreases when the targ<strong>et</strong> was<br />
physic<strong>al</strong>ly removed in the context of the block design (in the OFF condition).<br />
Transmit-and-receive radio frequency coils had dimensions ranging from<br />
33 33 to 37 120 mm and were placed adjacent to the sc<strong>al</strong>p of the anim<strong>al</strong>s<br />
before they entered the magn<strong>et</strong> bore. The size and position of the coils were<br />
optimized to achieve maxim<strong>al</strong> sensitivity in the posterior portion of area V1 in<br />
the occipit<strong>al</strong> lobe. At the beginning of each session, active shimming was<br />
achieved either by manu<strong>al</strong> manipulation of the gain of the shim coils, by using<br />
the FASTMAP 37 procedure or by a combination of the two. To assess function<strong>al</strong><br />
cortic<strong>al</strong> activation, a single shot gradient echo-planar imaging 38 sequence was<br />
used with a rep<strong>et</strong>ition time b<strong>et</strong>ween 2.0 and 2.5 s and an echo time b<strong>et</strong>ween 30<br />
and 35 ms. Up to ten axi<strong>al</strong> slices were collected with a field of view ranging<br />
from 96 113 mm to 128 128 mm and a slice thickness of 1.25–2 mm. The<br />
in-plane resolution of the function<strong>al</strong> images was 1.5 1.5 mm for the majority<br />
of the scans.<br />
fMRI an<strong>al</strong>ysis. Data an<strong>al</strong>ysis was carried out on a PC running the Windows<br />
operating system and custom-written software using MATLAB (MathWorks) as<br />
well as the AFNI/SUMA software package 39 . To an<strong>al</strong>yze fMRI data, raw images<br />
were first converted from the generic BRUKER into the common AFNI data<br />
format. fMRI in monkeys is prone to image distortions arising from movements<br />
and postur<strong>al</strong> adjustments. We minimized distortions over time by<br />
excluding time points for which ghosting or movement led to irreparable<br />
image distortion, and applying the AFNI function 3dWarpDrive to each time<br />
point, which applied an affine transformation to each time point on a slice by<br />
slice basis to match a reference slice. These measures substanti<strong>al</strong>ly improved the<br />
qu<strong>al</strong>ity of the spati<strong>al</strong> mapping, as well as the BOLD time courses.<br />
To an<strong>al</strong>yze function<strong>al</strong> activation, we converted the adjusted images of each<br />
scan into units of percent change by subtracting each run’s mean v<strong>al</strong>ue from the<br />
time series of each voxel, and subsequently dividing by the same v<strong>al</strong>ue, on a<br />
voxel-by-voxel basis. Note that for presentation purposes, we later subtracted<br />
the mean activity during the fixation condition from activity in the other<br />
conditions, defining it to be our baseline for comparing experiment<strong>al</strong> conditions).<br />
To correct for slow drifts in the magn<strong>et</strong>ic resonance sign<strong>al</strong> that were<br />
unrelated to the task, we high-pass filtered each scan using a bi-direction<strong>al</strong><br />
second-order Butterworth filter with a cutoff frequency of 0.0025 Hz.<br />
A region of interest was defined as the targ<strong>et</strong> stimulus–responsive region<br />
of primary visu<strong>al</strong> cortex that showed significant activity differences for<br />
targ<strong>et</strong> versus nontarg<strong>et</strong> presentation conditions defined as any voxel in the<br />
anatomic<strong>al</strong> limits of V1 exhibiting a t v<strong>al</strong>ue more than two s.d. away from the<br />
average of the t score maps (Supplementary Fig. 1).<br />
Neurophysiologic<strong>al</strong> recordings. Extracellular single-unit and LFP recordings<br />
were carried out using sharp insulated microelectrodes and multi-contact<br />
transcortic<strong>al</strong> electrodes. Single-unit activity and LFPs were recorded from the<br />
primary visu<strong>al</strong> cortex of both anim<strong>al</strong>s. Recordings were carried out inside a<br />
radio frequency–shielded booth that was <strong>al</strong>so used for behavior<strong>al</strong> testing. In <strong>al</strong>l<br />
cases voltages were measured against a loc<strong>al</strong> reference that was close to the<br />
electrode contacts (that is, a stainless steel guide tube or the hypodermic<br />
m<strong>et</strong><strong>al</strong>lic shaft surrounding the multi-contact electrodes). Recording electrodes<br />
consisted of both single channel microelectrodes (Thomas Recording GmbH)<br />
as well as 16- and 24-multicontact contact electrodes with an intercontact<br />
spacing of 150 mm and100mm, respectively (Neurotrack).<br />
Single-unit and LFP activity was collected using both electrode types with<br />
the MAP recording system (Plexon). The V1 sites were located dors<strong>al</strong>ly, sever<strong>al</strong><br />
millim<strong>et</strong>ers posterior to the lunate sulcus, and covered the parafove<strong>al</strong> region<br />
close to the vertic<strong>al</strong> meridian.<br />
Single units were isolated and characterized in terms of their basic response<br />
characteristics using a custom-written program for receptive field estimation.<br />
Multiunit activity, in the form of voltage spikes exceeding a manu<strong>al</strong>ly s<strong>et</strong><br />
threshold, were collected and digitized by the MAP recording system. Singleunit<br />
impulses were derived from the multiunit data by using a commerci<strong>al</strong>ly<br />
available spike sorting program (Plexon). The qu<strong>al</strong>ity of isolation was assessed<br />
and rated by two investigators, and only units with perfectly (that is, compl<strong>et</strong>ely<br />
unambiguous) isolated clusters were included in the an<strong>al</strong>ysis. The LFPs<br />
(measured as voltage fluctuations b<strong>et</strong>ween 1 and 100 Hz) were collected<br />
simultaneously using the same system and digitized at 1 kHz. Notably, during<br />
<strong>al</strong>l of the recording sessions, the monkeys’ task was similar in every respect to<br />
that inside the scanner. All behavior<strong>al</strong> and stimulus events were encoded and<br />
recorded tog<strong>et</strong>her with the neuron<strong>al</strong> sign<strong>al</strong> on a separate channel to <strong>al</strong>ign the<br />
data during post hoc an<strong>al</strong>ysis.<br />
Neuron<strong>al</strong> data an<strong>al</strong>ysis. All neurophysiologic<strong>al</strong> data was processed and<br />
an<strong>al</strong>yzed using custom-written code for MATLAB. Single-unit spiking data<br />
was converted into spike-density functions with a sample rate of 1 kHz by<br />
replacing each spike time with a Gaussian kernel. LFPs were resampled at 1 kHz<br />
and converted into microvolts as a function of time. Spectrograms were<br />
computed using the Fast Fourier Transform with a running window size of<br />
256 ms and an overlap of 255 ms or the multitaper m<strong>et</strong>hod (CHRONUX<br />
toolbox for Matlab, http://www.chronux.org/) using similar param<strong>et</strong>ers. Both<br />
techniques yielded highly similar results.<br />
In addition, we subdivided the LFP data into different bands in the<br />
frequency domain using a second-order, bi-direction<strong>al</strong>, zero-phase Chebyshev<br />
type-1 filter. The resulting band-limited sign<strong>al</strong>s were full-wave rectified by<br />
taking their absolute v<strong>al</strong>ue, and resampled at 200 Hz. Rectifying the bandlimited<br />
voltage fluctuations results in a measure of time-varying amplitude, or<br />
sign<strong>al</strong> power (in actu<strong>al</strong>ity, the square root of the power), in each frequency<br />
band. This band-limited power (BLP) is roughly equiv<strong>al</strong>ent to averaging sever<strong>al</strong><br />
adjacent rows of a spectrogram (for an extended discussion, see ref. 40). For<br />
conditions in which percent change above baseline was computed, the baseline<br />
was taken to be the mean firing rate or mean band-limited LFP power<br />
measured during the fixation period.<br />
Note: Supplementary information is available on the Nature Neuroscience website.<br />
ACKNOWLEDGMENTS<br />
We would like to thank G. Dold, D. Ide, N. Nichols and T. T<strong>al</strong>bot, as well as<br />
K. Smith, N. Phipps and J. Yu for technic<strong>al</strong> assistance. We <strong>al</strong>so thank H. Merkle<br />
for extensive guidance on the design and fabrication of radio frequency coils,<br />
R. Cox for assistance with magn<strong>et</strong>ic resonance image <strong>al</strong>ignment, D. Sheinberg for<br />
help with the stimulus software, K. King and C. Brewer for auditory testing and<br />
ear plug manufacture, W. Vinje for help with the multi-contact electrodes, K.<br />
Tanji, A.H. Bell and Z. Saad for help with the fMRI an<strong>al</strong>ysis, and S. Guderian,<br />
M. Schmid and K.-M. Mueller for discussions. This work was supported by<br />
the Intramur<strong>al</strong> Research Programs of the Nation<strong>al</strong> Institute of Ment<strong>al</strong> He<strong>al</strong>th,<br />
the Nation<strong>al</strong> Institute of Neurologic<strong>al</strong> Disorders and Stroke and the Nation<strong>al</strong><br />
Eye Institute.<br />
AUTHOR CONTRIBUTIONS<br />
A.M., M.W. and D.A.L. designed the experiments. A.M., M.W., C.A., C.Z., F.Q.Y.<br />
and D.A.L. contributed to the fMRI experiments. A.M., M.W. and C.A. carried<br />
out the electrophysiologic<strong>al</strong> testing, and M.W. collected the psychophysic<strong>al</strong> data.<br />
A.M. an<strong>al</strong>yzed the fMRI and electrophysiologic<strong>al</strong> data. A.M. and D.A.L. wrote<br />
the paper.<br />
Published online at http://www.nature.com/natureneuroscience/<br />
Reprints and permissions information is available online at http://npg.nature.com/<br />
reprintsandpermissions/<br />
1. Blake, R. & Logoth<strong>et</strong>is, N.K. Visu<strong>al</strong> comp<strong>et</strong>ition. Nat. Rev. Neurosci. 3, 13–21<br />
(2002).<br />
2. Crick, F. & Koch, C. Are we aware of neur<strong>al</strong> activity in primary visu<strong>al</strong> cortex Nature 375,<br />
121–123 (1995).<br />
NATURE NEUROSCIENCE VOLUME 11 [ NUMBER 10 [ OCTOBER <strong>2008</strong> 1199
ARTICLES<br />
© <strong>2008</strong> Nature Publishing Group http://www.nature.com/natureneuroscience<br />
3. Polonsky, A., Blake, R., Braun, J. & Heeger, D.J. Neuron<strong>al</strong> activity in human primary<br />
visu<strong>al</strong> cortex correlates with perception during binocular riv<strong>al</strong>ry. Nat. Neurosci. 3,<br />
1153–1159 (2000).<br />
4. Tong, F. & Engel, S.A. Interocular riv<strong>al</strong>ry reve<strong>al</strong>ed in the human cortic<strong>al</strong> blind-spot<br />
representation. Nature 411, 195–199 (2001).<br />
5. Haynes, J.D. & Rees, G. Predicting the stream of consciousness from activity in human<br />
visu<strong>al</strong> cortex. Curr. Biol. 15, 1301–1307 (2005).<br />
6. Haynes, J.D., Deichmann, R. & Rees, G. Eye-specific effects of binocular riv<strong>al</strong>ry in the<br />
human later<strong>al</strong> geniculate nucleus. Nature 438, 496–499 (2005).<br />
7. Wunderlich, K., Schneider, K.A. & Kastner, S. Neur<strong>al</strong> correlates of binocular riv<strong>al</strong>ry in the<br />
human later<strong>al</strong> geniculate nucleus. Nat. Neurosci. 8, 1595–1602 (2005).<br />
8. Lee, S.H., Blake, R. & Heeger, D.J. Traveling waves of activity in primary visu<strong>al</strong> cortex<br />
during binocular riv<strong>al</strong>ry. Nat. Neurosci. 8, 22–23 (2005).<br />
9. Lee, S.H. & Blake, R. V1 activity is reduced during binocular riv<strong>al</strong>ry. J. Vis. 2, 618–626<br />
(2002).<br />
10. Leopold, D.A. & Logoth<strong>et</strong>is, N.K. Activity changes in early visu<strong>al</strong> cortex reflect monkeys’<br />
percepts during binocular riv<strong>al</strong>ry. Nature 379, 549–553 (1996).<br />
11. Leopold, D.A., <strong>Maier</strong>, A., Wilke, M. & Logoth<strong>et</strong>is, N.K. Binocular riv<strong>al</strong>ry and the illusion<br />
of monocular vision. in Binocular Riv<strong>al</strong>ry and Perceptu<strong>al</strong> Ambiguity (eds. Alais, D. &<br />
Blake, R.) (MIT Press, Cambridge, Massachus<strong>et</strong>ts, 2004).<br />
12. Gail, A., Brinksmeyer, H.J. & Eckhorn, R. Perception-related modulations of loc<strong>al</strong> field<br />
potenti<strong>al</strong> power and coherence in primary visu<strong>al</strong> cortex of awake monkey during<br />
binocular riv<strong>al</strong>ry. Cereb. Cortex 14, 300–313 (2004).<br />
13. Wilke, M., Logoth<strong>et</strong>is, N.K. & Leopold, D.A. Loc<strong>al</strong> field potenti<strong>al</strong> reflects perceptu<strong>al</strong><br />
suppression in monkey visu<strong>al</strong> cortex. Proc. Natl. Acad. Sci. USA 103, 17507–17512<br />
(2006).<br />
14. Tong, F. Primary visu<strong>al</strong> cortex and visu<strong>al</strong> awareness. Nat. Rev. Neurosci. 4, 219–229<br />
(2003).<br />
15. Tong, F., Meng, M. & Blake, R. Neur<strong>al</strong> bases of binocular riv<strong>al</strong>ry. Trends Cogn. Sci. 10,<br />
502–511 (2006).<br />
16. Wilke, M., Logoth<strong>et</strong>is, N.K. & Leopold, D.A. Gener<strong>al</strong>ized flash suppression of s<strong>al</strong>ient<br />
visu<strong>al</strong> targ<strong>et</strong>s. Neuron 39, 1043–1052 (2003).<br />
17. Bonneh, Y.S., Cooperman, A. & Sagi, D. Motion-induced blindness in norm<strong>al</strong> observers.<br />
Nature 411, 798–801 (2001).<br />
18. Wolfe, J.M. Reversing ocular dominance and suppression in a single flash. Vision Res.<br />
24, 471–478 (1984).<br />
19. <strong>Maier</strong>, A., Logoth<strong>et</strong>is, N.K. & Leopold, D.A. Context-dependent perceptu<strong>al</strong> modulation of<br />
single neurons in primate visu<strong>al</strong> cortex. Proc. Natl. Acad. Sci. USA 104, 5620–5625<br />
(2007).<br />
20. Logoth<strong>et</strong>is, N.K. & Sch<strong>al</strong>l, J.D. Neuron<strong>al</strong> correlates of subjective visu<strong>al</strong> perception.<br />
Science 245, 761–763 (1989).<br />
21. Gauthier, C. & Hoge, R.D. BOLD-perfusion coupling during monocular and binocular<br />
stimulation. Int. J. Biomed. Imaging published online, doi: 10.1155/<strong>2008</strong>/628718<br />
(2 March <strong>2008</strong>).<br />
22. Logoth<strong>et</strong>is, N.K. The neur<strong>al</strong> basis of the blood-oxygen-level–dependent function<strong>al</strong><br />
magn<strong>et</strong>ic resonance imaging sign<strong>al</strong>. Phil. Trans. R. Soc. Lond. B 357, 1003–1037<br />
(2002).<br />
23. Mitchell, J.F., Sundberg, K.A. & Reynolds, J.H. Differenti<strong>al</strong> attention-dependent<br />
response modulation across cell classes in macaque visu<strong>al</strong> area V4. Neuron 55,<br />
131–141 (2007).<br />
24. Iadecola, C. Neurovascular regulation in the norm<strong>al</strong> brain and in Alzheimer’s disease.<br />
Nat. Rev. Neurosci. 5, 347–360 (2004).<br />
25. Logoth<strong>et</strong>is, N.K. The underpinnings of the BOLD function<strong>al</strong> magn<strong>et</strong>ic resonance<br />
imaging sign<strong>al</strong>. J. Neurosci. 23, 3963–3971 (2003).<br />
26. Niessing, J. <strong>et</strong> <strong>al</strong>. Hemodynamic sign<strong>al</strong>s correlate tightly with synchronized gamma<br />
oscillations. Science 309, 948–951 (2005).<br />
27. Viswanathan, A. & Freeman, R.D. Neurom<strong>et</strong>abolic coupling in cerebr<strong>al</strong> cortex reflects<br />
synaptic more than spiking activity. Nat. Neurosci. 10, 1308–1312 (2007).<br />
28. Super, H., Spekreijse, H. & Lamme, V.A. Two distinct modes of sensory processing<br />
observed in monkey primary visu<strong>al</strong> cortex (V1). Nat. Neurosci. 4, 304–310 (2001).<br />
29. Lamme, V.A., Super, H., Landman, R., Roelfsema, P.R. & Spekreijse, H. The role of<br />
primary visu<strong>al</strong> cortex (V1) in visu<strong>al</strong> awareness. Vision Res. 40, 1507–1521 (2000).<br />
30. Posner, M.I. & Gilbert, C.D. Attention and primary visu<strong>al</strong> cortex. Proc. Natl. Acad. Sci.<br />
USA 96, 2585–2587 (1999).<br />
31. <strong>Maier</strong>, A., Aura, C. & Leopold, D.A. Laminar differences in perceptu<strong>al</strong> modulation of V1<br />
loc<strong>al</strong> field potenti<strong>al</strong>s. Soc. Neurosci. Abstr. 451.12 (2007).<br />
32. Shmuel, A. & Leopold, D.A. Neuron<strong>al</strong> correlates of spontaneous fluctuations in fMRI<br />
sign<strong>al</strong>s in monkey visu<strong>al</strong> cortex: Implications for function<strong>al</strong> connectivity at rest. Hum.<br />
Brain Mapp. 29, 751–761 (<strong>2008</strong>).<br />
33. Mukamel, R. <strong>et</strong> <strong>al</strong>. Coupling b<strong>et</strong>ween neuron<strong>al</strong> firing, field potenti<strong>al</strong>s and FMRI in human<br />
auditory cortex. Science 309, 951–954 (2005).<br />
34. Nir, Y. <strong>et</strong> <strong>al</strong>. Coupling b<strong>et</strong>ween neuron<strong>al</strong> firing rate, gamma LFP and BOLD fMRI is<br />
related to interneuron<strong>al</strong> correlations. Curr. Biol. 17, 1275–1285 (2007).<br />
35. Judge, S.J., Richmond, B.J. & Chu, F.C. Implantation of magn<strong>et</strong>ic search coils for<br />
measurement of eye position: an improved m<strong>et</strong>hod. Vision Res. 20, 535–538<br />
(1980).<br />
36. Mitz, A.R. A liquid-delivery device that provides precise reward control for neurophysiologic<strong>al</strong><br />
and behavior<strong>al</strong> experiments. J. Neurosci. M<strong>et</strong>hods 148, 19–25<br />
(2005).<br />
37. Gru<strong>et</strong>ter, R. Automatic, loc<strong>al</strong>ized in vivo adjustment of <strong>al</strong>l first- and second-order shim<br />
coils. Magn. Reson. Med. 29, 804–811 (1993).<br />
38. Mansfield, P. Multi-planar image formation using NMR spin echoes. J. Phys. C Solid<br />
State Phys. 10, L55–L58 (1977).<br />
39. Cox, R.W. Software for an<strong>al</strong>ysis and visu<strong>al</strong>ization of function<strong>al</strong> magn<strong>et</strong>ic resonance<br />
neuroimages. Comput. Biomed. Res. 29, 162–173 (1996).<br />
40. Leopold, D.A., Murayama, Y. & Logoth<strong>et</strong>is, N.K. Very slow activity fluctuations in monkey<br />
visu<strong>al</strong> cortex: implications for function<strong>al</strong> brain imaging. Cereb. Cortex 13, 422–433<br />
(2003).<br />
1200 VOLUME 11 [ NUMBER 10 [ OCTOBER <strong>2008</strong> NATURE NEUROSCIENCE