using aerosol pheromone âpuffersâ - Walnut Research Reports
using aerosol pheromone âpuffersâ - Walnut Research Reports
using aerosol pheromone âpuffersâ - Walnut Research Reports

Create successful ePaper yourself
Turn your PDF publications into a flip-book with our unique Google optimized e-Paper software.
USING AEROSOL PHEROMONE “PUFFERS” FOR AREA-WIDE<br />
SUPPRESSION OF CODLING MOTH IN WALNUTS: YEAR TWO<br />
&<br />
DEMONSTRATION OF AERIALLY APPLIED PHEROMONE<br />
LAMINATE FLAKES<br />
C. Pickel, J. Grant, S. Welter, R. Buchner, and S. Goldman Smith<br />
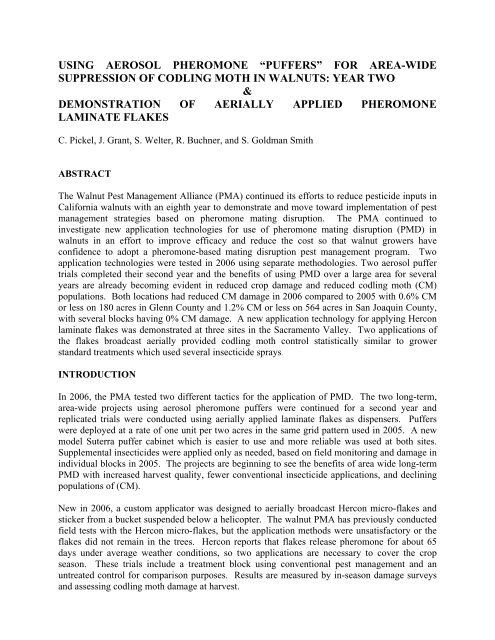
ABSTRACT<br />
The <strong>Walnut</strong> Pest Management Alliance (PMA) continued its efforts to reduce pesticide inputs in<br />
California walnuts with an eighth year to demonstrate and move toward implementation of pest<br />
management strategies based on <strong>pheromone</strong> mating disruption. The PMA continued to<br />
investigate new application technologies for use of <strong>pheromone</strong> mating disruption (PMD) in<br />
walnuts in an effort to improve efficacy and reduce the cost so that walnut growers have<br />
confidence to adopt a <strong>pheromone</strong>-based mating disruption pest management program. Two<br />
application technologies were tested in 2006 <strong>using</strong> separate methodologies. Two <strong>aerosol</strong> puffer<br />
trials completed their second year and the benefits of <strong>using</strong> PMD over a large area for several<br />
years are already becoming evident in reduced crop damage and reduced codling moth (CM)<br />
populations. Both locations had reduced CM damage in 2006 compared to 2005 with 0.6% CM<br />
or less on 180 acres in Glenn County and 1.2% CM or less on 564 acres in San Joaquin County,<br />
with several blocks having 0% CM damage. A new application technology for applying Hercon<br />
laminate flakes was demonstrated at three sites in the Sacramento Valley. Two applications of<br />
the flakes broadcast aerially provided codling moth control statistically similar to grower<br />
standard treatments which used several insecticide sprays.<br />
INTRODUCTION<br />
In 2006, the PMA tested two different tactics for the application of PMD. The two long-term,<br />
area-wide projects <strong>using</strong> <strong>aerosol</strong> <strong>pheromone</strong> puffers were continued for a second year and<br />
replicated trials were conducted <strong>using</strong> aerially applied laminate flakes as dispensers. Puffers<br />
were deployed at a rate of one unit per two acres in the same grid pattern used in 2005. A new<br />
model Suterra puffer cabinet which is easier to use and more reliable was used at both sites.<br />
Supplemental insecticides were applied only as needed, based on field monitoring and damage in<br />
individual blocks in 2005. The projects are beginning to see the benefits of area wide long-term<br />
PMD with increased harvest quality, fewer conventional insecticide applications, and declining<br />
populations of (CM).<br />
New in 2006, a custom applicator was designed to aerially broadcast Hercon micro-flakes and<br />
sticker from a bucket suspended below a helicopter. The walnut PMA has previously conducted<br />
field tests with the Hercon micro-flakes, but the application methods were unsatisfactory or the<br />
flakes did not remain in the trees. Hercon reports that flakes release <strong>pheromone</strong> for about 65<br />
days under average weather conditions, so two applications are necessary to cover the crop<br />
season. These trials include a treatment block <strong>using</strong> conventional pest management and an<br />
untreated control for comparison purposes. Results are measured by in-season damage surveys<br />
and assessing codling moth damage at harvest.
OBJECTIVES<br />
1. Validate <strong>pheromone</strong> application technology required for control of codling moth with an<br />
emphasis on “area-wide” control over multiple years. Continue existing trials in San Joaquin<br />
and Glenn Counties <strong>using</strong> <strong>aerosol</strong> puffers. Monitor codling moth populations to watch for<br />
population increases and to determine spray timings. Monitor damage to the crop with inseason<br />
surveys of nuts in the canopy. Over time, the need for supplemental sprays should be<br />
decreased or eliminated.<br />
2. Field test new <strong>pheromone</strong> application technologies that have a high potential for use in<br />
walnuts.<br />
3. Assist with and demonstrate the use of monitoring for CM damage for growers who are<br />
interested in implementation of <strong>pheromone</strong> mating disruption.<br />
PROCEDURES<br />
Aerosol Puffers<br />
Both locations chosen to demonstrate the use of Suterra’s <strong>aerosol</strong> <strong>pheromone</strong> puffers for CM<br />
management are large areas of contiguous walnut orchards of several different varieties. Both<br />
sites include blocks with historically high CM pressure as well as portions planted with varieties<br />
that are more resistant to CM damage. The Glenn County site is 185 acres of walnuts and<br />
consists of three blocks, each a different variety and age (Figure 1). The San Joaquin County site<br />
is 564 acres comprised of 22 blocks of various tree size, age, and variety (Figure 2).<br />
This project was designed to manage codling moth with <strong>pheromone</strong>s by lowering populations<br />
aggressively in the early years with insecticides. After this, the supplemental treatments would<br />
be reduced or eliminated, or switched to less effective but more selective insecticides that are<br />
more environmentally responsible. As the population is brought down, the supplemental<br />
insecticides are withdrawn and decisions are made based on monitoring data. Although the<br />
benefits of <strong>pheromone</strong> puffers will extend equally over the whole trial site, each block is<br />
managed separately. In 2005, all <strong>pheromone</strong> treated blocks were supplemented with at least one<br />
insecticide treatment to ensure high quality nuts at harvest and reduce population levels at the<br />
start of the 2006 season. In 2006, an emphasis was placed on managing codling moth population<br />
based on combo lure trap catches and not based on potential damage to the nuts. The two trial<br />
locations are independent and the results are not meant to be compared to each other.<br />
At both sites, Suterra CM puffers were installed at a rate of one puffer per two acres with a<br />
slightly higher concentration along the outside edges. After recording the initial weight of each<br />
<strong>aerosol</strong> <strong>pheromone</strong> can, the units were assembled and deployed at or before the start of codling<br />
moth flight when possible. The units are hung with rope in the upper ¼ of the tree canopy and<br />
programmed to emit a 40 mg. “puff” of <strong>pheromone</strong> at 15 minute intervals for a period of 12<br />
hours each night, beginning at 5 PM. Although they are designed to last 200 days, the trial<br />
protocols called for servicing of the units on a regular basis to ensure operational integrity. The<br />
<strong>aerosol</strong> cans were weighed at each servicing, and again at the end of the season when they were<br />
removed from the field.<br />
The puffer trials were monitored with Trece Phreocon VI “wing” traps used in sets of two. Each<br />
pair included one trap baited with the newer “DA/CM combo” lure and hung high in the tree<br />
canopy and one with the traditional 1X <strong>pheromone</strong> lure hung low in the canopy. The 1X traps
act as an “early warning system”: they should not catch any moths in a <strong>pheromone</strong>-treated<br />
orchard. The Glenn County trial had 8 pairs of traps, one pair per every 25 acres. The San<br />
Joaquin trial used traps at a higher density, with a total of 39 pairs of traps. All traps were<br />
checked weekly and the lures changed as recommended by the manufacturer.<br />
In-season “canopy counts” of CM-damaged nuts were performed at least twice during the<br />
season, more if time allowed. At the Glenn site, 1000 nuts throughout the tree canopies were<br />
examined for CM damage in approximately every 25 acres. At the SJ site, 600 nuts were<br />
examined in each block. Independent consulting firms provide Pest Control Advisor service to<br />
both of the grower/cooperators involved. Data collected from all monitoring activities was<br />
shared with the grower/cooperator and Pest Control Advisor.<br />
Supplemental insecticides were applied as needed <strong>using</strong> the growers’ choice of materials, based<br />
on field monitoring and damage in individual blocks in 2005. Tables 1 and 2 list insecticide<br />
sprays to the Glenn and San Joaquin sites, and include all those which could affect codling moth,<br />
though some sprays target other insect pests such as walnut husk fly or navel orangeworm.<br />
Codling moth damage, total trap catches, and the number of sprays were compared to previous<br />
years to demonstrate reduction of broad spectrum insecticides and a move to softer insecticides<br />
to supplement PMD.<br />
Harvest samples were collected during commercial harvesting operations. Protocols for the<br />
collection of harvest samples varied slightly between the two sites due to the difference in plot<br />
layout. At the San Joaquin site, twenty 25-nut samples were collected from under trees after<br />
shaking in each test block. At the Glenn Co. site, ten 50-nut samples were collected in the<br />
general area of each of the 8 monitoring areas discussed above. All nuts were cracked and<br />
examined to assess damage from codling moth and navel orangeworm.<br />
Laminate Micro-Flakes<br />
In 2006, aerially applied Hercon laminate micro-flakes were used at three trial locations in the<br />
Sacramento Valley. The intentions of these trials were to test efficacy and a method of<br />
application and to document whether the flakes remained in the canopy or fell on the ground.<br />
The new bucket-type applicator and a reformulated sticker were used, both developed by Hercon<br />
Environmental<br />
The Hercon treatment blocks were between 14-20 acres, and each location included a “grower<br />
standard” (GS) where the grower used conventional pest control materials of his choosing. Each<br />
trial also included an untreated area of 1 to 2 acres. The Hercon flakes were applied at<br />
approximately 65 day intervals beginning when overwintering generation female moths began to<br />
be consistently caught in the indicator traps and the orchards had leaves mostly expanded. The<br />
Hercon treatment blocks at all three sites also received a supplemental Lorsban application to<br />
reduce risk to the grower, and because two of the locations had an unknown (to UC researchers)<br />
CM population.<br />
To obtain data measuring how well the Hercon flakes stuck on the leaves, both during the<br />
applications and for the 65 days afterwards, sheets of black plastic were laid on the ground and<br />
pinned down at the edges. The plastic sheets were 10 ft X 25 ft each and were placed in the tree<br />
row between two trees, five replicates at each location. The day of application and every week
after that, any flakes that were on the plastic were counted and removed. This was repeated for<br />
each of the applications of flakes, with separate totals for the two applications.<br />
Test blocks were monitored with pairs of traps as described above for the <strong>aerosol</strong> puffers. The<br />
traps were checked weekly to follow the CM flights and changes in population. The lures were<br />
changed according to the manufacturer’s instructions. Canopy counts were also conducted as<br />
described previously, surveying 1000 nuts per treatment block near the end of each flight. If, at<br />
any time, more than 2% damage was found in the Hercon test block, the grower was advised to<br />
apply a supplemental insecticide of their choice. Insecticide sprays listed in Table 3 include<br />
those aimed at other insects as well as codling moth. Harvest sampling and processing was<br />
performed following the same protocols as the <strong>aerosol</strong> puffer project, collecting 50 nuts from 10<br />
randomly selected trees in each treatment block, for a total of 500 nuts per block.<br />
RESULTS<br />
Aerosol puffers<br />
The traps baited with the 1X lure caught no moths at either site after puffers were deployed.<br />
“Combo” trap catches provided a good picture of CM generations and peaks in flight, shown in<br />
Figure 3 Glenn site, and Figure 4 San Joaquin. At the Glenn site, flooding from the Sacramento<br />
River caused the Vina orchard to be inaccessible for puffer placement until the first week of May<br />
when there was already considerable CM activity. The Northeast section of the Vinas was the<br />
last area to have CM control from the <strong>pheromone</strong> puffers, resulting in increased trap catches for<br />
the whole season in this location.<br />
The puffer units performed well all season with very few malfunctions. Calculations based on<br />
the weight loss of the <strong>aerosol</strong> cans showed them to be emitting <strong>pheromone</strong> within the daily<br />
expected range. The 81 <strong>aerosol</strong> cans at the Glenn site each lost an average of 2.2 grams per day.<br />
Details of the puffer units’ servicing records are not presented here.<br />
Canopy counts were performed twice during the season, in late June and again at the beginning<br />
of August. Very little evidence of damage from CM was found during these surveys, with all<br />
blocks at the Glenn site showing less than 1% damage (Table 4). The SJ site also had very little<br />
in-season damage, with a couple of exceptions (Table 5). In the first canopy count, Field 2,<br />
planted to the Serr variety, was the only block with more than 0.5% damage. Field 2 also had the<br />
most CM damage found during the second canopy count with 2.3%, and was one of only four<br />
blocks to have more than 1% damage.<br />
Harvest samples reported here include only damage found in “sound” nuts (with intact kernels)<br />
and not “unsound” nuts (with shriveled kernels) that would probably be removed and discarded<br />
during normal pickup and processing operations. Thus sample damage levels are comparable to<br />
growers’ harvest grade results. Both trial locations had very little damage from navel<br />
orangeworm or codling moth, with several blocks having zero percent damage (Tables 4 and 5).<br />
Overall, 2006 damage levels were much lower those observed in the same blocks in 2005.<br />
Three-quarters of the blocks at the Glenn site had less damage in 2006 than 2005 (Figure 5). All<br />
blocks at the SJ site had less damage in 2006 than 2005 (Figure 6).<br />
Codling moth population reduction can be shown by comparing the total moth capture in combo<br />
traps for each year. At the Glenn site (Figure 7), seasonal trap captures were lower in 2006 than
2005 in most blocks. The large trap captures in the Northeast Vinas were attributed to puffers<br />
being deployed after the start of the first codling moth flight. At the SJ site there were no<br />
consistent differences between 2005 and 2006 in seasonal trap catches (Figure 8).<br />
Laminate Micro-Flakes<br />
In these trials, the traps baited with the combo lure and placed high in the canopy showed CM<br />
flight activity in all treatments. The 1X traps, hung low in the tree, show that the treatment is<br />
working when they catch zero moths in the <strong>pheromone</strong>-treated area, but still catch moths in the<br />
Grower Standard and Untreated Control. This trap shutdown is measured by comparing total 1X<br />
trap catches in the Hercon block to total trap catches in the Untreated Control, both 1X-Low and<br />
combo-High (Figure 9). The 1X trap at the Tehama site was shutdown 100%, the Butte and<br />
Glenn sites caught a couple of moths in the 1X traps, resulting in slightly less than 100%<br />
shutdown. These moths were found in the 1X traps in mid- and late-August when populations<br />
were increasing and long periods of very high temperatures may have started to reduce the<br />
effectiveness of the <strong>pheromone</strong> in the Hercon flakes.<br />
In-season damage assessments in the canopy were conducted three times at the Butte and<br />
Glenn sites, but only once at the Tehama site because a pruning tower was required to reach the<br />
tree canopy. Later season canopy counts can be a good indicator of harvest damage levels.<br />
Table 6 shows data from the canopy count in early August, at the end of the second flight, with<br />
CM damage well below 2%.<br />
To catch any Hercon flakes that fell from the trees, the plastic sheets were placed on the ground<br />
before the first application. The sheets were put between trees of varying canopy size and<br />
density to represent the whole orchard. The highest numbers of flakes were found on the plastic<br />
sheets just after the application, and for about 2-3 weeks afterwards (Figures 10 & 11). The<br />
Tehama county site was the Tehama variety which is a later leafing variety with a larger tree<br />
canopy and had less leafing than the other 2 orchards at the 1 st application allowing a high<br />
number of the flakes to fall on the plastic. At the 2 nd application it had the least flakes fall when<br />
it was fully leafed out. For the remaining weeks, very few flakes dropped on the plastic<br />
indicating that, with good contact between the leaf and the flake, the majority of the flakes<br />
remained in the canopy. Some flakes were found still stuck on leaves at the end of the season as<br />
the trees began to defoliate.<br />
Harvest samples reported here contained data from only the “sound” nuts, as described in the<br />
above section. Damage from both codling moth and navel orangeworm was recorded for each of<br />
the treatment blocks (Table 7). Harvest data from the three trials was pooled, with each location<br />
as a rep. Average codling moth damage was less than 1% in all treatment blocks (Figure 12),<br />
with no statistically significant differences between them. In general, the Hercon-treated blocks<br />
were supplemented with one Lorsban spray, and one site received another Lorsban application<br />
for walnut husk fly. The Grower Standard blocks all received either two or three insecticide<br />
applications. Numerically, the harvest damage in the Hercon-treated blocks was half that of the<br />
Grower Standard blocks, showing that Hercon micro-flakes provided codling moth damage<br />
suppression better than conventional insecticides. This shows <strong>pheromone</strong> mating disruption can<br />
be integrated into a codling moth management program and can control CM damage as well as<br />
conventional methods.
DISCUSSION<br />
The grower/cooperators at both of the puffer trial sites are enthusiastic about integrating <strong>aerosol</strong><br />
puffers into their pest management program. The PMA plans to continue the <strong>aerosol</strong> puffer trials<br />
for up to three more years to demonstrate the long term population reduction and reduced use of<br />
pesticides that have been seen in other crops such as pears. In the next couple of years these<br />
trials will rely less on pesticide inputs, with 2005 acting as a baseline for the comparisons of<br />
damage and documentation of pesticide use reduction in each block.<br />
The bucket applicator for the Hercon micro-flakes was designed jointly by Russ Stocker of<br />
ARENA Pest Management and Hercon Enviromental, and was operated by AvAg aerial<br />
applicators. It is one of several methods of applying the Hercon flakes, so far the most<br />
successful. The application is quick and faces no obstructions from wet soil, irrigation pipes, or<br />
other ground operations and above all, easy for the grower. It also makes the application in the<br />
top of the tree canopy which would be difficult to do in the large walnut trees.<br />
An ongoing challenge is the monitoring of CM flights in and close to <strong>pheromone</strong>-disrupted<br />
orchards. 2006 was the third year of <strong>using</strong> combo lures to overcome this difficulty. In some<br />
cases, lures were provided to neighboring growers in case the <strong>pheromone</strong> treatments (especially<br />
the puffers) shut down their conventional <strong>pheromone</strong>-baited traps. In fact, communication with<br />
neighboring growers is becoming more important as <strong>pheromone</strong>s are being more widely used for<br />
pest management.<br />
Goals for 2007 include expansion of the puffer treated areas by encouraging the neighboring<br />
walnut growers to participate, taking advantage of the benefits of a larger area utilizing PMD to<br />
control CM. These successful demonstrations are creating more interest and confidence in<br />
integrating <strong>pheromone</strong> mating disruption into walnut pest management programs.
TABLES AND FIGURES<br />
Table 1. Supplemental Insecticides at Glenn Puffer Trial in 2006<br />
Apr 21 May 6-8 Mid - May Mid -Aug Early – Sept. Mid – Sept.<br />
Lorsban +<br />
VINAS --<br />
puffers<br />
Onager Ethrel +<br />
Asana<br />
installed<br />
NORTH ½ permethrin<br />
--<br />
ONLY<br />
TEHAMAS<br />
CHANDLERS<br />
puffers<br />
installed<br />
puffers<br />
installed<br />
* EOR = Every Other Row application<br />
-- Asana --<br />
-- --<br />
Lorsban +<br />
Onager<br />
EOR<br />
for tent<br />
caterpillars<br />
Ethrel +<br />
permethrin<br />
--<br />
--<br />
Ethrel +<br />
permethrin<br />
Table 2. Supplemental Insecticides at San Joaquin puffer site in 2006.<br />
Field/Variety Date Treatment Target Pest<br />
1 4-May Dipel, EOR* Leaf Roller<br />
Tulare 3-Jun Warrior, NuFilm P CM<br />
26-Jun Surround<br />
8-Aug Brigade Aphid, WHF, CM, Mites<br />
22-Aug Success + Nulure, EOR* WHF<br />
2 27-Apr Dipel, EOR* Leaf Roller<br />
Serr 18-May Lorsban CM<br />
21-Jun Surround<br />
28-Jul Success, Nulure EOR* WHF<br />
9-Aug Brigade Aphid, WHF, CM, Mites<br />
25-Aug Success + Nulure, EOR* WHF<br />
3 & 20 2-May Dipel, EOR* Leaf Roller<br />
Chandler 29-May Warrior, NuFilm P<br />
3-Aug Success + Nulure, EOR* WHF<br />
18-Aug Success + Nulure, EOR* WHF<br />
4 11-May Dipel, EOR* Leaf Roller<br />
Serr 16-May Lorsban 4E CM<br />
Chandler 26-Jul Success + Nulure, EOR* WHF<br />
2-Aug Success + Nulure, EOR* WHF<br />
15-Aug Success + Nulure, EOR* WHF<br />
5 18-May Lorsban 4E CM<br />
Serr/Chandler 15-Aug Success + Nulure, EOR* WHF
6 1-May Dipel, EOR* Leaf Roller<br />
Tulare 25-May Warrior, NuFilm P CM<br />
26-Jun Surround 100lbs/Tank<br />
16-Aug Brigade Aphid, WHF, CM, Mites<br />
28-Aug Success + Nulure, EOR* WHF<br />
7 2-May Dipel, EOR* Leaf Roller<br />
Howard 26-May Warrior, NuFilm P CM<br />
26-Jun Surround 100lbs/Tank<br />
16-Aug Success + Nulure, EOR* WHF<br />
8 16-May Lorsban 4E CM<br />
Serr 26-Jul Success + Nulure, EOR* WHF<br />
Chandler 12-Aug Brigade Aphid, WHF, CM, Mites<br />
9 12-May Dipel, EOR* Leaf Roller<br />
Serr 17-May Lorsban 4E CM<br />
Chandler 1-Jun Lorsban 4E CM<br />
22-Jun Surround 100lbs/Tank<br />
10-Aug Brigade Aphid, WHF, CM, Mites<br />
24-Aug Success + Nulure, EOR* WHF<br />
10 3-May Dipel, EOR* Leaf Roller<br />
Vina 19-May Lorsban 4E CM<br />
Serr 1-Jun Lorsban 4E CM<br />
19-Jun Surround 100lbs/Tank<br />
30-Jun Malathion + NuLure<br />
28-Jul Success + Nulure, EOR* WHF<br />
11-Aug Brigade Aphid, WHF, CM, Mites<br />
24-Aug Success + Nulure, EOR* WHF<br />
12 11-May Dipel, EOR* Leaf Roller<br />
Serr 16-May Lorsban 4E CM<br />
Chandler 27-Jul Success + Nulure, EOR* WHF<br />
11-Aug Brigade Aphid, WHF, CM, Mites<br />
14-Aug Success + Nulure, EOR* WHF<br />
14-Aug Success + Nulure, EOR* WHF<br />
13 & 22 10-May Dipel, EOR* Leaf Roller<br />
Chandler 30-May Warrior, NuFilm P CM<br />
28-Aug Success + Nulure, EOR* WHF<br />
14 & 15 11-May Dipel, EOR* Leaf Roller<br />
Serr 17-May Lorsban 4E CM<br />
22-Jun Surround 100lbs/Tank<br />
28-Jul Success + Nulure, EOR* WHF<br />
2-Aug Success + Nulure, EOR* WHF<br />
14-Aug Success + Nulure, EOR* WHF<br />
28-Aug Success + Nulure, EOR* WHF<br />
18 1-Jun Lorsban 4E CM<br />
Serr 28-Jul Success + Nulure, EOR* WHF
19 27-Apr Dipel, EOR* Leaf Roller<br />
Hartley 30-Jun Malathion + NuLure<br />
11-Aug Brigade Aphid, WHF, CM, Mites<br />
18-Aug Success + Nulure, EOR* WHF<br />
23 Howard 27-May Warrior, NuFilm P CM<br />
24 25-Apr Dipel, EOR* Leaf Roller<br />
Vina 24-May Lorsban 4E CM<br />
20-Jun Surround 100lbs/Tank<br />
29-Jun Malathion + NuLure WHF<br />
27-Jul Success + Nulure, EOR* WHF<br />
4-Aug Success + Nulure, EOR* WHF<br />
9-Aug Brigade Aphid, WHF, CM, Mites<br />
22-Aug Success + Nulure, EOR* WHF<br />
25 12-May Dipel, EOR* Leaf Roller<br />
Serr 17-May Lorsban 4E CM<br />
Chandler 21-Jun Surround 100lbs/Tank<br />
27-Jul Success + Nulure, EOR* WHF<br />
4-Aug Success + Nulure, EOR* WHF<br />
18-Aug Success + Nulure, EOR* WHF<br />
29-Aug Success + Nulure, EOR* WHF<br />
* EOR = Every Other Row application<br />
Table 3. 2006 Supplemental Insecticides at Hercon trials<br />
Hercon PMD GS Untreated<br />
Butte 5/05 Hercon flakes<br />
5/16 Asana, EOR*<br />
7/10 Hercon flakes<br />
7/06 Lorsban outside plot<br />
8/23 Omite<br />
8/23 Lorsban, EOR*<br />
8/23 Omite<br />
8/23 Lorsban, EOR*<br />
Tehama 5/05 Hercon flakes<br />
7/06 Lorsban<br />
7/06 Lorsban<br />
7/10 Hercon flakes<br />
8/17 Omite<br />
8/17 Omite<br />
Glenn<br />
8/17 Lorsban, EOR* (WHF)<br />
5/05 Hercon flakes<br />
7/10 Hercon flakes<br />
7/12 Lorsban<br />
8/09 Omite<br />
*EOR = Every Other Row<br />
8/17 Lorsban, EOR* (WHF)<br />
5/17 Asana<br />
7/12 Lorsban<br />
8/09 Omite<br />
8/09 Asana
Table 4. Glenn Puffer Trial<br />
2006 Canopy Counts and Damage at Harvest<br />
Canopy Counts % CM Damage at Harvest<br />
June 19 Aug. 1 % CM % NOW<br />
Vinas NE 0.3 0.0 0.2<br />
Vinas NW 0.4 0.4 0.4<br />
0.0<br />
Vinas SE 0.2 0.2 0.0<br />
Vinas SW<br />
0.0 0.6 0.8<br />
Tehamas W 0.0 0.0 0.0<br />
0.0<br />
Tehamas E<br />
0.4 0.2 0.0<br />
Chandlers W 0.2 0.0 0.0<br />
0.4<br />
Chandlers E<br />
0.1 0.0 0.0<br />
1,000-nut sample each 500-nut sample each<br />
Table 5. San Joaquin Puffer Trial<br />
2006 Canopy Counts and Damage at Harvest<br />
Canopy Counts<br />
% CM<br />
Damage at Harvest<br />
Block Variety 6/28 to 7/06 7/31 to 8/11 % CM % NOW<br />
1 Tulare - - 0.00 0.0<br />
2 Serr 1.5 2.3 1.20 0.0<br />
3 & 20 Chandler - - 0.00 0.0<br />
4<br />
Chandler 0.3 0.5<br />
Serr 0.5 0.3<br />
0.00 0.0<br />
5 Serr/Chandler 0.0 0.3 0.40 0.2<br />
6 Tulare 0.0 0.8 0.00 0.0<br />
7 Howard 0.0 0.3 0.00 0.0<br />
8<br />
Serr<br />
0.35* 0.0<br />
0.2 0.7<br />
Chandler<br />
0.20<br />
0.0<br />
9<br />
Serr<br />
0.80<br />
0.0<br />
0.0 0.8<br />
Chandler<br />
0.20<br />
0.0<br />
10 Vina, Serr 0.0 0.0 0.00 0.2<br />
12 Serr/Chandler 0.0 1.3 0.00 0.4<br />
13 Chandler - - 0.20 0.2<br />
14 & 15 Serr 0.3 1.3 0.40 0.0<br />
18 Serr 0.0 0.0 0.00 0.0<br />
19 Hartley 0.2 1.0 0.00 0.0<br />
22 Chandler - - 0.00 0.0<br />
23 Howard - - 0.40 0.2<br />
24 Vina 0.0 0.0 0.20 0.0<br />
25 Serr/Chandler 0.0 1.2 0.00 0.6<br />
600-nut sample each 500-nut sample each<br />
* Harvest sample of 283 nuts
Table 6. Hercon Canopy Counts<br />
% CM DAMAGE Early August 2006<br />
Site<br />
Hercon<br />
PMD<br />
Grower<br />
Standard<br />
Untreated<br />
Control<br />
Butte 1.3 0.5 1.7<br />
Tehama 0.6 0.9 0.9<br />
Glenn 0.9 0.3 1.1<br />
Average 0.93 0.57 1.24<br />
Table 7. 2006 Percent Damage at Harvest from Codling Moth and Naval Orangeworm.<br />
Hercon PMD Grower Standard Untreated Control<br />
Site % CM % NOW % CM % NOW % CM % NOW<br />
Butte 0.6 4.2 0.4 1.0 1.2 2.2<br />
Tehama 0.4 0.8 1.2 0.8 0.8 0.2<br />
Glenn 0.2 0.8 0.8 0.4 0.0 0.6<br />
Average 0.4 1.9 0.8 0.7 0.7 1.0
Figure 1. Glenn County Puffer Trial<br />
N<br />
P P P P P P P P P P P<br />
P<br />
P P P P P P P P P<br />
Hwy 45<br />
Rd. 54<br />
Vinas 110 ac<br />
P P P P P P P P<br />
P P P P P P P<br />
Sacramento River<br />
P P P P P P P<br />
P P P P P P<br />
P<br />
P<br />
P<br />
Tehamas 37ac<br />
P P P P P P P<br />
P<br />
P<br />
P P P P P P P P P P<br />
Chandlers 30ac<br />
P P P P P P P P P<br />
P<br />
Figure 2. San Joaquin County<br />
Puffer Trial<br />
560 acres<br />
N<br />
F23 Howard<br />
14 X 25<br />
10 A<br />
F5<br />
Serr & Chandler<br />
30 X 28<br />
23 A<br />
F1 Tulare<br />
25 X 22<br />
20 A<br />
F2 Serr &<br />
Chandler<br />
30 X 28<br />
27 A<br />
F4<br />
Chandler<br />
30 X 28<br />
23 A<br />
F3<br />
Chandler<br />
24 X 16<br />
27 A<br />
F25<br />
Serr & Chandler<br />
28 X 30<br />
17 A<br />
F24 Vina<br />
40 X 40, 1 in middle<br />
51 A<br />
F19 Hartley<br />
28 X 30<br />
28 A<br />
F20<br />
Howard & Chandler<br />
24 X 18<br />
28 A<br />
F6 Tulare<br />
25 X 22<br />
36 A<br />
F7 Howard<br />
24 X 16<br />
28 A<br />
F8 Serr & Chandler<br />
30 X 28<br />
25 A<br />
F9 Serr & Chandler<br />
30 X 28<br />
50 A<br />
F10 Serr & Vina<br />
30 X 28<br />
23 A<br />
F13 Chandler<br />
24 X 16<br />
23 A<br />
F22<br />
Chandler<br />
24 X 16<br />
23 A<br />
F12 Serr & Chandler<br />
28 X 30<br />
27A<br />
F11 Howard<br />
17.5 X 24<br />
20 A<br />
F18 Serr & Chandler<br />
30 X 28 24<br />
6 A<br />
F14 & F15<br />
Serr & Chandler<br />
30 X 28<br />
49 A
10<br />
Figure 3. Glenn Puffer Trial<br />
2006 Combo Trap Catches<br />
Moths / Trap / Day<br />
8<br />
6<br />
4<br />
2<br />
0<br />
5/13 6/3 6/24 7/15 8/5 8/26 9/16 10/7<br />
Vinas NE<br />
Vinas NW<br />
Vinas SE<br />
Vinas SW<br />
Tehamas W<br />
Tehamas E<br />
Chandlers W<br />
Chandlers E<br />
Moths / Trap<br />
100<br />
80<br />
60<br />
40<br />
20<br />
Figure 4. San Joaquin Puffer Trial<br />
2006 Combo Trap Catches<br />
0<br />
4/25 5/16 6/6 6/27 7/18 8/8 8/29<br />
F1<br />
F2<br />
F3 & F20<br />
F4<br />
F5<br />
F6<br />
F7<br />
F8<br />
F9<br />
F10<br />
F12<br />
F13<br />
F14 & F15<br />
F18<br />
F19<br />
F22<br />
F23<br />
F24<br />
F25
% Damage<br />
0.8<br />
0.6<br />
0.4<br />
0.2<br />
Figure 5. Glenn Puffer Trial<br />
Percent CM Damage at Harvest<br />
2005 2006<br />
0<br />
Vinas NE<br />
Vinas NW<br />
Vinas SE<br />
Vinas SW<br />
Tehamas<br />
W<br />
Tehamas<br />
E<br />
Chandlers<br />
W<br />
Chandlers<br />
E<br />
2.5<br />
2.0<br />
Figure 6. San Joaquin Puffer Trial<br />
Percent CM Damage at Harvest<br />
2005 2006<br />
1.5<br />
1.0<br />
0.5<br />
0.0<br />
F1 Tulare<br />
F2 Serr<br />
F3&20 Chandler<br />
F4 Chandler<br />
F7 Howard<br />
F8 Serr<br />
F8 Chandler<br />
F9 Serr<br />
F9 Chandler<br />
F10 Vina/Serr<br />
F12 Chandler<br />
F13 Chandler<br />
F14 & 15 Serr<br />
F18 Serr<br />
F19 Hartley<br />
F23 Howard<br />
F24 Vina<br />
F25 Chandler<br />
% Damage
Figure 7. Glenn Puffer Trial<br />
Total Trap Catches, Combo Lure<br />
Total Codling Moth<br />
300<br />
200<br />
100<br />
0<br />
2005 2006<br />
Vinas NE<br />
Vinas NW<br />
Vinas SE<br />
Vinas SW<br />
Tehamas<br />
W<br />
Tehamas<br />
E<br />
Chandlers<br />
W<br />
Chandlers<br />
E<br />
250<br />
200<br />
150<br />
100<br />
50<br />
Figure 8. San Joaquin Puffer Trial<br />
Total Trap Catches, Combo Lure<br />
0<br />
F1<br />
F2<br />
F3 & F20<br />
F4<br />
F5<br />
F6<br />
F7<br />
F8<br />
F9<br />
F10<br />
F12<br />
F13<br />
F14 & F15<br />
F18<br />
F19<br />
F22<br />
F23<br />
F24<br />
F25<br />
Total Codling Moth<br />
2005 2006
% Trap Shutdown<br />
120<br />
100<br />
80<br />
60<br />
40<br />
20<br />
0<br />
Figure 9. 2006 Percent Trap Shutdown<br />
in Hercon 1X-LOW Trap vs. Untreated<br />
86<br />
100<br />
98 100 97<br />
83<br />
Butte Tehama Glenn<br />
Untreated 1X-LOW<br />
Untreated Combo-HIGH<br />
Figure 10. First Hercon Application May 5, 2006<br />
Average Weekly Flakes on Plastic Sheets<br />
Average Flakes / Week<br />
80<br />
60<br />
Glenn Tehama<br />
40<br />
20<br />
0<br />
4/23 5/3 5/13 5/23 6/2 6/12 6/22 7/2 7/12
Figure 11. Second Hercon Application July 10, 2006<br />
Average Weekly Flakes on Plastic Sheets<br />
Average Flakes / Week<br />
80<br />
60<br />
Glenn Tehama Butte<br />
40<br />
20<br />
0<br />
7/2 7/12 7/22 8/1 8/11 8/21 8/31 9/10 9/20 9/30<br />
Figure 12. 2006 Percent CM Damage at<br />
Harvest (3 Hercon locations)<br />
1<br />
% Damage<br />
0.8<br />
0.6<br />
0.4<br />
0.4%<br />
0.8%<br />
0.7%<br />
0.2<br />
0<br />
Hercon Grower Standard Untreated Control