Working Paper No. 6 - Health Policy Project
Working Paper No. 6 - Health Policy Project
Working Paper No. 6 - Health Policy Project

You also want an ePaper? Increase the reach of your titles
YUMPU automatically turns print PDFs into web optimized ePapers that Google loves.
Methodology<br />
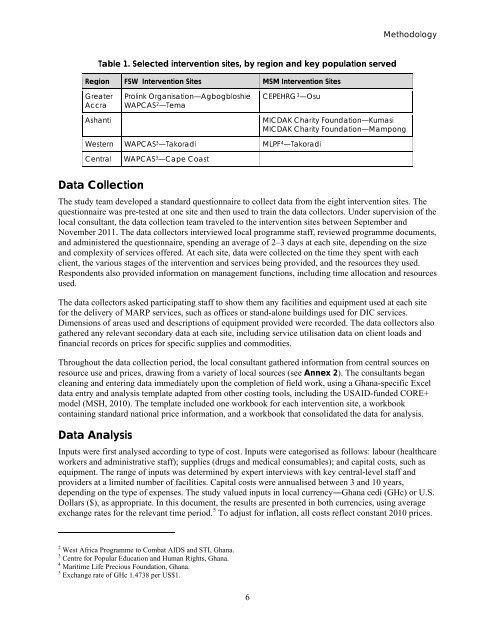
Table 1. Selected intervention sites, by region and key population served<br />
Region FSW Intervention Sites MSM Intervention Sites<br />
Greater<br />
Accra<br />
Ashanti<br />
Prolink Organisation—Agbogbloshie<br />
WAPCAS 2 —Tema<br />
CEPEHRG 3 —Osu<br />
MICDAK Charity Foundation—Kumasi<br />
MICDAK Charity Foundation—Mampong<br />
Western WAPCAS 3 —Takoradi MLPF 4 —Takoradi<br />
Central<br />
WAPCAS 3 —Cape Coast<br />
Data Collection<br />
The study team developed a standard questionnaire to collect data from the eight intervention sites. The<br />
questionnaire was pre-tested at one site and then used to train the data collectors. Under supervision of the<br />
local consultant, the data collection team traveled to the intervention sites between September and<br />
<strong>No</strong>vember 2011. The data collectors interviewed local programme staff, reviewed programme documents,<br />
and administered the questionnaire, spending an average of 2–3 days at each site, depending on the size<br />
and complexity of services offered. At each site, data were collected on the time they spent with each<br />
client, the various stages of the intervention and services being provided, and the resources they used.<br />
Respondents also provided information on management functions, including time allocation and resources<br />
used.<br />
The data collectors asked participating staff to show them any facilities and equipment used at each site<br />
for the delivery of MARP services, such as offices or stand-alone buildings used for DIC services.<br />
Dimensions of areas used and descriptions of equipment provided were recorded. The data collectors also<br />
gathered any relevant secondary data at each site, including service utilisation data on client loads and<br />
financial records on prices for specific supplies and commodities.<br />
Throughout the data collection period, the local consultant gathered information from central sources on<br />
resource use and prices, drawing from a variety of local sources (see Annex 2). The consultants began<br />
cleaning and entering data immediately upon the completion of field work, using a Ghana-specific Excel<br />
data entry and analysis template adapted from other costing tools, including the USAID-funded CORE+<br />
model (MSH, 2010). The template included one workbook for each intervention site, a workbook<br />
containing standard national price information, and a workbook that consolidated the data for analysis.<br />
Data Analysis<br />
Inputs were first analysed according to type of cost. Inputs were categorised as follows: labour (healthcare<br />
workers and administrative staff); supplies (drugs and medical consumables); and capital costs, such as<br />
equipment. The range of inputs was determined by expert interviews with key central-level staff and<br />
providers at a limited number of facilities. Capital costs were annualised between 3 and 10 years,<br />
depending on the type of expenses. The study valued inputs in local currency―Ghana cedi (GHc) or U.S.<br />
Dollars ($), as appropriate. In this document, the results are presented in both currencies, using average<br />
exchange rates for the relevant time period. 5 To adjust for inflation, all costs reflect constant 2010 prices.<br />
2 West Africa Programme to Combat AIDS and STI, Ghana.<br />
3 Centre for Popular Education and Human Rights, Ghana.<br />
4 Maritime Life Precious Foundation, Ghana.<br />
5 Exchange rate of GHc 1.4738 per US$1.<br />
6