Student Pyranometry - Institute for Earth Science Research and ...
Student Pyranometry - Institute for Earth Science Research and ...
Student Pyranometry - Institute for Earth Science Research and ...

You also want an ePaper? Increase the reach of your titles
YUMPU automatically turns print PDFs into web optimized ePapers that Google loves.
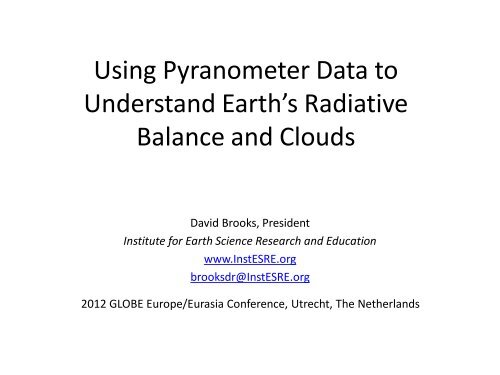
Using Pyranometer Data to<br />
Underst<strong>and</strong> <strong>Earth</strong>’s Radiative<br />
Balance <strong>and</strong> Clouds<br />
David Brooks, President<br />
<strong>Institute</strong> <strong>for</strong> <strong>Earth</strong> <strong>Science</strong> <strong>Research</strong> <strong>and</strong> Education<br />
www.InstESRE.org<br />
brooksdr@InstESRE.org<br />
2012 GLOBE Europe/Eurasia Conference, Utrecht, The Netherl<strong>and</strong>s
Topics <strong>for</strong> this presentation<br />
• What is a pyranometer<br />
• Using pyranometer data to underst<strong>and</strong><br />
climate <strong>and</strong> weather<br />
• Using insolation data to characterize clouds<br />
• Building your own pyranometer<br />
• Collecting insolation data<br />
• Other uses <strong>for</strong> pyranometers
What is a pyranometer<br />
• Pyranometers measure radiation reaching<br />
<strong>Earth</strong>’s surface from the sun, in units of<br />
W/m 2 .<br />
• <strong>Research</strong>-grade instruments use<br />
thermopile detectors (US$5,000-<br />
$10,000).<br />
• Pyranometers <strong>for</strong> routine monitoring use<br />
silicon photodetectors (commercial<br />
instruments in the range US$200-$500)<br />
• <strong>Student</strong>s can build their own very reliable<br />
silicon-based pyranometers <strong>for</strong> less than<br />
US$20 (more about that later!)
Pyranometers <strong>and</strong> <strong>Earth</strong>’s radiative balance<br />
Incoming<br />
from sun<br />
Outgoing from<br />
earth/atmosphere system<br />
• Solar radiation reaching <strong>Earth</strong> is reflected (30%) or<br />
absorbed (70%) by the atmosphere or surface.<br />
• The absorbed radiation is then re-radiated in the <strong>for</strong>m of<br />
longwave (thermal) radiation.<br />
• Solar energy is the driving <strong>for</strong>ce <strong>for</strong> creating <strong>and</strong><br />
maintaining <strong>Earth</strong>’s weather <strong>and</strong> climate.
Insolation data provide a window into weather <strong>and</strong><br />
seasonal changes<br />
Partly cloudy skies produce distinctive insolation patterns,<br />
depending on cloud type <strong>and</strong> amount.<br />
Cumulo<strong>for</strong>m clouds<br />
one-minute samples,<br />
Worcester, PA USA<br />
40ºN, 75ºW<br />
Clear<br />
Strati<strong>for</strong>m clouds
Insolation data, NOAA Climate Reference Network (CRN)<br />
One-hour averaged insolation at ~125 sites around the U.S. – mean,<br />
max, min, “st<strong>and</strong>ard deviation” (a measure of range during the hour,<br />
not a “statistical” st<strong>and</strong>ard deviation)<br />
Clear<br />
Overcast<br />
Overcast in the morning,<br />
Scattered cumulus around mid-day,<br />
overcast again in late afternoon<br />
Clear, with stratus<br />
around mid-day
The range <strong>and</strong> variability of insolation compared to a<br />
clear-sky model provides a window into cloud<br />
patterns
“Normalized”<br />
insolation data<br />
(observed/clear<br />
sky) provide a way<br />
to quantify cloud<br />
characteristics<br />
Examining subsets of the data<br />
provides insights into cloud<br />
characteristics.<br />
Mid-morning to<br />
mid-afternoon<br />
isolated Cu<br />
clear<br />
overcast
Contour plots characterize cloud characteristics at a<br />
particular site. Will these patterns change over time<br />
as a result of climate change<br />
All 2010 data<br />
(seasonal data<br />
are also of<br />
interest)<br />
overcast<br />
clear<br />
isolated Cu<br />
uni<strong>for</strong>m Ci<br />
(fog, high aerosol levels)
Build your own pyranometer<br />
A pyranometer requires just a few parts:<br />
* a silicon photodetector <strong>and</strong> housing<br />
* a “bullseye” level (bubble level)<br />
* a resistor to produce an output voltage<br />
proportional to incoming solar radiation<br />
* a case to hold the detector assembly<br />
* a cable to connect to a data logger<br />
The <strong>Institute</strong> <strong>for</strong> <strong>Earth</strong> <strong>Science</strong> <strong>Research</strong> <strong>and</strong><br />
Education has sold hundreds of pyranometers in<br />
kit <strong>for</strong>m (US$20) <strong>and</strong> assembled <strong>and</strong> calibrated.<br />
Kit-built pyranometers must be calibrated against<br />
a reliable st<strong>and</strong>ard or by using a clear-sky model<br />
over time. Once calibrated properly, these<br />
instruments will produce reliable data <strong>for</strong> years.<br />
The least expensive commercial silicon-based<br />
pyranometer costs about US$200.<br />
(See http://www.instesre.org/construction/pyranometer/pyranometer.htm
Calibrating IESRE pyranometers at the National Renewable<br />
Energy Laboratory, Golden, CO<br />
Commercial research-grade<br />
Pyranometers (~US$100,000)<br />
IESRE<br />
pyranometers
Establishing a site <strong>for</strong> collecting insolation data<br />
• Find a location where there is an unobstructed view of the horizon <strong>and</strong> where<br />
instruments are easy to access <strong>and</strong> will be safe from v<strong>and</strong>alism. (A flat school<br />
rooftop may be a good site <strong>for</strong> this measurement.)<br />
• Construct a plat<strong>for</strong>m where a pyranometer can be mounted horizontally. If<br />
possible, it is a good idea to have two pyranometers to protect against data<br />
gaps.<br />
• Connect the pyranometer(s) to a data logger in a nearby location that is also<br />
easily accessible. The data logger must be protected from moisture! It may be<br />
possible to use long cables that will reach through a window into a classroom.<br />
• Collect data at one-minute intervals. Download your data once a week <strong>and</strong><br />
send the files to a central collection site.<br />
• Analyze your data to make sure that equipment is working properly. (Use a<br />
clear-sky model as a reference against which to compare your data.)<br />
• You may wish to collect other meteorological data as well as sky photographs.<br />
(Use a convex mirror if you have one, to get images of the entire sky.)
What else can you do with a pyranometer<br />
• You can monitor the per<strong>for</strong>mance of solar photovoltaic <strong>and</strong> solar<br />
thermal systems.<br />
• With two pyranometers – one pointing up <strong>and</strong> one pointing down<br />
– you can measure surface reflectivity.<br />
• With a second detector – a physically identical near-IR version of<br />
the broadb<strong>and</strong> silicon photodiode – you can generate data related<br />
to the Normalized Difference Vegetation Index (NDVI).<br />
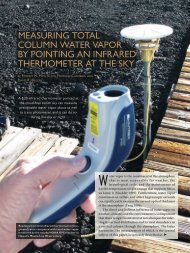
These measurements do not require an<br />
absolute radiometric calibration – only<br />
a relative calibration between pairs of<br />
detectors.
In conclusion…<br />
• <strong>Pyranometry</strong> is an ideal student measurement.<br />
• Once a monitoring site is established, data are easy<br />
to collect.<br />
• Underst<strong>and</strong>ing insolation data helps students<br />
underst<strong>and</strong> weather, seasons, <strong>and</strong> climate.<br />
• Reliable insolation data have considerable scientific<br />
value.<br />
• Insolation data are critical <strong>for</strong> underst<strong>and</strong>ing <strong>and</strong><br />
implementing renewable solar energy.