Annual Report - 2001 - ARC Resources Ltd.
Annual Report - 2001 - ARC Resources Ltd.
Annual Report - 2001 - ARC Resources Ltd.

You also want an ePaper? Increase the reach of your titles
YUMPU automatically turns print PDFs into web optimized ePapers that Google loves.
AR <strong>2001</strong> <strong>ARC</strong> ENERGY TRUST<br />
ANNUAL REPORT <strong>2001</strong>
WHY INVEST IN <strong>ARC</strong> ENERGY TRUST<br />
SINCE INCEPTION IN 1996 OUR STRATEGY HAS BEEN CLEAR AND CONSISTENT: TO UTILIZE OUR<br />
UNIQUE MANAGERIAL AND TECHNICAL EXPERTISE TO ACQUIRE AND DEVELOP QUALITY ASSETS IN<br />
THE CONTEXT OF AN ABSOLUTE COMMITMENT TO MAXIMIZE VALUE TO UNITHOLDERS.<br />
THROUGHOUT OUR SIX-YEAR HISTORY, AND THROUGH EVERY PHASE OF THE BUSINESS<br />
CYCLE, <strong>ARC</strong>’S MANAGEMENT TEAM HAS APPLIED ITS EXPERTISE TO CONSISTENTLY DELIVER<br />
SUPERIOR RETURNS. DURING <strong>2001</strong>, UNITHOLDERS REALIZED A TOTAL RETURN ON INVESTMENT<br />
(ROI) OF 28 PER CENT; IN 2000 WE DELIVERED A 55 PER CENT ROI. IN FACT, WE HAVE GENERATED<br />
A CUMULATIVE 172 PER CENT ROI OVER THE PAST SIX YEARS. WE HAVE CONSISTENTLY<br />
OUTPERFORMED OUR PEERS WITHIN THE ROYALTY TRUST SECTOR AS WELL AS THE TSE’S OIL AND<br />
GAS PRODUCERS INDEX.<br />
CAN <strong>ARC</strong> CONTINUE TO DELIVER THIS KIND OF OUTPERFORMANCE WE SAY YES. AN<br />
INVESTMENT IN <strong>ARC</strong> IS AN INVESTMENT IN A PORTFOLIO OF PREMIUM, LONG-LIFE ASSETS, ONE OF<br />
THE STRONGEST BALANCE SHEETS IN OUR SECTOR AND A MANAGEMENT TEAM WITH A PROVEN<br />
HISTORY OF GENERATING SUPERIOR RETURNS TO UNITHOLDERS. THIS STRATEGY HAS BUILT ONE OF<br />
CANADA’S LARGEST OIL AND GAS TRUSTS AND IT WILL CONTINUE TO DRIVE OUR PERFORMANCE IN<br />
THE FUTURE.<br />
CONTENTS P3 FEATURE: MANAGEMENT EXPERTISE<br />
*<br />
P13 FEATURE: QUALITY ASSETS * P17 OPERATIONS REVIEW *<br />
P32 ACQUISITIONS AND DIVESTMENTS P34 RESERVES P38<br />
*<br />
*<br />
*<br />
AND SAFETY<br />
P41 FEATURE: COMMITMENT<br />
*<br />
*<br />
AND ANALYSIS<br />
*<br />
P61 CONSOLIDATED FINANCIAL STATEMENTS P65<br />
*<br />
*<br />
STATEMENTS<br />
* P77 HISTORICAL REVIEW * P78 QUARTERLY REVIEW *<br />
OFFICERS<br />
* P82 CORPORATE GOVERNANCE *<br />
P7<br />
MESSAGE TO UNITHOLDERS<br />
P19 MAJOR PROPERTIES<br />
ENVIRONMENT, HEALTH<br />
P44 MANAGEMENT’S DISCUSSION<br />
P60 MANAGEMENT’S RESPONSIBILITY AND AUDITORS’ REPORT<br />
NOTES TO CONSOLIDATED FINANCIAL<br />
P79 DIRECTORS AND<br />
P84 CORPORATE AND UNITHOLDER INFORMATION
Photo: Drilling in the Drayton Valley area.
FINANCIAL HIGHLIGHTS<br />
Years ended December 31<br />
($ thousands, except per unit amounts) <strong>2001</strong> 2000 % Change<br />
INCOME STATEMENT<br />
Revenue before royalties 515,458 316,270 63<br />
Per unit 5.05 4.97 2<br />
Cash flow 260,270 179,349 45<br />
Per unit 2.55 2.82 (10)<br />
Net income 140,688 110,872 27<br />
Per unit 1.38 1.74 (21)<br />
Payout ratio (per cent) 90 72 25<br />
Cash distributions 234,053 128,958 81<br />
Per unit (1) 2.31 2.01 15<br />
Weighted average units outstanding (thousands) 101,979 63,681 60<br />
UNITS AND UNITS ASSOCIATED WITH<br />
EXCHANGEABLE SHARES OUTSTANDING<br />
AT YEAR-END 111,692 72,524 54<br />
BALANCE SHEET<br />
Working capital 5,805 6,339 (8)<br />
Property, plant, equipment and other assets 1,311,306 600,813 118<br />
Long-term debt 294,489 115,068 156<br />
Unitholders’ equity 818,175 482,255 70<br />
LONG-TERM DEBT AS A RATIO OF CASH FLOW 1.1 0.6 83<br />
MARKET CAPITALIZATION AS AT DECEMBER 31 1,350,950 819,521 65<br />
TOTAL CAPITALIZATION (2) 1,639,634 928,250 77<br />
TRUST UNIT TRADING (based on daily closing price)<br />
Prices ($)<br />
High 13.50 12.15 11<br />
Low 10.41 8.45 23<br />
Close 12.10 11.30 7<br />
Average daily volume (thousands) 414 155 167<br />
(1) Based on the number of units outstanding at each cash distribution date<br />
(2) Equity market capitalization plus net long-term debt
OPERATING HIGHLIGHTS<br />
Years ended December 31<br />
<strong>2001</strong> 2000 % Change<br />
PRODUCTION<br />
Crude oil (bbls/d) 20,408 11,528 77<br />
Natural gas (mmcf/d) 115.15 77.17 49<br />
Natural gas liquids (bbls/d) 3,511 2,965 18<br />
Total production (boe/d 6:1) 43,111 27,355 58<br />
TOTAL ANNUAL PRODUCTION (mboe) 15,736 10,011 58<br />
AS A PERCENTAGE OF<br />
TOTAL PRODUCTION<br />
Crude oil 47 42 5<br />
Natural gas 45 47 (2)<br />
Natural gas liquids 8 11 (3)<br />
AVERAGE PRICES<br />
Crude oil ($/bbl) 31.70 36.74 (14)<br />
Natural gas ($/mcf) 5.72 4.48 28<br />
Natural gas liquids ($/bbl) 31.03 31.52 (2)<br />
Oil equivalent ($/boe 6:1) 32.76 31.59 4<br />
RESERVES<br />
PROVED (mboe 6:1) 147,739 108,437 36<br />
PROVED PLUS RISKED PROBABLE<br />
Crude oil and natural gas liquids (mbbls) 114,243 82,419 39<br />
Natural gas (bcf) 385.5 286.4 35<br />
TOTAL OIL EQUIVALENT (mboe 6:1) 178,496 130,147 37<br />
OPERATING COSTS<br />
Total ($ thousands) 86,108 49,268 75<br />
Per boe ($) 5.47 4.92 11<br />
GENERAL & ADMINISTRATIVE COSTS<br />
Total ($ thousands) 11,812 6,956 70<br />
Per boe ($) 0.75 0.69 9<br />
FINDING, DEVELOPMENT &<br />
ACQUISITION COSTS (1)<br />
Per boe ($) 9.75 5.16 89<br />
Three-year average ($/boe) 6.94 4.95 40<br />
(1) Established reserves<br />
CONVERSION: Natural gas is converted to barrels of oil equivalent at 6:1 throughout this document unless otherwise noted.
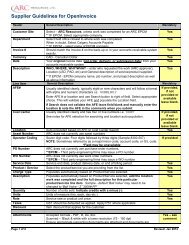
FINDING,DEVELOPMENT AND ACQUISITION COSTS<br />
($/boe three-year average for established reserves)<br />
RECYCLE RATIO<br />
(Current netback/three-year average FD&A for established reserves)<br />
CASH FLOW<br />
($ millions)<br />
01<br />
01<br />
01<br />
00<br />
00<br />
00<br />
99<br />
99<br />
99<br />
98<br />
98<br />
98<br />
97<br />
1.75 3.50 5.25 7.00<br />
97<br />
1.05 2.10 3.15 4.20<br />
97<br />
70 140 210 280<br />
PRODUCTION<br />
MANAGEMENT AND<br />
COST CONTROL<br />
INCREASE<br />
IN<br />
RESERVES<br />
DEVELOPMENT<br />
ACTIVITIES<br />
The <strong>ARC</strong> business model –<br />
INCREASE IN<br />
PRODUCTION<br />
VOLUMES<br />
a strategy for success<br />
NEW<br />
ACQUISITIONS<br />
CAPITAL FOR<br />
REINVESTMENT<br />
CASH<br />
FLOW<br />
COMMODITY PRICES<br />
AND US/CDN<br />
EXCHANGE RATES<br />
EXTERNAL<br />
CAPITAL<br />
CASH<br />
DISTRIBUTIONS<br />
TO UNITHOLDERS<br />
RECLAMATION<br />
FUND<br />
UNIT MARKET PRICE<br />
($/unit at December 31)<br />
CASH DISTRIBUTIONS<br />
($/unit)<br />
TOTAL CAPITALIZATION<br />
($ billions)<br />
01<br />
00<br />
99<br />
98<br />
97<br />
3.25 6.50 9.75 13.00<br />
01<br />
00<br />
99<br />
98<br />
97<br />
0.60 1.20 1.80 2.40<br />
01<br />
00<br />
99<br />
98<br />
97<br />
0.50 1.00 1.50 2.00
AT THE TIME OF OUR INITIAL PUBLIC OFFERING IN 1996, WE IDENTIFIED<br />
THREE CRITERIA FOR SUCCESS WHICH WE BELIEVED WOULD<br />
GENERATE SUPERIOR UNITHOLDER RETURNS. THESE CRITERIA<br />
REMAIN UNCHANGED AS WE MOVE FORWARD. OUR SUPERIOR RESULTS<br />
TO DATE CONFIRM OUR SUCCESS IN PURSUING THIS STRATEGY.<br />
MANAGEMENT EXPERTISE Excellence in management in the royalty trust sector<br />
requires a unique blend of financial acumen and oil and gas technical expertise. At <strong>ARC</strong>, we<br />
have systematically built a team of individuals who are leaders in these two areas of competency.<br />
This team has established a reputation for translating its expertise into measurable<br />
results: well-structured acquisitions have turned into value-added opportunities; innovative<br />
financial policies have allowed <strong>ARC</strong> to excel through all phases of the business cycle; and our<br />
technical competence has made a strong contribution to our return on investment. The key<br />
measurement of <strong>ARC</strong>’s management expertise is the consistent superior returns which have<br />
been delivered to unitholders.<br />
QUALITY ASSETS We have established a portfolio of high quality assets through a series<br />
of strategic acquisitions. We are disciplined about the quality and characteristics of assets that<br />
we acquire. <strong>ARC</strong>’s ability to identify quality acquisitions is enhanced by our association with<br />
<strong>ARC</strong> Financial Corporation, a leading private equity investor in the Canadian oil and gas industry.<br />
Through this relationship, we are uniquely positioned to identify and pursue acquisition<br />
opportunities. Once we acquire an asset, our work has just begun. <strong>ARC</strong>’s technical teams add<br />
value by optimizing production and increasing reserves through low risk development activities.<br />
The success of their efforts can be seen by the low cost of production and reserve additions<br />
since inception.<br />
COMMITMENT TO STAKEHOLDER INTERESTS <strong>ARC</strong> is committed to serving<br />
the best interests of all stakeholders including landowners, governments, our communities,<br />
and, of course, our unitholders. <strong>ARC</strong> believes that its decisions must be anchored in serving<br />
the interests of its stakeholders. That is the challenge – and mandate – for every employee at<br />
<strong>ARC</strong>. When it comes to our unitholders, generating superior returns is a universal commitment<br />
across the company. It drives our dedication to management expertise and our focus on acquiring<br />
and developing quality assets. Our decisions are driven by an absolute commitment to<br />
maximize distributions and long-term value to our unitholders.
PAGE 3<br />
FEATURE:<br />
management expertise<br />
AN INNOVATIVE ACQUISITION –<br />
AND A NEW BUSINESS MODEL FOR THE INDUSTRY<br />
ANY ACQUISITION IS A COMPLEX PROCESS, BUT THE STARTECH ENERGY INC.<br />
(STARTECH) ACQUISITION COMPLETED IN JANUARY <strong>2001</strong> REQUIRED A UNIQUELY<br />
STRUCTURED SOLUTION THAT ACCESSED MANY ELEMENTS OF <strong>ARC</strong>’S EXPERTISE.<br />
AS A ROYALTY TRUST, WE DO NOT EXPLORE FOR OIL AND GAS; THE RISK IS TOO<br />
HIGH. OUR MANDATE IS TO GENERATE A SUPERIOR RETURN ON INVESTMENT SO<br />
OUR DEVELOPMENT PROGRAMS ARE LIMITED TO LOW RISK ACTIVITIES THAT<br />
HAVE A HIGHER PROBABILITY OF ADDING VALUE. AS AN EXPLORATION AND<br />
PRODUCTION COMPANY, STARTECH HAD SIGNIFICANT EXPLORATION PLAYS. THE<br />
CHALLENGE WAS HOW TO CREATE A WIN/WIN SCENARIO – FOR <strong>ARC</strong> AND OUR<br />
UNITHOLDERS AND STARTECH AND ITS SHAREHOLDERS.
PAGE 4<br />
FEATURE: MANAGEMENT EXPERTISE<br />
A UNIQUE TRANSACTION<br />
IN 2000, WE IDENTIFIED STARTECH AS AN ATTRACTIVE ACQUISITION<br />
OPPORTUNITY. THE COMPANY HAD HIGH QUALITY PROPERTIES WITH WELL<br />
DEFINED SYNERGIES WITH OUR EXISTING LANDHOLDINGS. HOWEVER, WE WERE<br />
UNWILLING TO PURCHASE STARTECH’S HIGHER-RISK EXPLORATION PLAYS<br />
WHICH FELL OUTSIDE OF OUR INVESTMENT CRITERIA.<br />
WE APPROACHED STARTECH’S MANAGEMENT WITH A UNIQUE PROPOSITION. <strong>ARC</strong><br />
WOULD ACQUIRE THE COMPANY, BUT THE ASSETS WOULD BE SPLIT. THE HIGHER-<br />
RISK EXPLORATION PLAYS WOULD GO TO A NEW COMPANY TO BE HELD BY<br />
STARTECH’S EXISTING SHAREHOLDERS. WE WOULD TAKE CONTROL OF STARTECH’S<br />
PRODUCING PROPERTIES, INCLUDING THE RESERVES AND ADJACENT UNDEVELOPED<br />
LANDS. THE OFFER WAS PARTICULARLY ATTRACTIVE AS IT CREATED A WIN/WIN<br />
SCENARIO FOR ALL PARTIES. STARTECH SHAREHOLDERS WOULD KEEP THE<br />
EXPLORATION UPSIDE, WHILE <strong>ARC</strong> WOULD ACQUIRE A LARGE BASE OF PRODUCTION,<br />
RESERVES AND UNDEVELOPED LANDS UNDER ATTRACTIVE TERMS FOR OUR<br />
UNITHOLDERS.<br />
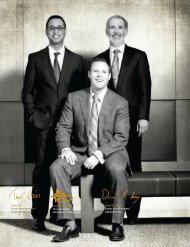
Photo: Susan Healy, Doug Bonner, John Dielwart, David Carey, Steve Sinclair, Myron Stadnyk<br />
<strong>ARC</strong> ENERGY TRUST AR <strong>2001</strong>
PAGE 5<br />
FEATURE: MANAGEMENT EXPERTISE<br />
EXPERTISE THAT SETS NEW STANDARDS<br />
THE STARTECH ACQUISITION CLOSED IN JANUARY <strong>2001</strong>, BUT ONLY AFTER<br />
RELYING ON MANY MEMBERS OF THE <strong>ARC</strong> TEAM AND THEIR THINKING-OUT-OF-<br />
THE-BOX EXPERTISE. <strong>ARC</strong>’S KNOWLEDGE OF THE OIL AND GAS INDUSTRY WAS<br />
CRITICAL IN IDENTIFYING STARTECH AS A CLOSE FIT TO OUR EXISTING<br />
OPERATIONS AND ASSET BASE.<br />
CONSIDERABLE FINANCIAL ACUMEN WAS NEEDED TO STRUCTURE AND NEGOTIATE<br />
SUCH A UNIQUE TRANSACTION – AND TO ENSURE THAT ALL PARTIES WERE FAIRLY<br />
COMPENSATED. THE TRANSACTION IS ALSO A SNAPSHOT OF <strong>ARC</strong>’S WILLINGNESS TO<br />
COOPERATE WITH ITS PEERS TO MAXIMIZE VALUE FOR ALL INVESTORS. PERHAPS THE<br />
GREATEST ACKNOWLEDGEMENT TO <strong>ARC</strong>’S EXPERTISE HAS COME FROM THE<br />
INDUSTRY ITSELF. THE STRUCTURE OF THE STARTECH ACQUISITION HAS BECOME A<br />
BUSINESS MODEL, STUDIED AND COPIED BY OTHER COMPANIES LOOKING FOR AN<br />
INNOVATIVE SOLUTION TO A COMPLEX ISSUE.<br />
Top: Charlene Bagu, Ed Fong, Van Dafoe, Niki Cote<br />
Bottom: Dan Geremia, Lloyd Martin, Lougheed Gas Plant<br />
<strong>ARC</strong> ENERGY TRUST AR <strong>2001</strong>
John P. Dielwart<br />
Director, President<br />
and Chief Executive Officer<br />
Mac H. Van Wielingen<br />
Director and Vice-Chairman<br />
“<strong>ARC</strong> Energy Trust (our top pick in <strong>2001</strong>) continues<br />
to top this list as a very well run company, with the<br />
best expected <strong>2001</strong> recycle ratio (over two times)<br />
and the highest percentage of 2002 oil and gas<br />
hedged of the large cap trusts.”<br />
STEVE LARKE, ANALYST, TD NEWCREST, JANUARY 2002
PAGE 7<br />
MESSAGE TO UNITHOLDERS<br />
MESSAGE TO UNITHOLDERS<br />
ONCE AGAIN, WE HAVE<br />
excellent<br />
RESULTS<br />
FOR <strong>2001</strong>, OUR SIXTH YEAR OF OPERATION, PARTICULARLY IN<br />
DELIVERING<br />
superior returns TO OUR UNITHOLDERS.<br />
Total cash distributions increased 81 per cent to $234 million. On a per unit<br />
basis, cash distributions increased 15 per cent to $2.31, the highest in our history.<br />
Cumulative distributions to December 31, <strong>2001</strong> totalled $9.08, which represents 91 per<br />
cent of our initial public offering price of $10.00 per unit.<br />
Behind these superior returns were activities to position <strong>ARC</strong> for further strong<br />
performance. Through the Startech acquisition in January and a Trust unit offering in<br />
November, we increased the units outstanding by about 50 per cent to 111.7 million.<br />
Funds from the November equity offering were used to reduce debt and to establish a<br />
source of capital for future development expenditures. The benefits of the Startech<br />
acquisition are evident in the Trust’s significant operational growth. Overall production<br />
increased 58 per cent during the year and total oil equivalent reserves were up 37 per<br />
cent. There is more to come. We believe the assets acquired will provide significant<br />
additional reserve additions in 2002 and beyond.<br />
OPPORTUNITIES IN THE NEW INDUSTRY ENVIRONMENT<br />
The past year saw many changes within the oil and gas industry. The<br />
beginning of the year saw high commodity prices and aggressive spending on mergers<br />
and acquisitions by the energy sector followed by a transition to lower commodity prices<br />
and a reduction in capital expenditures. As a result, a number of interesting events and<br />
trends have emerged that will affect the industry going forward.<br />
<strong>ARC</strong> ENERGY TRUST AR <strong>2001</strong>
PAGE 8<br />
MESSAGE TO UNITHOLDERS<br />
We have witnessed dramatic consolidation in the industry, with a significant<br />
reduction in the number of active companies, particularly the so-called “intermediates”<br />
and “seniors” which are loosely categorized as those companies producing 25,000<br />
to 100,000 barrels of oil equivalent per day. The companies sold in <strong>2001</strong> have<br />
been acquired by many organizations, a number of them US-based companies with<br />
global assets.<br />
The consolidation of so many Canadian operating companies has produced a<br />
new wave of asset sales as companies are evaluating recently acquired assets and are<br />
rationalizing their property portfolios. We believe this will lead to significant new<br />
acquisition opportunities for <strong>ARC</strong>. With such opportunities in sight, there is growing<br />
investor interest in the royalty trust sector. We see another factor behind this trend of<br />
increasing favour of royalty trusts – the benefits to investors from the trust structure. <strong>ARC</strong>’s<br />
28 per cent total return on investment for <strong>2001</strong> is superior to many alternative investment<br />
vehicles. In fact, based on the Trust’s formula for success – superior financial and<br />
operating expertise; acquiring high quality assets; applying technical expertise to<br />
maximize production and cash flow – the result has been superior rates of return since<br />
inception in 1996.<br />
At this point in time, the level and stability of returns provided by <strong>ARC</strong> is<br />
proving to be attractive to existing and new unitholders alike. Looking forward, however,<br />
the test is not what we have done, but what we will do. We want to share with you our<br />
plans for continuing this superior performance.<br />
TURN STRATEGIC ANALYSIS INTO ACTION<br />
Commodity price volatility is an enduring industry condition. At inception,<br />
<strong>ARC</strong> resolved to provide superior long-term returns to investors and <strong>ARC</strong> management<br />
also identified the need to stabilize distributions and enhance the ability to capture<br />
opportunities throughout all phases of the business cycle. It was for this reason that we<br />
have always withheld a portion of our cash flow for reinvestment in our business. In 2000,<br />
we revised our distribution policy to withhold up to 20 per cent of cash flow for<br />
reinvestment. This allows us to maintain more stable distributions during all phases of the<br />
commodity price cycle, facilitate opportunistic and accretive acquisitions and maintain a<br />
strong balance sheet.<br />
<strong>ARC</strong> ENERGY TRUST AR <strong>2001</strong>
PAGE 9<br />
MESSAGE TO UNITHOLDERS<br />
Commodity price volatility will continue and it appears that cycles will be<br />
shorter with higher peaks and lower valleys. Managing effectively in this environment<br />
requires an in-depth understanding of both commodity and financial markets and a<br />
proven analytical and decision making capability.<br />
BUILD A TEAM OF EXCELLENT PEOPLE<br />
Put simply, we apply <strong>ARC</strong>’s expertise to transform quality assets into value for<br />
our unitholders. We have developed a highly effective team of geologists, geophysicists,<br />
engineers, landmen, accountants and business experts to identify and evaluate<br />
opportunities and optimize every property we operate. We believe good people make<br />
good decisions, so we set out to hire and retain the best people in our business. Our<br />
ability to tap into the advice and expertise at <strong>ARC</strong> Financial Corporation lends depth and<br />
insight to our financial decision-making. Since 1994, <strong>ARC</strong> Financial Group, which<br />
encompasses <strong>ARC</strong> <strong>Resources</strong> Management <strong>Ltd</strong>., the manager of the<br />
Trust, and <strong>ARC</strong> Financial Corporation, has been cited as one of<br />
Canada’s 50 Best Managed Private Companies based on an annual<br />
comprehensive survey led by Arthur Andersen LLP and sponsored by<br />
CIBC World Markets, Queen’s School of Business and the National Post.<br />
ACQUISITIONS MUST MEET THE TEST<br />
To maximize unitholder value, we look for high quality producing properties<br />
with upside reserve potential. Ideal characteristics include high netbacks, extensive<br />
production histories to reduce technical risk and low decline rates which translates into<br />
more stable distributions. To further reduce risk, we have assembled a diverse portfolio of<br />
assets to ensure that no one property accounts for a significant portion of reserves<br />
or value.<br />
The key criteria for ongoing success is low finding, development and<br />
acquisition costs for high netback properties which translates into a high recycle ratio.<br />
Since inception, our FD&A costs have been among the lowest in the industry and our<br />
recycle ratio among the highest. Our <strong>2001</strong> FD&A costs of $9.75 were high relative to our<br />
execeptionally low inception to date costs of $6.32/boe. Our acquisition criteria have not<br />
changed, the increased FD&A costs reflect the relatively higher commodity price<br />
<strong>ARC</strong> ENERGY TRUST AR <strong>2001</strong>
PAGE 10<br />
MESSAGE TO UNITHOLDERS<br />
environment which is expected to prevail in the future. The costs in <strong>2001</strong> also reflect a<br />
higher component of capital expenditures directed to converting reserves from<br />
undeveloped to producing. Given the variability which can exist in annual FD&A costs,<br />
three-year rolling average costs are considered more representative of our ongoing cost<br />
structure. At $6.94/boe, our three-year average FD&A costs remain among the lowest in<br />
the industry while our recycle ratio remains among the highest.<br />
The Startech acquisition in <strong>2001</strong> has been our most significant transaction to<br />
date. This acquisition provided <strong>ARC</strong> with complementary oil and gas assets, as well as a<br />
significant entry into several new core areas. More importantly, this transaction was<br />
completed early in the cycle of corporate acquisitions before the market became<br />
expensive later in the year. Rather than participate in the overheated acquisition market<br />
during the balance of <strong>2001</strong>, <strong>ARC</strong> focused on the acquisition and consolidation of smaller<br />
interests in existing assets, integrating the Startech assets and identifying development<br />
opportunities on existing lands to maximize long-term value.<br />
Looking forward, we believe the opportunity for new acquisitions has never<br />
been brighter. The consolidation of our industry during 2000 and <strong>2001</strong> was, in many<br />
cases, driven by the desire to expand natural gas asset portfolios. Today, many of these<br />
companies are left with a material component of assets that are not core to their longerterm<br />
strategy and some are dealing with weak balance sheets in the lower end of the<br />
commodity price cycle. This should result in major near-term property dispositions,<br />
particularly of oil assets. While we strive for a relatively balanced commodity exposure,<br />
we have a technical bias to crude oil assets, as the reserves tend to demonstrate a longer<br />
reserve life and long-term reserve upside. Therefore, we expect significant opportunities<br />
to develop to acquire attractive assets in this new wave of rationalization activity.<br />
“We view the $500 million acquisition of Startech Energy<br />
by <strong>ARC</strong> Energy Trust in January as perhaps the<br />
smartest corporate transaction completed within the<br />
Royalty Trust sector in <strong>2001</strong>.”<br />
BRIAN ECTOR, ANALYST, SCOTIA CAPITAL EQUITY RESE<strong>ARC</strong>H, SEPTEMBER <strong>2001</strong><br />
<strong>ARC</strong> ENERGY TRUST AR <strong>2001</strong>
PAGE 11<br />
MESSAGE TO UNITHOLDERS<br />
OPTIMIZE ASSETS TO MAXIMIZE ECONOMIC RETURNS<br />
It is not enough to acquire the best possible asset for the best possible price;<br />
that is just the beginning. Once a property has been integrated into our portfolio, our team<br />
focuses on optimizing its value on a continual basis. While the tools we use are unique to<br />
each property or process, our methodology is always the same. We identify the challenge<br />
or opportunity, we assemble a team of experts to determine the most economic solution<br />
and then we implement that solution as cost effectively and efficiently as possible.<br />
Part of our optimization strategy involves vigilant cost control. In evaluating<br />
acquisition opportunities, we assess operating costs. We look for synergistic<br />
opportunities as our large operating base creates economies of scale to enhance cost<br />
control and improve netbacks. Typically, as a property matures and its remaining reserve<br />
life declines, operating costs on a per unit of production basis escalate. Our minor<br />
property disposition program works to identify properties with high costs and limited<br />
upside and targets these for disposition. In fact, every asset in our portfolio is reviewed<br />
annually to determine its continuing fit in our asset portfolio. As properties decline in<br />
value, they become candidates for disposition.<br />
Our management team works to reduce commodity price risk by maintaining a<br />
portfolio of sales contracts with diverse counterparties and different terms of varying<br />
duration. Depending on the relative strength or weakness of commodity prices, we seek<br />
to protect prices on up to 50 per cent of our production. Our objective is to manage risk<br />
and ensure a more stable, predictable stream of revenue.<br />
EVALUATE ALL DECISIONS BASED ON DELIVERING UNITHOLDER VALUE<br />
Our objective is as clear today as it was on July 11, 1996 when <strong>ARC</strong> was<br />
established: we are resolved to be the top performing, highest return conventional oil and<br />
gas royalty trust in Canada. To achieve that goal, we recognize the need for deliberate<br />
and disciplined decision-making at all levels of the organization. We attempt to make<br />
every decision add value over the long term, from hiring new staff to evaluating<br />
acquisition opportunities.<br />
Photo: Jan Young, Jay Billesberger, Lou Barron<br />
<strong>ARC</strong> ENERGY TRUST AR <strong>2001</strong>
PAGE 12<br />
MESSAGE TO UNITHOLDERS<br />
We recognize the true measure of our success is long-term, consistent,<br />
superior returns to unitholders. As a result of our corporate-wide focus on this<br />
commitment, <strong>ARC</strong> has delivered superior performance in every year since our inception.<br />
We have recorded six consecutive years of strong results consistently outperforming our<br />
peers in the royalty trust sector, the TSE’s Oil and Gas Producers Index and the TSE 300<br />
Index. Throughout every phase of the commodity price cycle, <strong>ARC</strong> has thrived, providing<br />
unitholders with returns averaging 15 per cent per year for those unitholders receiving<br />
cash distrubutions and returns exceeding 20 per cent per year for investors enrolled in<br />
the Distribution Reinvestment Plan.<br />
As one of Canada’s top performing royalty trusts, our resolve to deliver value<br />
to unitholders is as strong today as it was at our inception. Our industry has changed<br />
considerably over the past six years, but our goal has not. It has been proven in our<br />
results over the past six years and how <strong>ARC</strong> applies its expertise – in the success of our<br />
distribution policy, the quality of our acquisitions and in our ability to consistently<br />
transform potential into value. We remain absolutely committed to continuing our superior<br />
performance.<br />
Respectfully submitted on behalf of the Board of Directors,<br />
MAC H. VAN WIELINGEN<br />
Director and Vice-Chairman<br />
JOHN P. DIELWART<br />
Director, President and Chief Executive Officer<br />
February 25, 2002<br />
“<strong>ARC</strong> appears to have been anointed as the – ‘new market<br />
darling’ … a title <strong>ARC</strong> worked hard to earn. For investors<br />
looking for a –“safe trust” – in a difficult environment, <strong>ARC</strong><br />
is a great choice.”<br />
DIRK LEVER, ANALYST, NATIONAL BANK FINANCIAL, DECEMBER <strong>2001</strong><br />
<strong>ARC</strong> ENERGY TRUST AR <strong>2001</strong>
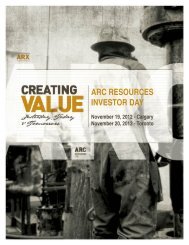
FEATURE:<br />
quality assets<br />
ANTE CREEK, A NEW PROPERTY –<br />
BUT HOW BEST TO TAP THE UNDEFINED POTENTIAL<br />
IN M<strong>ARC</strong>H 2000, <strong>ARC</strong> ACQUIRED AN INTEREST IN THE PARTIALLY DEVELOPED<br />
ANTE CREEK PROPERTY WHICH PRESENTED UNIQUE CHALLENGES COMPARED<br />
TO MOST OF THE TRUST’S OTHER ASSETS. THE FIELD IS RELATIVELY IMMATURE,<br />
PROVIDING MANY DEVELOPMENT POSSIBILITIES. THE OPPORTUNITY LAY IN THE<br />
DEVELOPMENT AND EXECUTION OF A PLAN TO CAPTURE THE FULL UPSIDE<br />
POTENTIAL OF THIS ASSET.
PAGE 14<br />
FEATURE: QUALITY ASSETS<br />
A CLOSE-UP ANALYSIS<br />
SUBSEQUENT TO ACQUIRING THE PROPERTY, <strong>ARC</strong> COMPLETED A DETAILED<br />
TECHNICAL REVIEW. SEVEN MONTHS AFTER GAINING OPERATORSHIP, <strong>ARC</strong><br />
COMMENCED DRILLING THE FIRST OF SEVEN DEVELOPMENT WELLS. EACH WELL<br />
WAS SUCCESSFUL AND, MORE IMPORTANTLY, THE RESULTS CONFIRMED <strong>ARC</strong>’S<br />
EXPECTATIONS, WHICH LED TO PLANS FOR ADDITIONAL PHASES<br />
OF DEVELOPMENT.<br />
WITH NEW INFORMATION GAINED FROM THE SUCCESS OF THE INITIAL DRILLING<br />
PROGRAM, WORK CONTINUED ON REFINING THE MAPPING OF THE RESERVOIR.<br />
WHILE THE TECHNICAL TEAM WAS ASSESSING THE AREA’S ULTIMATE POTENTIAL, THE<br />
PROPERTY’S PRODUCTION INCREASED AS A RESULT OF THE RECENTLY DRILLED<br />
WELLS. HIGHER GAS PRODUCTION RESULTED FROM THE EASING OF FACILITY<br />
CONSTRAINTS THROUGH ADDITIONAL COMPRESSION.<br />
Group: Scott Reynolds, Bruce Hall, Brad Wilson<br />
Inset: Diana Meads<br />
<strong>ARC</strong> ENERGY TRUST AR <strong>2001</strong>
PAGE 15<br />
FEATURE: QUALITY ASSETS<br />
THE DEVELOPMENT PLAN<br />
THE TEAM DESIGNED AND EXECUTED A SUCCESSFUL SECOND PHASE OF<br />
DEVELOPMENT WHICH INCLUDED AN ADDITIONAL SEVEN WELLS. DRILLING AT<br />
ANTE CREEK IS CONTINUING TO DELINEATE THE MONTNEY RESERVOIR. IN<br />
ADDITION, A PILOT WATERFLOOD IS PLANNED WHICH IS ANTICIPATED TO<br />
IMPROVE ULTIMATE RECOVERY FROM THE POOL AND MATERIALLY INCREASE<br />
REMAINING RESERVES.<br />
CRUDE OIL PRODUCTION<br />
(bbl/d)<br />
1500<br />
<strong>ARC</strong> acquires<br />
property<br />
Development<br />
program initiated<br />
Base decline<br />
1200<br />
900<br />
600<br />
300<br />
0<br />
Jan<br />
99<br />
Jul<br />
99<br />
Jan<br />
00<br />
Jul<br />
00<br />
Jan<br />
01<br />
Jul<br />
01<br />
Dec<br />
01<br />
THE DEVELOPMENT PLAN IS IN PLACE, BUT IT IS ALWAYS BEING REFINED AS<br />
NEW RESERVOIR INFORMATION BECOMES AVAILABLE AND NEW TECHNOLOGY<br />
AND TECHNIQUES PROVE TO BE THE BEST SOLUTION FOR UNLOCKING THE<br />
RESERVE POTENTIAL.<br />
<strong>ARC</strong> ENERGY TRUST AR <strong>2001</strong>
Top: Deanna Kalenchuk, Wayne Lentz, Cory Stewart<br />
Middle: Jocelyn Ford, Lorna Nelson<br />
Bottom: Lougheed Gas Plant, Laura Lockhart
PAGE 17<br />
OPERATIONS REVIEW<br />
OPERATIONS REVIEW<br />
DURING <strong>2001</strong>, <strong>ARC</strong> CONTINUED WITH ONE OF THE MOST ACTIVE DEVELOPMENT<br />
AND EXPLOITATION PROGRAMS IN THE ROYALTY TRUST SECTOR. AS PART OF<br />
THIS THRUST TO ADD VALUE THROUGH INTERNAL TECHNICAL EXPERTISE, KEY<br />
PEOPLE WERE ADDED IN SUCH AREAS AS GEOLOGY, GEOPHYSICS, FACILITIES<br />
DESIGN AND ENVIRONMENTAL CONTROL.<br />
In <strong>2001</strong>, <strong>ARC</strong> replaced 407 per cent of production at a net effective cost of<br />
$9.75/boe. Since inception, <strong>ARC</strong>’s aggregate finding, development and acquisition cost<br />
has averaged $6.32/boe. The Startech acquisition in January <strong>2001</strong> significantly increased<br />
<strong>ARC</strong>’s production volumes and expanded the opportunity base in existing areas of<br />
operation and in new areas that <strong>ARC</strong> had targeted for development.<br />
Production volumes for <strong>2001</strong> increased 58 per cent to 43,111 boe/d. Natural<br />
gas volumes grew 49 per cent to 115 mmcf/d; oil production increased 77 per cent to<br />
20,408 bbl/d while production of natural gas liquids grew 18 per cent to 3,511 bbl/d.<br />
Total capital expenditures for <strong>2001</strong> rose significantly to $102 million from $54<br />
million in 2000. The major focus of expenditures was continued development on <strong>ARC</strong>’s<br />
assets along with the pursuit of new opportunities on the Startech properties once they<br />
were assimilated and technically reviewed.<br />
COST CONTROL<br />
As always, cost control was a primary focus of operations during <strong>2001</strong>.<br />
Rigorous attention was paid to tracking, reviewing and reducing operating expenses<br />
wherever possible which resulted in operating costs of $5.47/boe. Although operating<br />
costs were up 11 per cent for the year, the increase was due almost exclusively to<br />
increased power costs. All other costs were held firm or declined for the year.<br />
<strong>ARC</strong> ENERGY TRUST AR <strong>2001</strong>
PAGE 18<br />
OPERATIONS REVIEW<br />
DEVELOPMENT PROGRAM – <strong>ARC</strong> OPERATED PROPERTIES<br />
<strong>ARC</strong> successfully drilled 115 operated wells in <strong>2001</strong> with an equal focus on oil<br />
and gas production. The main areas for drilling were Ante Creek with 15 oil wells and<br />
southeast Alberta with 60 shallow gas and 10 oil wells. Another active area was southeast<br />
Saskatchewan where 16 oil wells were drilled and increased utilization of horizontal<br />
drilling technology led to increases in production and reserves. Drilling programs also<br />
continued at Pembina and at Sundre in Central Alberta, while waterflood optimization took<br />
place in several <strong>ARC</strong>-operated areas.<br />
<strong>2001</strong><br />
Established Total Average Total Lifting<br />
Reserves Reserves Production Production Netback Costs<br />
(mboe) (%) (boe/d) (%) ($/boe) ($/boe)<br />
Northern Alberta & BC 48,072 27 10,106 23 22.13 4.82<br />
Ante Creek 14,190 8 1,927 5 22.85 2.73<br />
Dunvegan Gas Unit No. 1 4,565 3 643 2 20.51 2.09<br />
House Mountain Unit No. 1 2,470 1 430 1 26.21 5.97<br />
Pembina 29,875 17 8,696 20 19.93 6.82<br />
MIPA 12,682 7 1,758 4 22.16 11.33<br />
Berrymoor Cardium Unit 5,585 3 659 2 24.03 7.32<br />
Lindale Cardium Unit 3,102 2 581 1 24.18 8.14<br />
Central Alberta 27,609 16 7,122 17 19.45 5.82<br />
Sundre 7,186 4 1,278 3 16.30 8.90<br />
East Garrington 3,414 2 877 2 21.59 3.72<br />
Caroline Swan Hills Unit No. 1 3,200 2 1,445 3 19.42 3.22<br />
Caroline Cardium E Pool Unit 2,248 1 657 2 19.53 7.82<br />
Southeast Alberta &<br />
Southwest Saskatchewan 28,672 16 7,950 18 20.50 4.80<br />
Jenner 12,703 7 2,584 6 21.49 6.21<br />
Brooks 6,751 4 2,350 6 23.01 2.89<br />
Southeast Saskatchewan 44,267 25 9,237 21 17.71 4.80<br />
Lougheed 10,492 6 3,111 7 17.54 2.90<br />
Weyburn Unit 9,931 6 1,448 3 19.36 3.64<br />
Midale Unit 6,654 4 985 2 22.21 1.49<br />
Total 178,496 43,111 20.15 5.47<br />
<strong>ARC</strong>’s established reserve life index is 11.5 years.<br />
<strong>ARC</strong> ENERGY TRUST AR <strong>2001</strong>
MAJOR PROPERTIES<br />
BRITISH COLUMBIA ALBERTA SASKATCHEWAN<br />
Edmonton<br />
Calgary<br />
Regina<br />
QUALITY ASSETS ARE THE BACKBONE OF <strong>ARC</strong>’S SUCCESS. PRIOR TO ACQUISITION, PROPERTIES MUST MEET<br />
SPECIFIC CHARACTERISTICS TO ENSURE A STRONG FIT WITHIN THE TRUST’S ASSET PORTFOLIO. ONCE<br />
ACQUIRED, <strong>ARC</strong>’S TECHNICAL TEAMS BEGIN WORK ON ASSIMILATION OF A PROPERTY – APPLYING TECHNICAL<br />
EXPERTISE TO IMPROVE PRODUCTION, INCREASE RESERVES THROUGH LOW RISK DEVELOPMENT ACTIVITIES<br />
AND REDUCE COSTS. THE RESULT IS A GROUP OF STRONG FOCUS AREAS CHARACTERIZED BY STABLE<br />
PRODUCTION, A PORTFOLIO OF LONG-LIFE RESERVES BALANCED BETWEEN OIL AND GAS WITH LOW<br />
OPERATING COSTS AND HIGH NETBACKS.<br />
n<br />
Northern Alberta & B.C.<br />
Ante Creek<br />
Dunvegan<br />
House Mountain<br />
n<br />
Pembina<br />
Berrymoor<br />
Lindale<br />
MIPA<br />
n<br />
Central Alberta<br />
Caroline<br />
East Garrington<br />
Sundre<br />
n<br />
Southeast Alberta &<br />
Southwest Saskatchewan<br />
Brooks<br />
Jenner<br />
n<br />
Southeast Saskatchewan<br />
Lougheed<br />
Midale<br />
Weyburn
PAGE 20<br />
MAJOR PROPERTIES<br />
NORTHERN ALBERTA & B.C.<br />
NORTHERN ALBERTA AND B.C. IS <strong>ARC</strong>’S LARGEST FOCUS AREA AND IS LOCATED<br />
IN ONE OF THE MOST ACTIVE OIL AND GAS AREAS IN CANADA. THE AREA<br />
BECAME A MAJOR GROWTH CENTER IN 2000 WITH THE ACQUISITION OF<br />
PRODUCING ASSETS AT SWAN HILLS AND ANTE CREEK. THE AREA IS A PRIME<br />
TRUST ASSET DUE TO THE RELATIVELY LOW-RISK DRILLING TARGETS, LOW<br />
OPERATING COSTS, HIGH NETBACKS AND A DIVERSE BASE OF OPERATED AND<br />
NON-OPERATED ASSETS. THE PLAYS DEVELOPED BY THE <strong>ARC</strong> TECHNICAL TEAM<br />
ALSO BENEFIT FROM THE STRENGTHS AND SYNERGIES OF THE TRUST’S<br />
PARTNERS IN NON-OPERATED PROPERTIES.<br />
CORE PROPERTIES<br />
ANTE CREEK<br />
<strong>ARC</strong> owns an average working interest of 92 per cent in 19,360 gross acres in<br />
the partially developed Ante Creek Montney A pool, which produces sweet light crude oil.<br />
In <strong>2001</strong>, <strong>ARC</strong> recorded 100 per cent drilling success in a three-phase development<br />
program that saw 15 wells drilled. Seven oil wells were drilled and tied-in early in<br />
<strong>2001</strong>, followed by a second seven-well phase at mid-year. The first of six wells planned<br />
for the third phase of the program was drilled in late <strong>2001</strong> and the program continued<br />
in 2002. Future development will also include production of a well defined gas cap.<br />
DUNVEGAN GAS UNIT NO. 1<br />
Through the Startech acquisition in <strong>2001</strong>, <strong>ARC</strong> increased its working interest in<br />
this natural gas unit to 5.1 per cent. The Dunvegan field was discovered in the early<br />
1970s, and remains a hub of development activity. A total of 18 development wells and<br />
recompletions were undertaken in <strong>2001</strong>, resulting in net production of 643 boe/d to <strong>ARC</strong>.<br />
Development drilling is expected to continue in 2002.<br />
HOUSE MOUNTAIN UNIT NO. 1<br />
<strong>ARC</strong> owns a 9.2 per cent working interest in this light crude oil unit in the<br />
Beaverhill Lake formation operated by Apache Canada <strong>Ltd</strong>. <strong>ARC</strong>’s share of net<br />
production was 430 boe/d in <strong>2001</strong> following a program of horizontal re-entry drilling and<br />
waterflood optimization. Development activities are continuing in 2002 and will include<br />
further horizontal re-entry drilling, well re-activations, fracture stimulations and further<br />
waterflood optimization.<br />
<strong>ARC</strong> ENERGY TRUST AR <strong>2001</strong>
Dunvegan<br />
House Mountain<br />
Ante Creek<br />
ANTE CREEK<br />
T68<br />
R24W5<br />
HOUSE MOUNTAIN<br />
DUNVEGAN<br />
<br />
<br />
<br />
T70<br />
T81<br />
<br />
<br />
<br />
R10W5<br />
R4W6<br />
<strong>ARC</strong> non-unit lands Unit outline <strong>ARC</strong> production facility <strong>2001</strong> oil wells <br />
<strong>2001</strong> gas wells
PAGE 22<br />
MAJOR PROPERTIES<br />
PEMBINA<br />
PEMBINA WAS <strong>ARC</strong>’S FIRST FOCUS AREA AND IT CONTINUES TO POSSESS THE<br />
CHARACTERISTICS OF A STRONG TRUST ASSET — A MATURE PRODUCTION BASE<br />
OF HIGH QUALITY SWEET OIL AND AN ECONOMIC RESERVE LIFE IN EXCESS OF 50<br />
YEARS. MOST OF THE PROPERTIES ARE UNDER WATERFLOOD, WHICH<br />
CONTRIBUTES TO HIGH ULTIMATE RESERVE RECOVERY, STABLE PRODUCTION<br />
RATES AND SHALLOW PRODUCTION DECLINES.<br />
CORE PROPERTIES<br />
MIPA<br />
Through a series of acquisitions, <strong>ARC</strong> now holds close to a 100 per cent<br />
working interest in the MIPA producing properties. Development activity during the year<br />
focused on maintaining production through a well optimization program, improving water<br />
injection support and reducing operating expenses. These efforts will continue in 2002<br />
along with further detailed engineering and geological work to identify drilling and<br />
recompletion opportunities. Net production to <strong>ARC</strong> is 1,758 boe/d.<br />
BERRYMOOR CARDIUM UNIT<br />
<strong>ARC</strong> owns a 41.3 per cent working interest in the Berrymoor Cardium Unit<br />
which is operated by Imperial Oil. The unit produces high quality 40° API crude oil from<br />
the Cardium formation and is under waterflood. <strong>ARC</strong>’s net production from the unit is 659<br />
boe/d. <strong>Annual</strong> oil well and injection well workover/stimulation programs are scheduled to<br />
maintain production and injection rates.<br />
LINDALE CARDIUM UNIT<br />
With its 53.8 per cent working interest, <strong>ARC</strong> operates the Lindale Cardium Unit.<br />
The property includes 84 producing Cardium oil wells on 13,760 gross acres which are<br />
under waterflood. In <strong>2001</strong>, five successful wells were drilled, eight existing wells were<br />
refractured and two wells were converted to water injection wells. In addition, solution gas<br />
compression was added to lower the gathering system pressure and increase production.<br />
Development plans for 2002 include identification of further drilling and stimulation<br />
opportunities and expansion of the waterflood to support increased production. This area<br />
contributes 581 boe/d of production to <strong>ARC</strong>.<br />
<strong>ARC</strong> ENERGY TRUST AR <strong>2001</strong>
Pembina<br />
PEMBINA<br />
Berrymoor<br />
T50<br />
Lindale<br />
MIPA<br />
T48<br />
T46<br />
R10<br />
R8<br />
R6W5<br />
Photo: Pembina, Bill Turko, Pembina Drilling, Jason Kaluski<br />
<strong>ARC</strong> non-unit lands Unit outline <strong>ARC</strong> production facility <strong>2001</strong> oil wells
PAGE 24<br />
MAJOR PROPERTIES<br />
CENTRAL ALBERTA<br />
CENTRAL ALBERTA IS COMPRISED OF SEVERAL ADJACENT FIELDS PRODUCING<br />
FROM A VARIETY OF GEOLOGICAL HORIZONS CONTAINING A STRONG INVENTORY<br />
OF DEVELOPMENT PROSPECTS. <strong>ARC</strong>’S CENTRAL ALBERTA ASSETS CONTINUE TO<br />
PERFORM WELL AND PROVIDE A STEADY BASE OF BOTH OIL AND GAS<br />
PRODUCTION FOR THE TRUST.<br />
CORE PROPERTIES<br />
SUNDRE ELKTON UNITS<br />
The Sundre Rundle B Unit and Sundre Unit No.1 are both operated by <strong>ARC</strong><br />
with an average working interest of 75 per cent. These units produce oil from the Elkton<br />
formation, have been under waterflood since the 1960s and contribute net production of<br />
1,278 boe/d to the Trust.<br />
During <strong>2001</strong>, a 3-D seismic program was completed and interpreted, which<br />
has led to a revised geological interpretation and allowed further optimization of the<br />
waterfloods. Production was enhanced through stimulations, pump upgrades and well<br />
workovers. In addition, the first horizontal re-entry well drilled in eight years was brought<br />
on production and was stabilized at a rate of 80 boe/d.<br />
EAST GARRINGTON<br />
East Garrington produces sweet, liquids-rich gas and sweet light crude oil from<br />
the Mannville and Cardium formations. <strong>ARC</strong> operates production in the area, with an<br />
average working interest of 90 per cent. Net production volume to <strong>ARC</strong> is 877 boe/d.<br />
CAROLINE SWAN HILLS BEAVERHILL LAKE UNIT NO. 1<br />
Shell Canada <strong>Ltd</strong>. operates this major natural gas unit. <strong>ARC</strong>’s working interest<br />
of 2.2 per cent contributes 1,445 boe/d net to <strong>ARC</strong>. Gas production was maintained in<br />
<strong>2001</strong> and the gas plant was kept at capacity through facility modifications and the<br />
completion and tie-in of a prolific natural gas well that was drilled in late 2000. Gas<br />
production should be maintained through 2002, as plans call for the drilling of one<br />
additional well in the unit.<br />
CAROLINE CARDIUM E POOL SOUTH UNIT<br />
This property is operated by <strong>ARC</strong> and produces light sweet crude oil with<br />
associated gas and liquids. <strong>ARC</strong> has over a 94 per cent working interest and net<br />
production amounts to 657 boe/d. A fracture stimulation program has increased net<br />
production to its highest level since 1997.<br />
<strong>ARC</strong> ENERGY TRUST AR <strong>2001</strong>
Caroline<br />
Garrington<br />
Sundre<br />
CENTRAL ALBERTA<br />
Caroline<br />
Swan Hills<br />
T35<br />
East Garrington<br />
Caroline<br />
Cardium<br />
Sundre<br />
Elkton Units<br />
T33<br />
R6W5<br />
R4W5<br />
Photos: John McMullen, Sundre Battery, Doris Ivers, Jan Thue<br />
<strong>ARC</strong> non-unit lands Unit outline <strong>ARC</strong> production facility <strong>2001</strong> oil wells
PAGE 26<br />
MAJOR PROPERTIES<br />
SOUTHEAST ALBERTA & SOUTHWEST SASKATCHEWAN<br />
DEVELOPMENT IN THIS FOCUS AREA BEGAN IN 1999 WITH THE ACQUISITION OF<br />
THE JENNER SHALLOW GAS ASSETS, WHICH ARE IDEAL FOR A TRUST. <strong>ARC</strong>’S<br />
PROPERTIES CONTAIN LOW RISK AND LOW OPERATING COST OPPORTUNITIES IN<br />
SWEET GAS FIELDS. THERE IS ALSO A WELL-DEVELOPED INFRASTRUCTURE AND<br />
EASY ACCESS TO PIPELINE TRANSPORTATION. WITH THE <strong>2001</strong> ACQUISITION OF<br />
THE BROOKS FIELD FROM STARTECH, THIS AREA HAS RAPIDLY GROWN INTO THE<br />
FOURTH LARGEST PRODUCTION AREA IN <strong>ARC</strong>’S PORTFOLIO. THE BROOKS AREA<br />
COMPLEMENTS THE EXISTING JENNER SWEET SHALLOW GAS FIELDS;<br />
COLLECTIVELY, THESE AREAS PRODUCE 30 MMCF/D.<br />
CORE PROPERTIES<br />
JENNER<br />
Jenner is the Trust’s second largest producing property with daily production<br />
volumes now exceeding 16 mmcf/d from 800 producing gas wells. <strong>ARC</strong> holds an average<br />
working interest of 90 per cent in this area.<br />
During <strong>2001</strong>, 36 shallow gas infill wells were drilled on 80-acre spacing. The<br />
wells were completed and brought on production in the fourth quarter, adding a total of<br />
3 mmcf/d. This volume filled unutilized capacity in existing infrastructure. In 2002, <strong>ARC</strong><br />
plans to drill additional 80-acre infill wells and will continue to incorporate deeper targets<br />
within its shallow gas drilling programs.<br />
BROOKS<br />
The Brooks shallow gas field is the Trust’s third largest production area at<br />
14 mmcf/d. <strong>ARC</strong> operates with an average 92 per cent working interest in the area.<br />
Activity in <strong>2001</strong> centered on a farm-in agreement which has given <strong>ARC</strong> the rights to<br />
deeper horizons below its existing shallow gas holdings. In addition, <strong>ARC</strong> shot and<br />
interpreted six square miles of seismic and drilled four deeper wells. The number of farmin<br />
wells drilled now totals six, with five new pool discoveries earning six sections of deeper<br />
rights. Gas production from these six wells currently exceeds 2 mmcf/d. <strong>ARC</strong> has the<br />
option to continue drilling to earn deep rights until May 2002.<br />
<strong>ARC</strong> ENERGY TRUST AR <strong>2001</strong>
Jenner<br />
Brooks<br />
JENNER<br />
<br />
T23<br />
<br />
<br />
<br />
<br />
<br />
<br />
<br />
<br />
<br />
<br />
<br />
<br />
<br />
<br />
<br />
<br />
T21<br />
R13W4<br />
R11W4<br />
R9W4<br />
BROOKS<br />
T19<br />
<br />
<br />
<br />
<br />
<br />
Dave Hudson<br />
Pat Mills<br />
Terry Anderson<br />
R14W4<br />
<strong>ARC</strong> non-unit lands Unit outline <strong>ARC</strong> production facility <br />
<strong>2001</strong> gas wells
PAGE 28<br />
MAJOR PROPERTIES<br />
SOUTHEAST SASKATCHEWAN<br />
AFTER SEVERAL YEARS OF PROGRESSIVELY BUILDING TECHNICAL KNOWLEDGE<br />
THROUGH OWNERSHIP IN PARTNER-OPERATED ASSETS, THE STARTECH<br />
ACQUISITION IN <strong>2001</strong> PROVIDED <strong>ARC</strong> A MAJOR STRATEGIC ENTRY AND<br />
SIGNIFICANT PRESENCE IN SOUTHEAST SASKATCHEWAN. THESE PROPERTIES<br />
PROVIDED <strong>ARC</strong> WITH NUMEROUS DEVELOPMENT OPPORTUNITIES DURING <strong>2001</strong>.<br />
<strong>ARC</strong> NOW OPERATES A SIGNIFICANT PORTFOLIO OF HIGH QUALITY, LOW<br />
OPERATING COST OIL PRODUCING PROPERTIES IN THIS AREA.<br />
CORE PROPERTIES<br />
LOUGHEED<br />
The Lougheed area has become the Trust’s highest volume producing property<br />
at net 3,111 boe/d and a major focus of development activity. The Trust has a high<br />
working interest in the area, including 98.6 per cent in the <strong>ARC</strong>-operated Lougheed Unit.<br />
The past year saw the drilling of six operated and six non-operated joint<br />
interest horizontal wells. A gas plant was also built which will add significant value via<br />
liquids recovery from rich solution gas. In addition to development work, <strong>ARC</strong>’s growth<br />
strategy for the area resulted in several minor acquisitions and swaps to consolidate<br />
working interests and gain additional interests in operated lands.<br />
The Trust believes there is significant upside potential at Lougheed and is<br />
conducting a full field reservoir simulation in an effort to increase recovery through the<br />
improvement and implementation of a full waterflood. The current recovery factor<br />
recognized by <strong>ARC</strong>’s independent engineers is 24 per cent as compared to 36 and<br />
41 per cent for the adjacent Midale and Weyburn units, respectively. Based upon<br />
comparable reservoir characteristics relative to Weyburn and Midale, significant<br />
additional reserves are expected to be realized at Lougheed.<br />
MIDALE UNIT<br />
<strong>ARC</strong> is now the second largest working interest owner in the Midale Unit at<br />
15.5 per cent with net production volumes of 985 boe/d to <strong>ARC</strong>. Operated by Apache<br />
Canada <strong>Ltd</strong>., activities have focused on development and horizontal drilling to enhance<br />
the performance of the waterflood. Drilling of infill development wells continued in <strong>2001</strong><br />
along with monitoring and optimization of the waterflood.<br />
<strong>ARC</strong> ENERGY TRUST AR <strong>2001</strong>
Midale<br />
Weyburn<br />
Lougheed<br />
LOUGHEED<br />
T6<br />
R14W2<br />
MIDALE<br />
T6<br />
Yvan Chretien<br />
Dave Vogelsang<br />
Dave Sorkilmo<br />
R11W2<br />
<strong>ARC</strong> non-unit lands Unit outline <strong>ARC</strong> production facility <strong>2001</strong> oil wells
PAGE 30<br />
MAJOR PROPERTIES<br />
WEYBURN UNIT<br />
<strong>ARC</strong> is the third largest working interest owner in the Weyburn Unit, which is<br />
operated by PanCanadian Petroleum <strong>Ltd</strong>. In <strong>2001</strong>, through the Startech acquisition, <strong>ARC</strong><br />
increased its interest to 6.5 per cent, which nets a production volume to <strong>ARC</strong> of 1,448 boe/d.<br />
The operator recently initiated a large-scale CO 2 tertiary recovery scheme in<br />
one area of this large field to augment an extisting waterflood program. Optimization of<br />
the waterflood has continued, including infill drilling to improve waterflood and CO 2 flood<br />
production and recoveries. PanCanadian will continue to monitor the performance of the<br />
flood, adjust injection practices and drill additional infill wells in 2002. The success of the<br />
CO 2 recovery scheme is expected to lead to further phases of tertiary recovery in this<br />
large field.<br />
SOUTHEAST SASKATCHEWAN – OTHER PROPERTIES<br />
<strong>ARC</strong> currently produces 3,693 boe/d from other southeast Saskatchewan<br />
properties. Alida and Queensdale are representative of several smaller properties that<br />
produce high quality 30° to 42° API crude oil from various formations. <strong>ARC</strong> drilled eight<br />
horizontal wells on a number of properties in southeast Saskatchewan in <strong>2001</strong> with a<br />
100 per cent success rate. These new wells added 900 bbl/d to <strong>ARC</strong>’s production in<br />
<strong>2001</strong>. <strong>ARC</strong>’s working interests in the new wells range from 50 to 100 per cent.<br />
<strong>ARC</strong> ENERGY TRUST AR <strong>2001</strong>
Midale<br />
Weyburn<br />
Lougheed<br />
WEYBURN<br />
T6<br />
R13W2<br />
ALIDA<br />
QUEENSDALE<br />
T5<br />
T6<br />
R33W1<br />
R1W2<br />
<strong>ARC</strong> non-unit lands Unit outline <strong>ARC</strong> production facility <strong>2001</strong> oil wells
PAGE 32<br />
ACQUISITIONS AND DIVESTMENTS<br />
ACQUISITIONS AND DIVESTMENTS<br />
STARTECH ACQUISITION<br />
The acquisition of Startech Energy Inc. completed in January <strong>2001</strong> was the<br />
largest acquisition in <strong>ARC</strong>’s history and one that has provided tremendous new<br />
opportunities in pre-existing and new focus areas. <strong>ARC</strong>’s daily production volumes<br />
increased by 58 per cent and significant reserves and undeveloped land were added to<br />
the Trust’s portfolio. Of particular importance was Startech’s major presence in southeast<br />
Saskatchewan, an area that <strong>ARC</strong> had targeted as a strategic area for expansion. The<br />
acquisition enabled <strong>ARC</strong> to gain a major foothold in this area, create an important new<br />
focus area and acquire a portfolio of development opportunities.<br />
OTHER ACQUISITIONS<br />
As the cost of acquiring reserves and production increased over the remainder<br />
of <strong>2001</strong>, <strong>ARC</strong> focused on having the individual area teams seek opportunities within core<br />
areas to acquire land and reserves at lower prices. Focused acquisitions in core areas<br />
resulted in an additional 4.2 mmboe being purchased for $29.9 million.<br />
DISPOSITIONS<br />
Every year, <strong>ARC</strong> reviews its asset base to identify non-core assets for potential<br />
disposition. Divested properties typically have higher operating costs, lower netbacks,<br />
limited upside potential or marginal remaining reserve life that can create a near-term<br />
abandonment liability.<br />
As part of <strong>ARC</strong>’s active management of its asset base, a number of minor<br />
non-core assets were sold in <strong>2001</strong> resulting in the disposition of 3.4 mmboe of reserves<br />
for $21 million.<br />
<strong>2001</strong> Acquisition/Disposition Summary<br />
Reserve<br />
Production<br />
Purchase/Sale Established Purchase/Sale Production Purchase/Sale Reserve<br />
Price Reserves Price Rate Price Life Index<br />
($ millions) (mmboe) ($/boe) (boe/d) ($/boe/d) (years)<br />
Acquisitions 544.0 59.16 $ 9.20 15,539 $ 35,009 10.4<br />
Dispositions (21.3) (3.40) $ 6.26 (1,024) $ 20,801 9.1<br />
Net acquisitions 522.7 55.76 $ 9.37 14,515 $ 36,011 10.5<br />
<strong>ARC</strong> ENERGY TRUST AR <strong>2001</strong>
PAGE 33<br />
ACQUISITIONS AND DIVESTMENTS<br />
Summary of Finding, Development and Acquisition Costs<br />
($ thousands) <strong>2001</strong> 2000 1999 1998 1997 1996<br />
Total capital expenditures 624,877 207,917 255,731 10,595 102,717 207,433<br />
Net change in established reserves<br />
after production 48,344 30,268 44,528 (1,722) 15,892 41,181<br />
<strong>Annual</strong> production 15,736 10,012 8,093 4,649 4,375 1,751<br />
<strong>Annual</strong> reserve additions 64,080 40,280 52,621 2,927 20,267 42,932<br />
<strong>Annual</strong> finding, development and<br />
acquisition costs ($/boe) 9.75 5.16 4.86 3.62 5.07 4.83<br />
Three year rolling average 6.94 4.95 4.87 4.85 4.91 4.83<br />
Cumulative since inception 6.32 4.93 4.85 4.85 4.91 4.83<br />
<strong>ARC</strong>’s <strong>2001</strong> overall finding, development and acquisition costs were<br />
$9.75/boe, an increase from $5.16 in 2000.<br />
Not unexpectedly, the costs to acquire oil and gas assets increased with the<br />
strengthening in commodity prices. <strong>ARC</strong>’s purchase of Startech and other assets<br />
continued to meet all of our stringent acquisition criteria. On a three-year average basis,<br />
<strong>ARC</strong>’s FD&A costs increased to $6.94/boe in <strong>2001</strong>.<br />
On both an annual and three-year average basis, <strong>ARC</strong> expects its FD&A costs<br />
to remain among the lowest for both royalty trusts and conventional E&P companies.<br />
THE ACQUISITION OF STARTECH ENERGY COMPLETED IN JANUARY <strong>2001</strong> WAS THE<br />
largest acquisition<br />
IN<br />
<strong>ARC</strong>’s HISTORY AND ONE THAT HAS PROVIDED<br />
TREMENDOUS new opportunities FOR THE TRUST.<br />
<strong>ARC</strong> ENERGY TRUST AR <strong>2001</strong>
PAGE 34<br />
RESERVES<br />
RESERVES<br />
Based on an independent engineering evaluation conducted by Gilbert<br />
Laustsen Jung Associates <strong>Ltd</strong>. (GLJ) effective December 31, <strong>2001</strong>, <strong>ARC</strong> had proved plus<br />
risked probable reserves of 386 bcf of natural gas and 114 mmbbls of crude oil and natural<br />
gas liquids. Approximately 64 per cent of <strong>ARC</strong>’s reserves are crude oil and natural gas<br />
liquids and 36 per cent are natural gas on a 6:1 boe conversion basis. Total reserves at<br />
December 31, <strong>2001</strong> were 178.5 mmboe, an increase of 37 per cent from the previous year.<br />
The following tables summarize <strong>ARC</strong>’s reserves of natural gas, crude oil, and<br />
natural gas liquids as evaluated by GLJ. These reserves reflect <strong>ARC</strong>’s interest before<br />
royalties. Probable reserves are risked at 50 per cent to calculate the established<br />
reserves. All estimates of future net cash flow in these tables are calculated without any<br />
provision for income taxes, general and administrative costs, or management fees, but<br />
include provisions for future well abandonment liabilities.<br />
Reserve Life Index (RLI) is calculated by dividing the reserves by annual<br />
production (either current year annual production or the independent evaluator’s forecast<br />
of the first year’s production). This provides a simplified representation of the number of<br />
years of reserves remaining if production remained constant. The actual productive life of<br />
the reserves is significantly longer due to a declining production rate over time. To<br />
account for the impact and timing of acquisition and divestment activity, the tables use<br />
the independent evaluator’s forecast of the first year’s production in determining RLI, as<br />
this results in a more consistent representation over time.<br />
<strong>ARC</strong> ENERGY TRUST AR <strong>2001</strong>
PAGE 35<br />
RESERVES<br />
Reserves Summary and Reserve Life Index<br />
December 31 <strong>2001</strong> 2000 1999 1998 1997<br />
Crude Oil<br />
Proved producing (mbbl) 68,408 46,075 32,454 20,090 18,554<br />
Proved non-producing (mbbl) 14,287 12,438 7,541 2,677 394<br />
Total proved (mbbl) 82,695 58,513 39,995 22,767 18,948<br />
Proved reserve life index (years) 11.2 12.3 12.1 12.1 11.3<br />
Established (mbbl) 102,632 71,663 50,245 27,896 24,155<br />
Established reserve life index (years) 13.5 14.7 14.8 14.8 14.5<br />
Natural Gas Liquids<br />
Proved producing (mbbl) 8,823 8,175 7,774 6,066 6,956<br />
Proved non-producing (mbbl) 1,139 1,137 389 475 500<br />
Total proved (mbbl) 9,962 9,311 8,163 6,542 7,459<br />
Proved reserve life index (years) 8.3 8.6 8.1 8.7 8.8<br />
Established (mbbl) 11,611 10,753 9,467 7,138 8,218<br />
Established reserve life index (years) 9.5 9.7 9.2 9.5 9.7<br />
Natural Gas<br />
Proved producing (bcf) 279.5 202.4 184.2 83.9 97.9<br />
Proved non-producing (bcf) 51.0 41.3 19.7 19.7 29.8<br />
Total proved (bcf) 330.5 243.7 203.9 103.6 127.7<br />
Proved reserve life index (years) 8.5 8.8 7.4 7.2 7.9<br />
Established (bcf) 385.5 286.4 241.0 121.9 148.2<br />
Established reserve life index (years) 9.6 10.0 9.0 8.5 8.6<br />
Oil Equivalent (6:1)<br />
Proved producing (mboe) 123,810 87,987 70,928 40,139 41,827<br />
Proved non-producing (mboe) 23,929 20,450 11,213 6,435 5,861<br />
Total proved (mboe) 147,739 108,437 82,141 46,576 47,690<br />
Proved reserve life index (years) 9.8 10.4 10.1 10.0 10.9<br />
Established (mboe) 178,496 130,147 99,879 55,351 57,073<br />
Established reserve life index (years) 11.5 12.1 12.0 11.9 13.0<br />
Reserve life index is calculated using independent evaluator's forecast of production. Established = proved plus 50 per cent probable.<br />
Pricing Assumptions (1)<br />
Year WTI Crude Oil Edmonton Crude Oil (2) Natural Gas (3)<br />
($US/bbl) ($Cdn/bbl) ($Cdn/mmbtu)<br />
2002 20.00 30.75 3.95<br />
2003 21.00 31.25 4.35<br />
2004 21.00 30.50 4.45<br />
2005 21.00 29.50 4.50<br />
2006 21.25 29.50 4.50<br />
2007 21.75 30.00 4.50<br />
2008 22.00 30.50 4.50<br />
2009 22.25 31.00 4.55<br />
2010 22.50 31.50 4.60<br />
2011 23.00 32.00 4.70<br />
2012 23.25 32.50 4.75<br />
Thereafter 1.5%/yr 1.5%/yr 1.5%/yr<br />
(1) GLJ’s January 1, 2002 price forecast<br />
(2) Edmonton Refinery Postings for 40° API, 0.3 per cent sulphur content crude<br />
(3) Average Alberta plantgate price<br />
<strong>ARC</strong> ENERGY TRUST AR <strong>2001</strong>
PAGE 36<br />
RESERVES<br />
Reserves Reconciliation<br />
Crude Oil Natural Gas Natural Gas Liquids Total<br />
(mbbl) (bcf) (mbbl) (mboe)<br />
Risked Risked Risked Risked<br />
Proved Probable Proved Probable Proved Probable Proved Probable<br />
Reserves at December 31, 1996 10,729 3,418 100.5 11.5 7,687 680 35,166 6,015<br />
Acquisitions and divestments 7,961 1,552 38.8 10.3 1,104 232 15,532 3,501<br />
Drilling and development 176 13 4.7 0.3 49 5 1,008 68<br />
Production (1,334) – (14.0) – (704) – (4,371) –<br />
Revisions 1,416 224 (2.3) (1.6) (677) (158) 355 (201)<br />
Reserves at December 31, 1997 18,948 5,207 127.7 20.5 7,459 759 47,690 9,383<br />
Acquisitions and divestments 2,465 648 (15.1) (2.7) (195) (36) (247) 162<br />
Drilling and development 981 844 4.0 1.2 7 (104) 1,655 940<br />
Production (1,620) – (13.8) – (737) – (4,657) –<br />
Revisions 1,993 (1,570) 0.8 (0.6) 8 (23) 2,134 (1,693)<br />
Reserves at December 31, 1998 22,767 5,129 103.6 18.4 6,542 596 46,576 8,792<br />
Acquisitions and divestments 17,769 4,286 118.0 15.4 3,375 476 40,817 7,320<br />
Drilling and development 1,992 631 5.8 1.7 204 1 3,168 912<br />
Production (3,069) – (24.3) – (981) – (8,100) –<br />
Revisions 536 204 0.7 1.7 (977) 232 (320) 713<br />
Reserves at December 31, 1999 39,995 10,250 203.9 37.1 8,163 1,304 82,141 17,737<br />
Acquisitions and divestments 18,650 3,860 47.7 8.0 1,911 328 28,517 5,527<br />
Drilling and development 2,283 (693) 12.9 1.3 119 (25) 4,556 (497)<br />
Production (4,219) – (28.2) – (1,085) – (10,012) –<br />
Revisions 1,805 (268) 7.4 (3.8) 203 (166) 3,235 (1,057)<br />
Reserves at December 31, 2000 58,513 13,149 243.7 42.7 9,311 1,442 108,437 21,710<br />
Acquisitions and divestments 27,932 7,124 101.9 11.1 1,643 241 46,551 9,211<br />
Drilling and development 2,641 275 12.7 3.1 437 81 5,191 865<br />
Production (7,449) – (42.0) – (1,282) – (15,736) –<br />
Revisions 1,057 (610) 14.3 (1.8) (148) (117) 3,295 (1,029)<br />
Reserves at December 31, <strong>2001</strong> 82,695 19,937 330.5 55.0 9,962 1,649 147,739 30,757<br />
Present Value of Reserves<br />
($ thousands before income taxes) <strong>2001</strong> 2000<br />
Discount Factor 10% 12% 15% 10% 12% 15%<br />
Proved producing 955,706 886,964 803,266 732,530 685,315 626,836<br />
Proved non-producing 111,778 96,477 78,222 100,389 86,651 70,391<br />
Total proved 1,067,484 983,441 881,488 832,918 771,966 697,227<br />
Risked probable 148,509 126,642 102,463 111,886 96,105 78,461<br />
Established 1,215,993 1,110,083 983,951 944,804 868,071 775,688<br />
<strong>ARC</strong> ENERGY TRUST AR <strong>2001</strong>
PAGE 37<br />
RESERVES<br />
Net Asset Value<br />
($thousands, except per unit amounts)<br />
December 31 <strong>2001</strong> 2000 1999 1998<br />
Discount Factor 10% 12% 10% 12% 10% 12% 10% 12%<br />
Value of established oil<br />
and gas reserves 1,215,993 1,110,083 944,804 868,071 530,400 484,309 278,353 253,529<br />
Add: Undeveloped lands 22,293 22,293 5,698 5,698 11,994 11,994 2,655 2,655<br />
Working capital 5,805 5,805 6,339 6,339 15,761 15,761 (1,688) (1,688)<br />
Reclamation fund 10,147 10,147 9,897 9,897 7,165 7,165 4,504 4,504<br />
Deduct: Debt (294,489) (294,489) (115,068) (115,068) (141,000) (141,000) (72,499) (72,499)<br />
Net asset value 959,749 853,839 851,670 774,937 424,320 378,229 211,325 186,501<br />
Units outstanding (thousands) (1) 111,693 111,693 72,524 72,524 53,607 53,607 25,604 25,604<br />
Per unit $ 8.59 $ 7.64 $ 11.74 $ 10.69 $ 7.92 $ 7.06 $ 8.25 $ 7.28<br />
(1) Includes units associated with exchangeable shares.<br />
The table above shows what is normally referred to as a “produce-out” net<br />
asset value calculation under which the current value of the Trust’s reserves would be<br />
produced at future prices and costs as projected by GLJ. The value is a snapshot in time<br />
and is based on various assumptions including commodity prices that vary over time.<br />
In the absence of adding reserves to the Trust, the net asset value will decline<br />
as the reserves are produced out. The cash flow generated by the production relates<br />
directly to the cash distributions paid to unitholders. The evaluation includes future capital<br />
expenditure expectations required to bring undeveloped reserves on production.<br />
As noted in the property description section of this report, <strong>ARC</strong>’s technical<br />
team is working on a number of areas, including Lougheed and Ante Creek, which are<br />
expected to result in future reserve additions that would add to the Trust’s net asset value.<br />
In order to determine the “going concern” value of the Trust, a more detailed<br />
assessment would be required of the upside potential of specific properties and the<br />
ability of the <strong>ARC</strong> team to continue to make value-added capital expenditures. At<br />
inception on July 11, 1996 the net asset value was determined to be $10.26 per trust unit<br />
and, since that time, the Trust has distributed $9.08 per unit to unitholders, while the net<br />
asset value has only declined by $2.62 to $7.64 at December 31, <strong>2001</strong>. This<br />
demonstrates the value that can be added through active management.<br />
<strong>ARC</strong> ENERGY TRUST AR <strong>2001</strong>
PAGE 38<br />
ENVIRONMENT, HEALTH AND SAFETY<br />
ENVIRONMENT, HEALTH AND SAFETY<br />
<strong>ARC</strong>’S COMMITMENT TO SAFETY IS REFLECTED IN ITS SIXTH CONSECUTIVE YEAR<br />
OF NO LOST-TIME ACCIDENTS FOR EMPLOYEES. WE REMAIN COMMITTED TO<br />
CONDUCTING ALL ASPECTS OF OUR BUSINESS IN A SAFE AND<br />
ENVIRONMENTALLY RESPONSIBLE MANNER. AS WE EXPAND OUR OPERATIONS,<br />
WE ENSURE THAT ALL NEW EMPLOYEES UNDERSTAND THAT CONDUCTING OUR<br />
OPERATIONS IN A SAFE AND RELIABLE MANNER IS OF UTMOST IMPORTANCE.<br />
THE DEDICATION OF <strong>ARC</strong>’S STAFF AND CONSULTANTS HAS RESULTED IN<br />
MANAGING EXCEPTIONAL GROWTH WHILE MAINTAINING EXCELLENCE IN SAFETY<br />
PERFORMANCE AND RESPONSIBLE CARE OF THE ENVIRONMENT.<br />
HEALTH, SAFETY AND ENVIRONMENTAL STEWARDSHIP<br />
During <strong>2001</strong>, <strong>ARC</strong> remained committed to the principles set out by the<br />
Canadian Association of Petroleum Producers (CAPP) Environment, Health and Safety<br />
Stewardship Program. Participation in this program is a commitment to environmental<br />
protection, public and worker health and safety and annual reporting of progress. <strong>ARC</strong><br />
has participated in this benchmarking analysis since the program’s inception in 1999.<br />
<strong>ARC</strong> currently operates at CAPP’s Gold Level.<br />
SAFETY<br />
<strong>ARC</strong> has a high level of commitment to protecting the health and safety of<br />
employees, contractors and the public. <strong>ARC</strong> successfully and safely integrated all<br />
Startech properties in <strong>2001</strong>. Significant increases in construction and drilling were<br />
completed safely including several large projects such as the Lougheed gas plant,<br />
Jenner compressor station and Youngstown blending facility.<br />
RECLAMATION FUND<br />
<strong>ARC</strong> established a reclamation fund in 1996 with annual contributions to<br />
ensure that the necessary funds are available for future reclamation of wells and facilities<br />
once they have reached the end of their economic lives. During <strong>2001</strong>, <strong>ARC</strong> expended<br />
$4.1 million to address environmental issues including abandonments and reclamations<br />
for wells and flare pits. The balance in the fund as of December 31, <strong>2001</strong> was $10 million.<br />
Throughout the year, <strong>ARC</strong> continued to proactively address abandonments and<br />
reclamations to reduce future environmental liabilities.<br />
<strong>ARC</strong> ENERGY TRUST AR <strong>2001</strong>
PAGE 39<br />
ENVIRONMENT, HEALTH AND SAFETY<br />
ENVIRONMENT<br />
<strong>ARC</strong> conducts activities in accordance with Trust policies and environmental<br />
guidelines with the objective of protection of the environment.<br />
Air<br />
<strong>ARC</strong>’s focus on air quality issues continued with our second submission to<br />
Canada’s Climate Change – Voluntary Challenge and Registry program. This report<br />
details emission reductions and future objectives. <strong>ARC</strong> has been recognized as a “Silver<br />
Champion Level <strong>Report</strong>er”. Some of the significant accomplishments in the reduction of<br />
emissions are:<br />
• Continued reductions in flaring and greenhouse gas emissions through improved<br />
flare technology, vapour recovery installation and gas plant enhancements.<br />
• A 30 per cent overall reduction in emissions from operated properties resulting<br />
primarily from installing solution gas conservation facilities at the recently<br />
acquired Lougheed battery.<br />
• Minimized flaring during testing of newly drilled wells. Advance planning and<br />
installation of pipelines and/or compression also reduced flaring at Sundre,<br />
Caroline, Pembina and Ante Creek.<br />
Land and Water<br />
<strong>ARC</strong> continued its commitment to protect land and water. Policies and<br />
procedures demonstrating leadership in this area were maintained and further developed<br />
in <strong>2001</strong>. <strong>ARC</strong> continued to participate in key local groups that provide expertise and<br />
training in risk management. Examples of accomplishments during <strong>2001</strong> included:<br />
• Utilizing technology to minimize future environmental exposure to land and water.<br />
As one example, we installed liners in existing pipelines to reduce the risk of leaks.<br />
• Remaining committed to immediate surface reclamation following completion of well<br />
abandonments.<br />
• Remaining aware and sensitive to the importance of wildlife habitat concerns.<br />
• Continuing risk management efforts with participation in oil spill co-operatives and<br />
detailed emergency response planning.<br />
Photo: Al Roberts, Lougheed Gas Plant, Jeff Wickens, Bruce Riep<br />
<strong>ARC</strong> ENERGY TRUST AR <strong>2001</strong>
PAGE 40<br />
ENVIRONMENT, HEALTH AND SAFETY<br />
COMMUNITY INVOLVEMENT<br />
<strong>ARC</strong> places high value on community participation and encourages<br />
employees to contribute to the communities in which they live and work. In <strong>2001</strong>, <strong>ARC</strong>’s<br />
support of the United Way topped $150,000 in combined corporate and employee<br />
contributions.<br />
<strong>ARC</strong> gainfully employs residents of local communities with over 100 field staff<br />
and consultants operating in its five core areas. <strong>ARC</strong> undertakes financial commitments<br />
to these communities and encourages active volunteer involvement and participation in<br />
local initiatives. The Trust also provided financial support to various charities in the<br />
communities in which we operate including Sundre, Grande Prairie, Medicine Hat,<br />
Drayton Valley, Estevan, Carnduff, Lougheed and Oungre.<br />
In September <strong>2001</strong>, <strong>ARC</strong> was presented with an award from the Sundre<br />
Petroleum Operators Group recognizing its contributions as an “industry member with<br />
vision” for work in building relationships with industry partners, government and<br />
regulatory agencies and the community based on mutual trust, honesty and respect.<br />
<strong>ARC</strong> PLACES HIGH VALUE ON<br />
community participation<br />
AND ENCOURAGES EMPLOYEES TO contribute to<br />
the communities IN WHICH THEY LIVE AND WORK.<br />
<strong>ARC</strong> ENERGY TRUST AR <strong>2001</strong>
FEATURE:<br />
commitment<br />
LEADERSHIP IN ENVIRONMENTAL PROTECTION…<br />
WHILE CREATING ADDITIONAL VALUE FOR UNITHOLDERS<br />
WITH THE STARTECH ACQUISITION IN JANUARY <strong>2001</strong>, <strong>ARC</strong> BECAME OPERATOR<br />
OF A CRUDE OIL PROCESSING FACILITY IN THE LOUGHEED AREA IN<br />
SOUTHEASTERN SASKATCHEWAN. THE BATTERY HAD A LARGE NATURAL GAS<br />
FLARE WHICH WAS GENERATING SIGNIFICANT EMISSIONS. THE <strong>ARC</strong> TEAM<br />
RECOGNIZED AN OPPORTUNITY TO DEMONSTRATE ENVIRONMENTAL<br />
LEADERSHIP AND, AT THE SAME TIME, AN OPPORTUNITY TO CAPTURE THE<br />
MARKET VALUE OF THE HYDROCARBONS BEING FLARED. THE INSTALLATION OF<br />
SUCH A FACILITY WAS A CHALLENGE INVOLVING AN EXTENSIVE APPROVAL<br />
PROCESS REQUIRING THE INVOLVEMENT OF LOCAL AND PROVINCIAL<br />
AUTHORITIES IN ADDITION TO THE TECHNICAL CHALLENGES ASSOCIATED WITH<br />
THE DESIGN, CONSTRUCTION AND COMMISSIONING OF A NEW SOUR GAS<br />
PROCESSING PLANT.
PAGE 42<br />
FEATURE: COMMITMENT<br />
DEFINING THE PROJECT SPECS<br />
THE <strong>ARC</strong> TEAM FIRST EXAMINED THE RESERVES THAT COULD BE CAPTURED BY<br />
A NEW PROCESSING FACILITY. AFTER ANALYZING THE UNIQUE COMPOSITION OF<br />
THE LIQUIDS-RICH GAS, IT WAS DETERMINED THAT A NEW FACILITY COULD<br />
REALIZE 200 BBL/D OF ADDITIONAL PRODUCTION, WITH THE POSSIBILITY OF<br />
HIGHER VOLUMES FROM OTHER AREA OPERATORS. A SIGNIFICANT REDUCTION<br />
IN EMISSIONS WAS ALSO PROJECTED AS THE PLANT COULD BE ENGINEERED<br />
WITH EMISSION LEVELS WELL BELOW REGULATORY REQUIREMENTS.<br />
BY AUGUST, <strong>ARC</strong> HAD COMPLETED A DETAILED COMMUNITY CONSULTATION<br />
PROCESS AND HAD RECEIVED ALL THE NECESSARY REGULATORY APPROVALS. PLANT<br />
CONSTRUCTION COMMENCED IMMEDIATELY AND STARTUP BEGAN IN JANUARY 2002.<br />
THE PROJECT WAS COMPLETED AT A COST OF $5 MILLION.<br />
Group: George Gervais, Wayne Lentz, Andy Magee, Dave Kehrig<br />
Inset: Mary Lawrence<br />
<strong>ARC</strong> ENERGY TRUST AR <strong>2001</strong>
PAGE 43<br />
FEATURE: COMMITMENT<br />
ONGOING OPPORTUNITIES AND LEADERSHIP<br />
NEW BUSINESS OPPORTUNITIES ARE EXPECTED TO ARISE AS SEVERAL THIRD<br />
PARTY PRODUCERS IN THE AREA HAVE SHOWN INTEREST IN PROCESSING THEIR<br />
PRODUCTION THROUGH <strong>ARC</strong>’S NEW FACILITY. EQUALLY IMPORTANT IS THAT <strong>ARC</strong><br />
WAS ABLE TO DEMONSTRATE ITS LONG-TERM COMMITMENT TO THE<br />
ENVIRONMENT AND DEMONSTRATE ITS ABILITY TO PLAY A LEADERSHIP ROLE IN<br />
THE INDUSTRY.<br />
Top: Paul Fladeland<br />
Bottom: Lougheed Gas Plant, Les Avery<br />
<strong>ARC</strong> ENERGY TRUST AR <strong>2001</strong>
MANAGEMENT’S DISCUSSION AND ANALYSIS<br />
The following discussion and analysis of financial results should be read in conjunction with the<br />
audited consolidated financial statements for the year end December 31, <strong>2001</strong> and is based on<br />
information available to February 7, 2002.<br />
TABLE OF CONTENTS<br />
P46<br />
P48<br />
P48<br />
P49<br />
P50<br />
P50<br />
P51<br />
P51<br />
P51<br />
P52<br />
P52<br />
OBJECTIVES<br />
PRODUCTION<br />
MARKETING AND PRICES<br />
HEDGING<br />
REVENUE<br />
NETBACKS<br />
RECYCLE RATIO<br />
GENERAL AND<br />
ADMINISTRATIVE EXPENSES<br />
MANAGEMENT FEES<br />
INTEREST EXPENSE<br />
TAXES<br />
P52<br />
P53<br />
P53<br />
P54<br />
P54<br />
P56<br />
P57<br />
P58<br />
P59<br />
DEPLETION, DEPRECIATION AND<br />
FUTURE SITE RECLAMATION EXPENSES<br />
CASH FLOW AND EARNINGS<br />
CAPITAL EXPENDITURES<br />
ABANDONMENTS<br />
CAPITALIZATION AND FINANCIAL<br />
RESOURCES<br />
UNITHOLDERS’ EQUITY<br />
CASH DISTRIBUTIONS<br />
ASSESSMENT OF BUSINESS RISKS<br />
OUTLOOK<br />
GLOSSARY OF ABBREVIATIONS<br />
API<br />
American Petroleum Institute<br />
bbls<br />
barrels<br />
bbls/d<br />
barrels per day<br />
bcf<br />
billion cubic feet<br />
boe*<br />
barrels of oil equivalent<br />
boe/d*<br />
barrels of oil equivalent per day<br />
Capex<br />
capital expenditures<br />
FD&A costs finding, development and<br />
acquisition costs<br />
GAAP<br />
generally accepted accounting principles<br />
G&A<br />
general and administrative<br />
GJ<br />
gigajoule<br />
mbbls<br />
thousand barrels<br />
mboe*<br />
thousand barrels of oil equivalent<br />
mcf<br />
thousand cubic feet<br />
mcf/d<br />
thousand cubic feet per day<br />
mmbbls<br />
million barrels<br />
mmboe*<br />
million barrels of oil equivalent<br />
mmbtu<br />
million British Thermal Units<br />
mmcf<br />
million cubic feet<br />
mmcf/d<br />
million cubic feet per day<br />
NAV<br />
net asset value<br />
NGL<br />
natural gas liquids<br />
NYMEX<br />
New York Mercantile Exchange<br />
RLI<br />
reserve life index<br />
WTI<br />
West Texas Intermediate<br />
*6 mcf of gas = 1 barrel of oil<br />
FORWARD-LOOKING STATEMENTS<br />
This disclosure contains certain forward-looking estimates that involve substantial known and unknown risks and<br />
uncertainties, certain of which are beyond <strong>ARC</strong>’s control, including: the impact of general economic conditions in Canada and<br />
the United States, industry conditions, changes in laws and regulations including the adoption of new environmental laws and<br />
regulations and changes in how they are interpreted and enforced, increased competition, the lack of availability of qualified<br />
personnel or management, fluctuations in commodity prices, foreign exchange or interest rates, stock market volatility and<br />
obtaining required approvals of regulatory authorities. In addition there are risks and uncertainties associated with oil and gas<br />
operations, therefore <strong>ARC</strong>’s actual results, performance or achievement could differ materially from those expressed in, or<br />
implied by, these forward-looking estimates and, accordingly, no assurances can be given that any of the events anticipated<br />
by the forward-looking estimates will transpire or occur, or if any of them do so, what benefits, including the amounts of<br />
proceeds, that <strong>ARC</strong> will derive therefrom.
management’s<br />
discussion and analysis<br />
THE MANAGER OF THE TRUST MET OR EXCEEDED ALL OF ITS KEY STRATEGIC<br />
OBJECTIVES FOR <strong>2001</strong>.
PAGE 46<br />
MANAGEMENT’S DISCUSSION AND ANALYSIS<br />
OBJECTIVE: REPLACE ANNUAL PRODUCTION THROUGH COST EFFECTIVE<br />
ACQUISITIONS AND DEVELOPMENT ACTIVITIES.<br />
ACCOMPLISHMENT: In January, <strong>ARC</strong> closed the acquisition of all outstanding shares<br />
of Startech Energy Inc. (“Startech”), using a unique plan of arrangement under which the<br />
Trust acquired virtually all of the producing oil and gas assets and the Startech<br />
shareholders retained several minor producing properties and the higher risk exploration<br />
prospects for total consideration of $510 million. The Trust conducted an active<br />
development drilling and exploitation program in <strong>2001</strong> directed towards enhancing the<br />
Trust’s proven producing reserves and future production base. The acquisition and<br />
development programs added 64 mmboe of established reserves replacing 407 per cent<br />
of production at a cost of $9.75/boe. Since the Trust’s Initial Public Offering on July 11,<br />
1996, the Trust has acquired and developed 223 mmboe of established reserves at a total<br />
cost of $1.4 billion resulting in a finding, development and acquisition (FD&A) cost since<br />
inception of $6.32/boe.<br />
OBJECTIVE: MAINTAIN AN ACTIVE HEDGING PROGRAM TO ENHANCE<br />
THE STABILITY AND PREDICTABILITY OF THE TRUST’S DISTRIBUTIONS.<br />
ACCOMPLISHMENT: Hedging has and will continue to play a key role in the<br />
management of the Trust. In addition to production levels, the major variables impacting<br />
future distributions and unitholder returns are commodity prices in conjunction with the<br />
Canadian/US exchange rate. The Manager of the Trust has developed a hedging<br />
program approved by the Board (detailed later in this section) in order to provide stability<br />
and greater certainty of distributions to unitholders. During <strong>2001</strong>, the Trust’s distributions<br />
ranged from $0.22 per month early in the year to $0.15 per month during the last quarter.<br />
This 32 per cent decrease in distributions compares very favourably to the 54 per cent<br />
decline in average commodity prices over the year from a high of $45.04/boe in the first<br />
quarter to a low of $20.51/boe in the fourth quarter. For 2002, the Trust has hedged<br />
approximately 56 per cent of oil production and 41 per cent of gas production at prices<br />
materially greater than current market expectations. The main focus for 2002 will be to<br />
take advantage of commodity price spikes which may occur to lock-in a comparable<br />
portion of 2003 production at favourable prices.<br />
<strong>ARC</strong> ENERGY TRUST AR <strong>2001</strong>
PAGE 47<br />
MANAGEMENT’S DISCUSSION AND ANALYSIS<br />
OBJECTIVE: FOCUS ON COST CONTROL TO ENHANCE THE TRUST’S<br />
POSITION AS ONE OF THE LEADING OIL AND GAS ROYALTY TRUSTS<br />
IN CANADA.<br />
ACCOMPLISHMENT: Operating costs have remained low with total corporate<br />
operating costs averaging $5.47/boe in <strong>2001</strong>, a $0.55/boe increase over 2000 costs of<br />
$4.92/boe. The major reason for the year-over-year increase, especially in the first half of<br />
<strong>2001</strong>, was increased electricity costs which were experienced in Alberta. General and<br />
Administrative (G&A) expenses have been held in line as well at $0.75/boe, a modest<br />
increase over the $0.69/boe incurred in 2000. The Manager believes that the Trust<br />
requires a complete technical team to properly manage the assets and unlock the future<br />
potential of the asset base. In <strong>2001</strong>, development geological and geophysical staff<br />
additions were made and key management positions were filled in the areas of Human<br />
<strong>Resources</strong>, Investor Relations and Business Development.<br />
OBJECTIVE: MAINTAIN A CONSERVATIVE DEBT MANAGEMENT POLICY<br />
TO EXECUTE THE TRUST’S COUNTER-CYCLICAL STRATEGY OF<br />
ACQUIRING ASSETS WHERE POSSIBLE IN THE LOW POINT OF THE<br />
COMMODITY PRICE CYCLE AND REDUCING DEBT IN PERIODS OF HIGH<br />
CASH FLOW.<br />
ACCOMPLISHMENT: The Trust’s objective is to be one of the most conservatively<br />
capitalized conventional oil and gas trusts by controlling the use of debt. At year-end<br />
<strong>2001</strong>, debt was $294 million or 1.1 times <strong>2001</strong> cash flow. With <strong>2001</strong> cash flow buoyed by<br />
strong commodity prices, the Trust is expecting the debt to cash flow ratio to increase to<br />
approximately 1.5 times 2002 cash flow with debt representing approximately 20 per<br />
cent of total capitalization. In October <strong>2001</strong>, the Trust issued 8.05 million new trust units<br />
and raised $84 million of net proceeds under an equity offering. These proceeds<br />
temporarily reduced debt and are earmarked to fund the Trust’s 2002 capital program. In<br />
addition, the Trust made a deliberate move to revise its distribution policy in October of<br />
2000 under which the Trust now may withhold up to 20 per cent of cash flow to finance<br />
capital expenditures in order to assist in the replacement of a portion of production.<br />
SUMMARY OF OTHER OBJECTIVES<br />
The Trust had many other objectives in <strong>2001</strong> that were fulfilled, including those centered<br />
around retaining and increasing the expertise of its workforce, the development of key<br />
business relationships, prudent use of new technology and further development and<br />
expansion of the Trust’s environmental, health and safety programs in order to be a<br />
leader in the Canadian oil and gas industry.<br />
<strong>ARC</strong> ENERGY TRUST AR <strong>2001</strong>
PAGE 48<br />
MANAGEMENT’S DISCUSSION AND ANALYSIS<br />
PRODUCTION<br />
Production volumes for <strong>2001</strong> averaged 43,111 boe/d, representing an<br />
increase of 58 per cent from the 2000 average of 27,355 boe/d. This increase is a result<br />
of the Startech acquisition. Crude oil and natural gas liquids represented 55 per cent of<br />
production in <strong>2001</strong>, with natural gas accounting for the remaining 45 per cent.<br />
In <strong>2001</strong>, <strong>ARC</strong> had 72 properties producing in excess of 100 boe/d with no one<br />
property accounting for more than eight per cent of total production.<br />
PRODUCTION<br />
(mboe/d)<br />
01<br />
00<br />
99<br />
98<br />
97<br />
15 30 45 60<br />
Oil and NGL<br />
Gas<br />
MARKETING AND PRICES<br />
Crude Oil Pricing<br />
West Texas Intermediate (WTI) is the benchmark for North American oil prices<br />
and is the crude type that the NYMEX futures contract is based upon. The WTI oil price<br />
averaged US$25.93/bbl in <strong>2001</strong>, down from US$30.35/bbl in 2000. Canadian crude oil<br />
prices are based upon refiners’ postings, primarily at Edmonton, Alberta and represent<br />
the WTI price at Cushing, Oklahoma adjusted for transportation, quality differences and<br />
the Canadian/US exchange rate. <strong>ARC</strong>’s average field price reflects the refiners’ posted<br />
price at Edmonton, Alberta less deductions for transportation from the field and<br />
adjustments for <strong>ARC</strong>’s product quality relative to the posted price. <strong>ARC</strong>’s average field<br />
price in <strong>2001</strong> was $33.00/bbl as compared to $39.29 for the average of the light sweet<br />
postings at Edmonton. This modest discount to the average Edmonton posted price<br />
reflects the high quality of <strong>ARC</strong>’s crude oil mix, which is comprised of 68 per cent light<br />
sweet (greater than 35° API) crude, 26 per cent medium gravity and 6 per cent heavy<br />
gravity oil (less than 23° API). Crude oil prices decreased throughout <strong>2001</strong> with WTI<br />
prices in December being 34 per cent lower than January. <strong>ARC</strong>’s average oil price, net<br />
of all hedging transactions, decreased 14 per cent in <strong>2001</strong> to $31.70/bbl as compared to<br />
$36.74/bbl in 2000. Crude oil is sold under 30 day evergreen contracts while natural gas<br />
liquids are sold under annual arrangements.<br />
Natural Gas Pricing<br />
US natural gas prices are typically referenced off NYMEX at Henry Hub,<br />
Louisiana, while Alberta and British Columbia prices are referenced off Alberta Energy<br />
Company’s AECO Hub and Sumas, Washington, respectively. The addition of new<br />
pipeline capacity from Alberta has dramatically reduced the differential between Henry<br />
Hub and AECO prices over the last two years.<br />
<strong>ARC</strong> ENERGY TRUST AR <strong>2001</strong>
PAGE 49<br />
MANAGEMENT’S DISCUSSION AND ANALYSIS<br />
Natural gas prices were very strong in the first quarter of <strong>2001</strong>, but weakened<br />
through the year. Despite the weakening trend, <strong>ARC</strong>’s average wellhead gas price<br />
increased by 28 per cent to $5.72/mcf in <strong>2001</strong> from $4.48/mcf in 2000. <strong>ARC</strong>’s prices are<br />
net of hedging and transportation costs. AECO Hub prices were $6.28 and $4.92/mcf for<br />
<strong>2001</strong> and 2000, respectively.<br />
During <strong>2001</strong>, <strong>ARC</strong> continued to follow a marketing strategy of diversifying its<br />
sales and transportation portfolio in order to maximize production netbacks in<br />
combination with diversification of contracts amongst a variety of credit worthy<br />
counterparties in accordance with the Trust’s risk management policies.<br />
HEDGING<br />
In 1998, <strong>ARC</strong> established a Risk Management Committee to conduct its<br />
hedging program with the following objectives:<br />
* protect unitholder return on investment;<br />
* stabilize monthly distributions;<br />
* employ a portfolio approach to hedging – enter into a number of small positions that<br />
build upon each other;<br />
* participate in commodity price upturns to the greatest extent possible, while limiting<br />
exposure to price downturns;<br />
* ensure profitability of specific oil and gas properties that are more sensitive to changes<br />
in market conditions.<br />
The <strong>2001</strong> prices include a hedging gain of $0.22/mcf for natural gas and a loss<br />
of $1.30/bbl for oil.<br />
For 2002, <strong>ARC</strong> has hedged approximately 56 per cent of oil production<br />
volumes and 41 per cent of natural gas production volumes utilizing a variety of contracts<br />
under which the quantity and price of amounts hedged vary depending on the market<br />
price of the commodity as detailed in the tables below.<br />
Crude Oil<br />
WTI (US$/bbl) Hedged Price (US$/bbl) % Hedged<br />
$ 16.00 $ 21.93 43<br />
$ 18.00 $ 24.26 56<br />
$ 20.00 $ 26.00 56<br />
$ 22.00 $ 25.47 56<br />
$ 24.00 $ 24.77 56<br />
$ 26.00 $ 24.02 56<br />
Natural Gas<br />
AECO (CDN$/mcf) Hedged Price (CDN$/mcf) % Hedged<br />
$ 2.50 $ 4.00 41<br />
$ 3.00 $ 4.01 41<br />
$ 3.50 $ 4.02 41<br />
$ 4.00 $ 4.16 41<br />
$ 4.50 $ 4.21 41<br />
<strong>ARC</strong> ENERGY TRUST AR <strong>2001</strong>
PAGE 50<br />
MANAGEMENT’S DISCUSSION AND ANALYSIS<br />
REVENUE<br />
Revenues, prior to hedging transactions, increased to $516.5 million in <strong>2001</strong><br />
compared to $354.7 million in 2000. The increase was due to higher production volumes<br />
as a result of the Startech acquisition. Hedging losses declined to $1.0 million in <strong>2001</strong><br />
compared to $38.4 million in 2000. Production revenue net of hedging losses was<br />
$515.5 million in <strong>2001</strong> and $316.3 million in 2000.<br />
NETBACKS<br />
Operating netbacks were relatively unchanged at $20.15/boe in <strong>2001</strong><br />
compared to $20.26/boe in 2000 as the increase in royalties and operating costs offset<br />
the increase in commodity prices. As a result of the 28 per cent increase in natural gas<br />
prices, royalties, net of Alberta Royalty Tax Credit, increased to 21.7 per cent of revenues<br />
prior to hedging transactions in <strong>2001</strong> from 18.1 per cent in 2000. Operating costs, net of<br />
processing income, in <strong>2001</strong> increased to $5.47/boe up from $4.92/boe in 2000. This<br />
increase can primarily be attributed to higher costs for electricity in Alberta. The<br />
components of operating netbacks are shown below:<br />
($/boe) <strong>2001</strong> 2000 1999 1998 1997 1996<br />
Market price 32.82 35.43 20.25 14.43 16.94 18.13<br />
Hedging loss (0.06) (3.84) (1.07) – – –<br />
Selling price 32.76 31.59 19.18 14.43 16.94 18.13<br />
Royalties (7.14) (6.41) (2.92) (2.06) (2.80) (2.87)<br />
Operating costs (5.47) (4.92) (4.42) (4.04) (4.06) (3.57)<br />
Netbacks 20.15 20.26 11.84 8.33 10.08 11.69<br />
AVERAGE SELLING PRICE<br />
($/boe)<br />
01<br />
00<br />
99<br />
98<br />
97<br />
10 20 30 40<br />
Netback Royalties Operating Costs<br />
RECYCLE RATIO<br />
A key indicator of profitability in the oil and gas sector is the recycle ratio which<br />
is defined as operating netback divided by three-year average FD&A costs. <strong>ARC</strong>’s<br />
recycle ratio continues to be one of the highest in the industry.<br />
<strong>2001</strong> 2000 1999 1998 1997 1996<br />
Netback ($/boe) 20.15 20.26 11.84 8.33 10.08 11.69<br />
Three-year average FD&A ($/boe) 6.94 4.95 4.87 4.85 4.91 4.83<br />
Recycle ratio 2.9 4.1 2.4 1.7 2.1 2.4<br />
Inception to date FD&A ($/boe) 6.32 4.93 4.85 4.85 4.91 4.83<br />
Recycle ratio 3.2 4.1 2.4 1.7 2.1 2.4<br />
<strong>ARC</strong> ENERGY TRUST AR <strong>2001</strong>
PAGE 51<br />
MANAGEMENT’S DISCUSSION AND ANALYSIS<br />
GENERAL AND ADMINISTRATIVE EXPENSES<br />
General and administrative expenses, net of overhead recoveries on operated<br />
properties, increased in <strong>2001</strong> to $0.75/boe from $0.69/boe in 2000.<br />
($ thousands, except boe amounts) <strong>2001</strong> 2000 1999 1998 1997 1996<br />
General and administrative expenses 11,812 6,956 4,381 3,246 2,735 652<br />
Per boe 0.75 0.69 0.54 0.70 0.63 0.37<br />
MANAGEMENT FEES<br />
The Manager receives a management fee of three per cent of net operating<br />
revenue. Management fees amounted to $8.8 million or $0.56/boe in <strong>2001</strong> compared to<br />
$6.2 million or $0.62/boe in 2000. The increase in absolute management fees is attributed<br />
to the higher production volumes, while the decrease on a per boe basis is the result of<br />
the marginal reduction in netback. Combined <strong>2001</strong> management fees and general and<br />
administrative expenses were unchanged from 2000 at $1.31/boe.<br />
G&A AND MANAGEMENT FEES<br />
($/boe)<br />
01<br />
00<br />
99<br />
98<br />
97<br />
0.50 1.00 1.50 2.00<br />
G&A<br />
Management Fees<br />
INTEREST EXPENSE<br />
Interest expense increased to $17.1 million in <strong>2001</strong> from $10.1 million in 2000<br />
as a result of a higher monthly average debt balance attributed to the Startech acquisition<br />
and increased capital expenditures. This was partially offset by declining interest rates.<br />
Long-term debt was reduced in November with net proceeds of $84 million from the issue<br />
of 8.05 million trust units. Interest expense was minimized over the course of the year by<br />
the Manager choosing to finance debt through the issuance of lower cost bankers’<br />
acceptances as opposed to borrowing at the prevailing bank prime interest rates.<br />
<strong>ARC</strong> ENERGY TRUST AR <strong>2001</strong>
PAGE 52<br />
MANAGEMENT’S DISCUSSION AND ANALYSIS<br />
TAXES<br />
Capital taxes paid or payable by <strong>ARC</strong> based on debt and equity levels at the<br />
end of the year amounted to $1.8 million in <strong>2001</strong> versus $0.2 million in 2000. The increase<br />
is a direct result of <strong>ARC</strong> becoming a much larger corporation in <strong>2001</strong>.<br />
As a result of the Startech acquisition, a future income tax liability of $203<br />
million was set up. This liability is due to the difference between the purchase price of the<br />
Startech assets and the amount of tax pools at the date of the acquisition. A future income<br />
tax recovery of $28 million in <strong>2001</strong> has left a future income tax liability of $175 million at<br />
December 31, <strong>2001</strong>. The future tax liability was recorded in accordance with Canadian<br />
GAAP, which states that a future liability must be recorded when a corporation purchases<br />
assets with tax pools less than the associated purchase price. In the Trust’s structure,<br />
payments are made between <strong>ARC</strong> <strong>Resources</strong> and the Trust transferring both income and<br />
future tax liability from <strong>ARC</strong> <strong>Resources</strong> to the individual unitholders. Therefore, it is the<br />
opinion of the Manager, that no cash income taxes will be paid by <strong>ARC</strong> <strong>Resources</strong> but<br />
rather a higher percentage of distributions will be taxable due to the purchase of Startech<br />
compared to an asset purchase under which <strong>ARC</strong> <strong>Resources</strong> would have tax pools equal<br />
to the purchase price. The important point with the Startech acquisition is that the tax<br />
pools as a percentage of the purchase price closely approximated the percentage of<br />
existing tax pools to the value of the Trust and <strong>ARC</strong> <strong>Resources</strong>’ assets immediately prior<br />
to the acquisition and, as such, there is no expected future increase in the taxable portion<br />
of distributions relative to what existed prior to the acquisition.<br />
At year-end <strong>2001</strong>, the Trust had $657.4 million ($430.2 million in 2000) in<br />
income tax pools which will be utilized to reduce the taxable portion of future cash<br />
distributions. In addition, <strong>ARC</strong> <strong>Resources</strong> had $203.6 million of income tax pools as at<br />
December 31, <strong>2001</strong> which will be utilized to minimize, and potentially eliminate, future<br />
corporate income taxes.<br />
DEPLETION, DEPRECIATION AND FUTURE SITE RECLAMATION EXPENSES<br />
The <strong>2001</strong> depletion, depreciation and amortization (DD&A) rate increased to<br />
$10.49/boe from $6.23/boe in 2000. The DD&A rate includes a provision for future site<br />
reclamation and abandonment of $0.59/boe in <strong>2001</strong> compared to $0.61/boe in 2000. The<br />
increase in the DD&A rate in <strong>2001</strong> reflects the accounting treatment for the Startech<br />
acquisition. Assets to be depleted were increased by $203 million for potential future<br />
income taxes and $33 million for deferred hedging losses that would have been incurred<br />
had <strong>ARC</strong> collapsed the hedges at closing.<br />
It is not anticipated <strong>ARC</strong> <strong>Resources</strong> will pay taxes in the future and therefore<br />
the future income tax liability will be brought into income over time, offsetting the higher<br />
DD&A rate. In <strong>2001</strong>, the tax recovery was $1.79/boe for an effective net DD&A rate of<br />
$8.70/boe.<br />
<strong>ARC</strong> ENERGY TRUST AR <strong>2001</strong>
PAGE 53<br />
MANAGEMENT’S DISCUSSION AND ANALYSIS<br />
CASH FLOW AND EARNINGS<br />
The total changes in revenue less expenses resulted in record cash flow and<br />
earnings for <strong>2001</strong>. Earnings increased to $140.7 million in <strong>2001</strong> from $110.9 in 2000;<br />
while cash flow increased by 45 per cent to $260.3 million from $179.4 million in 2000.<br />
01<br />
CASH FLOW AND EARNINGS<br />
($ millions)<br />
00<br />
99<br />
98<br />
97<br />
0 100 200 300<br />
Cash Flow<br />
Net Income<br />
CAPITAL EXPENDITURES<br />
Total capital expenditures including acquisitions increased to $625 million in<br />
<strong>2001</strong> from $208 million in 2000. The majority of the increase was due to a $369 million<br />
increase in net acquisition expenditures. Substantial increases also occurred in<br />
development drilling, geological, geophysical and facilities expenditures as <strong>ARC</strong><br />
continues to develop its asset base. Total reserve acquisition and development costs for<br />
<strong>2001</strong> were $9.75/boe compared to $5.16/boe in 2000. A breakdown of capital<br />
expenditures by category is shown below:<br />
($ thousands) <strong>2001</strong> 2000 1999 1998 1997 1996<br />
Geological and geophysical expenditures 2,215 466 186 339 74 —<br />
Development drilling 73,147 39,021 20,974 6,967 7,362 116<br />
Plant facilities 22,970 13,999 2,743 2,636 462 977<br />
Other capital expenditures 3,886 544 347 593 857 109<br />
Producing property net acquisitions<br />
(value net of post-closing adjustments) 522,659 153,887 231,482 60 93,962 206,231<br />
Total capital expenditures 624,877 207,917 255,731 10,595 102,717 207,433<br />
Net change in established reserves<br />
after production 48,344 30,268 44,528 (1,722) 15,892 41,181<br />
<strong>Annual</strong> production 15,736 10,012 8,093 4,649 4,375 1,751<br />
<strong>Annual</strong> reserve additions 64,080 40,280 52,621 2,927 20,267 42,932<br />
<strong>Annual</strong> finding, development and<br />
acquisition costs ($/boe) 9.75 5.16 4.86 3.62 5.07 4.83<br />
Three year rolling average ($/boe) 6.94 4.95 4.87 4.85 4.91 4.83<br />
Cumulative since inception ($/boe) 6.32 4.93 4.85 4.85 4.91 4.83<br />
<strong>ARC</strong> ENERGY TRUST AR <strong>2001</strong>
PAGE 54<br />
MANAGEMENT’S DISCUSSION AND ANALYSIS<br />
ABANDONMENTS<br />
<strong>ARC</strong> takes a proactive approach when dealing with the abandonment and<br />
reclamation of associated well and facility sites, as well as other environmental issues. In<br />
<strong>2001</strong>, the Trust hired an environmental coordinator to embark on a proactive program to<br />
abandon and reclaim wells and facilities which have reached the end of their economic<br />
lives. <strong>ARC</strong> <strong>Resources</strong> has established a reclamation fund into which $4.1 million cash and<br />
interest income was contributed during the year. The balance in the fund was reduced for<br />
actual reclamation expenditures of $3.8 million thereby resulting in a fund balance of<br />
$10.1 million as at December 31, <strong>2001</strong>. This fund is invested in short-term market<br />
instruments to provide for future abandonment liabilities. Future contributions are<br />
currently set at approximately $4.0 million per year in order to provide for the total<br />
estimated future abandonment and site reclamation costs. <strong>ARC</strong> has been active in<br />
improving the quality of its oil and gas reserve base by purchasing properties and then<br />
selling smaller, lower quality reserves which tend to have a shorter reserve life and<br />
therefore a shorter time period prior to the eventual abandonment of the property. This<br />
practise will continue in the future in order to mitigate actual future abandonment costs.<br />
CAPITALIZATION AND FINANCIAL RESOURCES<br />
Working capital at December 31, <strong>2001</strong> was $5.8 million. Total debt outstanding<br />
at December 31, <strong>2001</strong> was $294 million which includes bank debt of $238.7 million and<br />
a US$35 million Senior Secured Note. Unutilized bank lines of credit of $111 million were<br />
available pursuant to $350 million credit facilities in place with four major Canadian<br />
financial institutions. <strong>ARC</strong>’s diverse, high-quality, long-life assets support the debt.<br />
End-of-year net debt to total capitalization was approximately 17.6 per cent<br />
(11.7 per cent in 2000) and debt to cash flow payout was approximately 1.1 years (four<br />
months in 2000) based upon cash flow of $260 million and net debt of $289 million.<br />
($ thousands, except per boe amounts) <strong>2001</strong> 2000 1999 1998 1997 1996<br />
Bank debt 294,489 115,068 141,000 72,499 65,955 37,998<br />
Less: Working capital (deficiency) 5,805 6,339 15,761 (1,688) 4,647 1,647<br />
Net debt obligations 288,684 108,729 125,239 74,187 61,308 36,351<br />
Units<br />
Outstanding units (thousands) 110,609 72,524 53,607 25,604 25,604 18,000<br />
Market price at end of period $ 12.10 $ 11.30 $ 8.75 $ 6.15 $ 10.45 $ 12.25<br />
Exchangeable Shares<br />
Outstanding shares (thousands) 915 – – – – –<br />
Market price at end of period $ 13.75 – – – – –<br />
Total <strong>ARC</strong> capitalization 1,639,634 928,250 594,300 231,651 328,870 256,851<br />
Net debt as a percentage of<br />
total capitalization (per cent) 17.6 11.7 21.1 32.0 18.6 14.2<br />
<strong>ARC</strong> ENERGY TRUST AR <strong>2001</strong>
PAGE 55<br />
MANAGEMENT’S DISCUSSION AND ANALYSIS<br />
TOTAL CAPITALIZATION<br />
($ billions)<br />
01<br />
00<br />
99<br />
98<br />
97<br />
0.50 1.00 1.50 2.00<br />
NET DEBT AS A PERCENTAGE OF TOTAL CAPTALIZATION<br />
(%)<br />
01<br />
00<br />
99<br />
98<br />
97<br />
10 20 30 40<br />
Subsequent to year-end, the Board of Directors approved the removal of the<br />
debt covenants in the Royalty Agreement between <strong>ARC</strong> <strong>Resources</strong> <strong>Ltd</strong>. and the Trust. As<br />
the Trust holds a significant portion of its assets outside of <strong>ARC</strong> <strong>Resources</strong>, most<br />
significantly its Saskatchewan assets in <strong>ARC</strong> (Sask) Energy Trust, the debt covenant did<br />
not achieve the purpose it was originally intended to serve. After careful consideration, it<br />
was decided to remove the debt covenant and substitute overall Board approval as the<br />
overriding approval on the Manager’s use of debt. The Manager has consistently stated<br />
that the objectives of <strong>ARC</strong> Energy Trust in respect to the use of debt are as follows:<br />
• to be one of the most conservatively capitalized conventional oil and gas trusts;<br />
• to consider the commodity price cycles and manage debt so that debt to equity and<br />
debt to cash flow are at low levels during periods of high commodity prices. This<br />
ensures that in periods of declining commodity prices debt to cash flow remains at<br />
acceptable levels; and<br />
• to finance the major portion of acquisitions with equity.<br />
Currently several Canadian conventional oil and gas trusts have obtained US<br />
stock exchange listings in order to make their trust units more accessible to US investors.<br />
We are monitoring this situation and at this time have chosen not to pursue a US listing<br />
until it is evident that the advantages outweigh the costs of obtaining and maintaining a<br />
US listing. The Trust has become a Securities and Exchange Commission (“SEC”)<br />
registrant under which we are making the necessary regulatory filings to provide easier<br />
access to the Trust’s financial information for US investors purchasing units on the Toronto<br />
Stock Exchange.<br />
<strong>ARC</strong> ENERGY TRUST AR <strong>2001</strong>
PAGE 56<br />
MANAGEMENT’S DISCUSSION AND ANALYSIS<br />
UNITHOLDERS’ EQUITY<br />
<strong>ARC</strong>’s total capitalization increased 76 per cent to $1.6 billion during <strong>2001</strong> with<br />
the market value of trust units representing 82 per cent of total capitalization. Debt, net of<br />
working capital, represented 18 per cent of total capitalization. During <strong>2001</strong>, the market<br />
price of the trust units increased from $11.30 to $12.10.<br />
In conjunction with the Startech acquisition, <strong>ARC</strong> <strong>Resources</strong> issued 7.4 million<br />
Exchangeable Shares. The Exchangeable Shares can be converted, at the option of the<br />
shareholder, into trust units. The number of trust units issuable upon conversion is based<br />
on the exchange ratio in effect at the conversion date. The exchange ratio is calculated<br />
monthly based on the cash distribution paid divided by the 10-day weighted average<br />
price preceding the record date. The Exchangeable Shares are not eligible for<br />
distributions. During the year, 6.5 million Exchangeable Shares were converted into<br />
6.8 million trust units.<br />
Unitholders electing to reinvest distributions or make optional cash payments<br />
to acquire trust units from treasury under the Distribution Reinvestment Plan (DRIP)<br />
resulted in an additional 57,117 trust units being issued in <strong>2001</strong>. The units were issued at<br />
an average price of $11.38 raising a total of $650,453.<br />
During <strong>2001</strong>, as part of <strong>ARC</strong>’s long-term incentive plan, 1,509,517 trust unit<br />
incentive rights (804,000 in 2000) were issued to office and field employees, long-term<br />
consultants and independent directors at prices ranging from $10.49 – $12.70 per trust<br />
unit ($9.10 – $11.65 in 2000). The exercise price is adjusted downward over time by the<br />
amount, if any, that annual distributions exceed 10 per cent of net book value of property,<br />
plant and equipment. The rights have a five-year term and vest equally over three years<br />
from the date of grant. Rights to purchase 2,509,000 trust units at an average adjusted<br />
exercise price of $9.05 were outstanding at December 31, <strong>2001</strong>. These rights have an<br />
average remaining contractual life of 3.8 years and expire at various dates to November<br />
2006. Of the rights outstanding at December 31, <strong>2001</strong>, 218,000 were exercisable at that<br />
time.<br />
In November <strong>2001</strong>, <strong>ARC</strong> completed an equity financing which raised<br />
$88.6 million of gross proceeds ($84.0 million net) on the issuance of 8.05 million trust<br />
units at $11.00 per trust unit. The proceeds were used to reduce existing debt levels on<br />
an interim basis and to partially fund <strong>2001</strong> and 2002 capital expenditures.<br />
UNITS OUTSTANDING AT YEAR-END<br />
(millions)<br />
01*<br />
00<br />
99<br />
98<br />
97<br />
30 60 90 120<br />
*Includes units reserved for exchangeable shares<br />
<strong>ARC</strong> ENERGY TRUST AR <strong>2001</strong>
PAGE 57<br />
MANAGEMENT’S DISCUSSION AND ANALYSIS<br />
CASH DISTRIBUTIONS<br />
Total cash distributions of $2.31 per trust unit were made in fiscal year <strong>2001</strong><br />
($2.01 in 2000) for total cumulative distributions since inception of $505.3 million<br />
($9.08 per trust unit). This record distribution level was a result of continued strong<br />
performance of the Trust. In <strong>2001</strong>, 90 per cent of cash flow was distributed to unitholders.<br />
The remaining 10 per cent ($26.2 million) was used to fund capital expenditures and to<br />
make the annual contribution to the reclamation fund. <strong>ARC</strong>’s distribution policy is to<br />
withhold up to 20 per cent of cash flow net of the reclamation fund contributions to fund<br />
capital expenditures. The actual amount withheld is dependant on the commodity price<br />
environment and is at the discretion of the Board of Directors. This holdback policy is a<br />
key difference between <strong>ARC</strong> and other conventional oil and gas trusts. We believe it is<br />
essential to focus on production replacement activities partially funded by cash flow in<br />
order to enhance long-term unitholder returns.<br />
01<br />
CASH AVAILABLE FOR DISTRIBUTION<br />
($ millions)<br />
00<br />
99<br />
98<br />
97<br />
70 140 210 280<br />
Cash Distributed<br />
Cash Flow<br />
Monthly cash distributions for the first quarter of 2002 were set at $0.13 per unit<br />
subject to commodity price fluctuations. Revisions, if any, to the monthly distribution are<br />
normally announced on a quarterly basis in the context of prevailing and anticipated<br />
commodity prices. During periods of volatile commodity prices, the Trust may vary the<br />
distribution rate monthly. Any differences between cash available for distribution and<br />
actual cash distributions in any quarter are adjusted for in the ensuing quarter’s<br />
monthly distribution.<br />
<strong>ARC</strong> ENERGY TRUST AR <strong>2001</strong>
PAGE 58<br />
MANAGEMENT’S DISCUSSION AND ANALYSIS<br />
Historical Distributions by Calendar Year<br />
($) Distributions Taxable Return of Capital<br />
Calendar Year<br />
2002 0.15 (1) 0.09 (2) 0.06 (2)<br />
<strong>2001</strong> 2.41 (3) 1.64 0.77<br />
2000 1.86 0.84 1.02<br />
1999 1.25 0.26 0.99<br />
1998 1.20 0.12 1.08<br />
1997 1.40 0.31 1.09<br />
1996 0.81 – 0.81<br />
Cumulative 9.08 3.26 5.82<br />
(1) The distribution based upon December <strong>2001</strong> cash flow and paid on January 15, 2002 is subject to tax in 2002.<br />
(2) The estimated taxable portion of distributions in 2002 is 60 to 65 per cent.<br />
(3) Calendar year distributions were $0.10 greater than the fiscal year distributions, due to the passage of time from accounting month<br />
end to distribution payments.<br />
<strong>2001</strong> Distributions by Month<br />
Tax Deferred<br />
Taxable Amount Total<br />
($) Amount (Return of Capital) Distribution<br />
Payment Date<br />
January 15, <strong>2001</strong> 0.1700 0.0800 0.25<br />
February 15, <strong>2001</strong> 0.1360 0.0640 0.20<br />
March 15, <strong>2001</strong> 0.1360 0.0640 0.20<br />
April 16, <strong>2001</strong> 0.1360 0.0640 0.20<br />
May 15, <strong>2001</strong> 0.1496 0.0704 0.22<br />
June 15, <strong>2001</strong> 0.1496 0.0704 0.22<br />
July 16, <strong>2001</strong> 0.1496 0.0704 0.22<br />
August 15, <strong>2001</strong> 0.1360 0.0640 0.20<br />
September 17, <strong>2001</strong> 0.1360 0.0640 0.20<br />
October 15, <strong>2001</strong> 0.1360 0.0640 0.20<br />
November 15, <strong>2001</strong> 0.1020 0.0480 0.15<br />
December 17, <strong>2001</strong> 0.1020 0.0480 0.15<br />
Total 1.6388 0.7712 2.41<br />
ASSESSMENT OF BUSINESS RISKS<br />
The <strong>ARC</strong> management team is focused on long-term strategic planning and<br />
has identified the following items as risks and in certain cases opportunities associated<br />
with the Trust’s business: (a) operational risk associated with the production of oil and<br />
natural gas; (b) reserve risk in respect to the quantity and quality of recoverable reserves;<br />
(c) market risk relating to the availability of transportation systems to move the product to<br />
market; (d) commodity price risk as oil and natural gas prices fluctuate due to market<br />
forces; (e) financial risks such as the Canadian/US dollar exchange rate, interest rates<br />
and debt service obligations; (f) environmental and safety risks associated with well and<br />
production facilities; and (g) changing government royalty legislation, income tax laws<br />
and incentive programs relating to the oil and gas industry.<br />
<strong>ARC</strong> ENERGY TRUST AR <strong>2001</strong>
PAGE 59<br />
MANAGEMENT’S DISCUSSION AND ANALYSIS<br />
The Trust’s policies and procedures to mitigate these risks include: (a)<br />
acquire mature production to reduce technical uncertainty; (b) acquire long-life reserves<br />
to ensure more stable production and to reduce the economic risks associated with<br />
commodity price cycles; (c) maintain a low cost structure to maximize product netbacks;<br />
(d) diversify properties to mitigate individual property risk; (e) seek to maintain a<br />
relatively balanced commodity exposure; (f) subject all property acquisitions to rigorous<br />
review; (g) closely monitor pricing trends and develop a mix of contractual<br />
arrangements for the marketing of products with credit worthy counterparties; (h)<br />
maintain a hedging program to hedge commodity prices and foreign currency rates with<br />
credit worthy counterparties; (i) continuously retain the services of technical experts<br />
when required; (j) ensure strong third-party operators for non-operated properties; (k)<br />
adhere to the Trust’s safety program and keep abreast of current operating practices; (l)<br />
carry insurance to cover losses and business interruption; and (m) establish and build<br />
cash resources to pay for future abandonment and site restoration costs.<br />
OUTLOOK<br />
It is the Trust’s objective to provide the highest possible long-term returns to<br />
unitholders, by focusing on the key strategic objective of the business plan which is to<br />
continue to achieve superior results as compared to other trusts and the oil and gas<br />
producing sector.<br />
The key future objectives of the business plan include:<br />
• annual reserve replacement;<br />
• ensuring acquisitions are strategic and enhance unitholder returns;<br />
• controlling costs – FD&A costs, operating costs and G&A expenses;<br />
• actively hedging a portion of the Trust’s production to enhance long-term returns and<br />
stabilize distributions;<br />
• conservative utilization of debt;<br />
• continuously developing the expertise of our staff and hire and retain the best in the<br />
industry;<br />
• building business relationships so as to be viewed as fair and equitable in all<br />
business dealings;<br />
• promoting the use of proven and effective technologies;<br />
• being an industry leader in the environmental, health and safety area; and<br />
• continuing to actively support local initiatives in the communities in which we operate<br />
and live.<br />
The fulfillment of these objectives should continue to generate superior<br />
returns to unitholders.<br />
<strong>ARC</strong> ENERGY TRUST AR <strong>2001</strong>
PAGE 60<br />
MANAGEMENT’S RESPONSIBILITY AND AUDITORS’ REPORT<br />
MANAGEMENT’S RESPONSIBILITY<br />
<strong>ARC</strong> <strong>Resources</strong> Management <strong>Ltd</strong>. (the “Manager”), as manager of <strong>ARC</strong> Energy Trust<br />
and <strong>ARC</strong> <strong>Resources</strong> <strong>Ltd</strong>., is responsible for the preparation of the accompanying consolidated<br />
financial statements. The statements have been prepared in accordance with the accounting<br />
policies detailed in the accounting policies note to the consolidated financial statements. In the<br />
Manager’s opinion, the consolidated financial statements are in accordance with generally<br />
accepted accounting principles, have been prepared within acceptable limits of materiality, and<br />
have utilized supportable reasonable estimates.<br />
Management maintains a system of internal controls to provide reasonable assurance<br />
that all assets are safeguarded, transactions are appropriately authorized and to facilitate the<br />
preparation of relevant, reliable and timely information.<br />
Arthur Andersen LLP, independent auditors appointed by the Trustee, has examined<br />
the consolidated financial statements of the Trust. The Audit Committee, consisting of the<br />
independent directors of <strong>ARC</strong> <strong>Resources</strong> <strong>Ltd</strong>., has reviewed these statements with management<br />
and the auditors, and has recommended them to the Board of Directors for approval. The Board<br />
has approved the consolidated financial statements of the Trust.<br />
JOHN P. DIELWART<br />
President and Chief Executive Officer<br />
STEVEN W. SINCLAIR<br />
Vice President Finance and Chief Financial Officer<br />
Calgary, Alberta<br />
February 7, 2002<br />
AUDITORS’ REPORT<br />
To the Unitholders of <strong>ARC</strong> Energy Trust,<br />
We have audited the consolidated balance sheet of <strong>ARC</strong> Energy Trust as at<br />
December 31, <strong>2001</strong> and 2000 and the consolidated statements of income and accumulated<br />
earnings, cash flows and cash distributions and accumulated cash distributions for the years then<br />
ended. These financial statements are the responsibility of the Trust’s management. Our<br />
responsibility is to express an opinion on these financial statements based on our audits.<br />
We conducted our audits in accordance with Canadian generally accepted auditing<br />
standards. Those standards require that we plan and perform an audit to obtain reasonable<br />
assurance whether the financial statements are free of material misstatement. An audit includes<br />
examining, on a test basis, evidence supporting the amounts and disclosures in the financial<br />
statements. An audit also includes assessing the accounting principles used and significant<br />
estimates made by management, as well as evaluating the overall financial statement presentation.<br />
In our opinion, these consolidated financial statements present fairly, in all material<br />
respects, the financial position of the Trust as at December 31, <strong>2001</strong> and 2000 and the results of<br />
its operations and its cash flows for the years then ended in accordance with Canadian generally<br />
accepted accounting principles.<br />
ARTHUR ANDERSEN LLP<br />
Chartered Accountants<br />
Calgary, Alberta<br />
February 7, 2002<br />
<strong>ARC</strong> ENERGY TRUST AR <strong>2001</strong>
PAGE 61<br />
CONSOLIDATED FINANCIAL STATEMENTS<br />
CONSOLIDATED BALANCE SHEET<br />
As at December 31<br />
(CDN$ thousands) <strong>2001</strong> 2000<br />
ASSETS<br />
Current assets<br />
Cash $ 646 $ 3,331<br />
Accounts receivable 51,875 43,260<br />
Prepaid expenses 6,030 5,553<br />
58,551 52,144<br />
Deferred foreign exchange translation loss (Note 6) 2,053 –<br />
Reclamation fund (Note 4) 10,147 9,897<br />
Property, plant and equipment (Notes 5 and 6) 1,311,306 600,813<br />
Total assets $ 1,382,057 $ 662,854<br />
LIABILITIES<br />
Current liabilities<br />
Accounts payable and accrued liabilities $ 35,595 $ 26,951<br />
Cash distributions payable 16,594 18,131<br />
Payable to the Manager (Note 11) 557 723<br />
52,746 45,805<br />
Long-term debt (Note 6) 294,489 115,068<br />
Deferred foreign exchange translation gain (Note 6) – 1,106<br />
Site reclamation and abandonment 28,837 18,620<br />
Commodity and foreign currency contracts (Notes 3 and 7) 13,107 –<br />
Future income taxes (Note 10) 174,703 –<br />
Total liabilities 563,882 180,599<br />
UNITHOLDERS’ EQUITY<br />
Unitholders’ capital (Note 8) 1,029,538 610,645<br />
Exchangeable shares (Note 8) 10,392 –<br />
Accumulated earnings 283,575 142,887<br />
Accumulated cash distributions (505,330) (271,277)<br />
Total unitholders’ equity 818,175 482,255<br />
Total liabilities and unitholders’ equity $ 1,382,057 $ 662,854<br />
See accompanying notes to consolidated financial statements<br />
Approval on behalf of the Board:<br />
MAC H. VAN WIELINGEN<br />
Director<br />
JOHN P. DIELWART<br />
Director<br />
<strong>ARC</strong> ENERGY TRUST AR <strong>2001</strong>
PAGE 62<br />
CONSOLIDATED FINANCIAL STATEMENTS<br />
CONSOLIDATED STATEMENT OF INCOME AND ACCUMULATED EARNINGS<br />
For the years ended December 31<br />
(CDN$ thousands, except per unit amounts) <strong>2001</strong> 2000<br />
Revenue<br />
Oil, natural gas, natural gas liquids and sulphur sales $ 515,458 $ 316,270<br />
Royalties (112,209) (64,188)<br />
403,249 252,082<br />
Expenses<br />
Operating 86,108 49,268<br />
General and administrative (Note 11) 11,812 6,956<br />
Management fee (Note 11) 8,789 6,193<br />
Interest on long-term debt (Note 6) 17,138 10,088<br />
Depletion, depreciation and amortization 165,050 68,494<br />
Capital taxes 1,794 211<br />
290,691 141,210<br />
Income before future income tax recovery 112,558 110,872<br />
Future income tax recovery (Note 10) 28,130 –<br />
Net income (Note 9) 140,688 110,872<br />
Accumulated earnings, beginning of year 142,887 32,015<br />
Accumulated earnings, end of year $ 283,575 $ 142,887<br />
Net income per unit (Note 9)<br />
Basic $ 1.38 $ 1.74<br />
Diluted $ 1.37 $ 1.72<br />
See accompanying notes to consolidated financial statements<br />
<strong>ARC</strong> ENERGY TRUST AR <strong>2001</strong>
PAGE 63<br />
CONSOLIDATED FINANCIAL STATEMENTS<br />
CONSOLIDATED STATEMENT OF CASH FLOWS<br />
For the years ended December 31<br />
(CDN$ thousands) <strong>2001</strong> 2000<br />
Cash flow from operating activities<br />
Net income $ 140,688 $ 110,872<br />
Add items not involving cash:<br />
Future income tax recovery (28,130) –<br />
Depletion, depreciation and amortization 165,050 68,494<br />
Amortization of commodity and foreign currency contracts (17,497) –<br />
Amortization of deferred foreign exchange (gain) loss 159 (17)<br />
260,270 179,349<br />
Change in non-cash working capital (6,399) (13,440)<br />
253,871 165,909<br />
Cash flow from financing activities<br />
Borrowing (repayments) of long-term debt, net 13,103 (78,673)<br />
Issue of Senior Secured Notes (Note 6) – 53,864<br />
Issue of Trust units 93,053 183,858<br />
Trust unit issue costs (4,654) (8,317)<br />
Cash distributions paid (235,590) (116,188)<br />
(134,088) 34,544<br />
Cash flow from investing activities<br />
Acquisition of Startech, net of cash received (Note 3) (7,970) –<br />
Acquisition of properties (32,686) (171,537)<br />
Proceeds on disposition of properties 19,775 22,441<br />
Purchase of capital assets (97,207) (53,848)<br />
Reclamation fund contributions and actual expenditures (4,380) (3,418)<br />
(122,468) (206,362)<br />
Decrease in cash (2,685) (5,909)<br />
Cash, beginning of year 3,331 9,240<br />
Cash, end of year $ 646 $ 3,331<br />
See accompanying notes to consolidated financial statements<br />
<strong>ARC</strong> ENERGY TRUST AR <strong>2001</strong>
PAGE 64<br />
CONSOLIDATED FINANCIAL STATEMENTS<br />
CONSOLIDATED STATEMENT OF CASH DISTRIBUTIONS AND<br />
ACCUMULATED CASH DISTRIBUTIONS<br />
For the years ended December 31<br />
(CDN$ thousands, except per unit amounts) <strong>2001</strong> 2000<br />
Net income $ 140,688 $ 110,872<br />
Future income tax recovery (28,130) –<br />
Depletion, depreciation and amortization 165,050 68,494<br />
Amortization of commodity and foreign currency contracts (17,497) –<br />
Amortization of deferred foreign exchange (gain) loss 159 (17)<br />
Cash from operations (Note 9) 260,270 179,349<br />
Cash from operations (99 per cent) 257,667 177,556<br />
Add (deduct):<br />
General and administrative reimbursement (residual one per cent) 2,603 1,793<br />
Capital expenditures (27,933) (23,331)<br />
Proceeds from disposition of royalty interests 19,775 17,614<br />
Discretionary debt repayment (19,775) (41,466)<br />
Reclamation fund contributions (4,095) (3,418)<br />
Current period accruals 5,811 210<br />
Cash distributions 234,053 128,958<br />
Accumulated cash distributions, beginning of year 271,277 142,319<br />
Accumulated cash distributions, end of year $ 505,330 $ 271,277<br />
Cash distributions per unit (Note 9) $ 2.31 $ 2.01<br />
See accompanying notes to consolidated financial statements<br />
<strong>ARC</strong> ENERGY TRUST AR <strong>2001</strong>
PAGE 65<br />
NOTES TO CONSOLIDATED FINANCIAL STATEMENTS<br />
NOTES TO THE CONSOLIDATED FINANCIAL STATEMENTS<br />
December 31, <strong>2001</strong> and 2000 (all tabular amounts in thousands, except per unit and volume amounts)<br />
1. STRUCTURE OF THE TRUST<br />
<strong>ARC</strong> Energy Trust (“the Trust”) was formed on May 7, 1996 pursuant to a trust indenture (the “Trust Indenture”).<br />
Computershare Trust Company of Canada was appointed as Trustee under the Trust Indenture. The beneficiaries<br />
of the Trust are the holders of the trust units.<br />
The Trust was created for the purposes of issuing trust units to the public and investing the funds so raised to<br />
purchase a royalty in the properties of <strong>ARC</strong> <strong>Resources</strong> <strong>Ltd</strong>. (“<strong>ARC</strong> <strong>Resources</strong>”). The Trust Indenture was amended<br />
on June 7, 1999 to convert the Trust from a closed-end to an open-ended investment trust. The Trust Indenture was<br />
most recently amended on May 23, 2000 to expand the scope of the business to include the investment in all types<br />
of energy business-related assets including, but not limited to, petroleum and natural gas-related assets, oil sands<br />
interests, electricity or power generating assets and pipeline, gathering, processing and transportation assets. The<br />
operations of the Trust consist of the acquisition, development, exploitation and disposition of these assets and the<br />
distribution of net cash proceeds from these activities to the unitholders.<br />
2. SUMMARY OF ACCOUNTING POLICIES<br />
The consolidated financial statements have been prepared by management following Canadian generally<br />
accepted accounting principles. The preparation of financial statements requires management to make estimates<br />
and assumptions that affect the reported amounts of assets and liabilities and the disclosure of contingencies at<br />
the date of the financial statements, and revenues and expenses during the reporting period. Actual results could<br />
differ from those estimated.<br />
In particular, the amounts recorded for depletion, depreciation and amortization of the petroleum and natural gas<br />
properties and for site reclamation and abandonment are based on estimates of reserves and future costs. By their<br />
nature, these estimates, and those related to future cash flows used to assess impairment, are subject to<br />
measurement uncertainty and the impact on the financial statements of future periods could be material.<br />
Principles of Consolidation<br />
The consolidated financial statements include the accounts of the Trust and its subsidiaries. All inter-entity<br />
transactions have been eliminated.<br />
Property, Plant and Equipment<br />
The Trust follows the full-cost method of accounting. All costs of acquiring petroleum and natural gas properties<br />
and related development costs are capitalized and accumulated in one cost centre. Maintenance and repairs are<br />
charged against income, and renewals and enhancements which extend the economic life of the property, plant<br />
and equipment are capitalized. Gains and losses are not recognized upon disposition of petroleum and natural<br />
gas properties unless such a disposition would alter the rate of depletion by 20 per cent or more.<br />
<strong>ARC</strong> ENERGY TRUST AR <strong>2001</strong>
PAGE 66<br />
NOTES TO CONSOLIDATED FINANCIAL STATEMENTS<br />
Depletion, Depreciation and Amortization<br />
Depletion of petroleum and natural gas properties and depreciation of production equipment, except for major gas<br />
plant facilities which are depreciated on a straight-line basis over their estimated useful lives, are calculated on the<br />
unit-of-production method based on:<br />
(a)<br />
(b)<br />
(c)<br />
total estimated proved reserves;<br />
total capitalized costs plus estimated future development costs of proved undeveloped reserves less<br />
estimated net realizable value of production equipment and facilities after the proved reserves are fully<br />
produced; and<br />
relative volumes of petroleum and natural gas reserves and production converted at the energy equivalent<br />
conversion ratio of six thousand cubic feet of natural gas to one barrel of oil.<br />
Ceiling Test<br />
The Trust places a limit on the aggregate carrying value of property, plant and equipment, which may be amortized<br />
against revenues of future periods (the “ceiling test”). The ceiling test is a cost recovery test whereby the<br />
capitalized costs less accumulated depletion, depreciation and amortization, site reclamation and abandonment<br />
and future income tax liabilities are limited to an amount equal to estimated undiscounted future net revenues from<br />
proved reserves less estimated recurring general and administrative expenses, future site reclamation and<br />
abandonment costs, management fees, future financing costs and income taxes.<br />
Future Site Reclamation and Abandonment<br />
Provisions for future site reclamation and abandonment costs are calculated on the unit-of-production method over<br />
the life of the petroleum and natural gas properties based on estimated proved developed and undeveloped<br />
reserves. Actual site reclamation costs incurred are charged against the site reclamation and abandonment<br />
liability.<br />
Unit-Based Compensation Plan<br />
The Trust has a unit-based compensation plan for employees, independent directors and long-term consultants,<br />
which is described in Note 8. No compensation expense is recognized when unit rights are issued. Any<br />
consideration received by the Trust on exercise of unit rights is credited to unitholders’ capital.<br />
Income Taxes<br />
The Trust follows the liability method of accounting for income taxes. Under this method, income tax liabilities and<br />
assets are recognized for the estimated tax consequences attributable to differences between the amounts<br />
reported in the financial statements of the Trust’s corporate subsidiaries and their respective tax base, using<br />
enacted income tax rates. The effect of a change in income tax rates on future tax liabilities and assets is<br />
recognized in income in the period in which the change occurs. Temporary differences arising on acquisitions<br />
result in future income tax assets and liabilities.<br />
The Trust is a taxable entity under the Income Tax Act (Canada) and is taxable only on income that is not distributed<br />
or distributable to the unitholders. As the Trust distributes all of its taxable income to the unitholders and meets the<br />
requirements of the Income Tax Act (Canada) applicable to the Trust, no provision for income taxes has been made<br />
in the Trust.<br />
Hedging<br />
The Trust uses derivative instruments to reduce its exposure to commodity price fluctuations. Gains and losses on<br />
these contracts, all of which constitute effective hedges, are recognized as a component of the related transaction.<br />
<strong>ARC</strong> ENERGY TRUST AR <strong>2001</strong>
PAGE 67<br />
NOTES TO CONSOLIDATED FINANCIAL STATEMENTS<br />
Foreign Currency Translation<br />
Monetary assets and liabilities denominated in a foreign currency are translated at the rate of exchange in effect<br />
at the balance sheet date. Revenues and expenses are translated at the monthly average rates of exchange.<br />
Translation gains and losses are included in income, except for unrealized gains and losses on long-term monetary<br />
items with a fixed or determinable life which are deferred and amortized to income over their remaining term.<br />
3. ACQUISITION<br />
Effective January 31, <strong>2001</strong>, the Trust acquired all of the issued and outstanding shares of Startech Energy Inc.<br />
(“Startech”). The transaction has been accounted for using the purchase method of accounting with the allocation<br />
of the purchase price and consideration paid as follows:<br />
Net assets acquired:<br />
Cash $ 12,319<br />
Working capital 1,770<br />
Property, plant and equipment 751,198<br />
Site reclamation liability (5,130)<br />
Commodity and foreign currency contracts (Note 8) (33,149)<br />
Future income taxes (203,171)<br />
Total net assets acquired $ 523,837<br />
Financed by:<br />
Cash $ 20,289<br />
Trust units issued 256,051<br />
Exchangeable shares issued 84,497<br />
Debt assumed 163,000<br />
Total purchase price $ 523,837<br />
4. RECLAMATION FUND<br />
<strong>2001</strong> 2000<br />
Balance, beginning of year $ 9,897 $ 7,165<br />
Contributions, net of actual expenditures (245) 2,274<br />
Interest earned on fund 495 458<br />
Balance, end of year $ 10,147 $ 9,897<br />
A reclamation fund was established to fund future site reclamation and abandonment costs. The Board has<br />
approved contributions over a 20-year period which results in minimum annual contributions of $3.6 million ($2.8<br />
million in 2000) based upon properties owned as at December 31, <strong>2001</strong>. Contributions to the reclamation fund<br />
have been deducted from the cash distributions to the unitholders. During the year, $3.8 million ($686,000 in 2000)<br />
of actual expenditures were charged against the reclamation fund.<br />
<strong>ARC</strong> ENERGY TRUST AR <strong>2001</strong>
PAGE 68<br />
NOTES TO CONSOLIDATED FINANCIAL STATEMENTS<br />
5. PROPERTY, PLANT AND EQUIPMENT<br />
<strong>2001</strong> 2000<br />
Property, plant and equipment, at cost $ 1,650,720 $ 784,393<br />
Accumulated depletion, depreciation and amortization (339,414) (183,580)<br />
Property, plant and equipment, net $ 1,311,306 $ 600,813<br />
The calculation of <strong>2001</strong> depletion, depreciation and amortization included an estimated $166.5 million ($140.8<br />
million in 2000) for future development costs associated with proved undeveloped reserves and excluded $12.0<br />
million ($12.0 million in 2000) for future net realizable value of production equipment and facilities and $22.3 million<br />
($5.7 million in 2000) for unproved properties.<br />
6. LONG-TERM DEBT<br />
<strong>2001</strong> 2000<br />
Revolving credit facilities $ 238,748 $ 62,645<br />
Senior Secured Notes (US$35 million) 55,741 52,423<br />
Total long-term debt $ 294,489 $ 115,068<br />
The Trust has four revolving credit facilities to a combined maximum of $350 million and US$35 million of Senior<br />
Secured Notes (the “Notes”).<br />
The revolving credit facilities each have a 364 day extendable revolving period and a two year term. Borrowings<br />
under the facilities bear interest at bank prime (4.0 per cent at December 31, <strong>2001</strong>) or, at the Trust’s option,<br />
bankers’ acceptance plus a stamping fee. The lenders review the credit facilities by April 30 each year and<br />
determine whether they will extend the revolving periods for another year. In the event that the revolving periods<br />
are not extended, the Trust will finance the required quarterly installments using existing long-term facilities.<br />
Collateral for the loans is in the form of floating charges on all lands and assignments and negative pledges on<br />
specific petroleum and natural gas properties.<br />
The Notes were issued during 2000 pursuant to an Uncommitted Master Shelf Agreement. The Notes bear interest<br />
at 8.05 per cent and require equal principal payments of US$7 million over a five year period commencing in 2004.<br />
Security for the Notes is in the form of floating charges on all lands and assignments. The Uncommitted Master<br />
Shelf Agreement allows for the issuance of an additional US$65 million of Notes at rates and maturity dates to be<br />
agreed upon at the date of issuance.<br />
The Trust has not hedged its foreign exchange exposure on the Notes. A foreign exchange translation loss of $2.1<br />
million was deferred at December 31, <strong>2001</strong> (gain of $1.1 million in 2000), and is being recognized over the term<br />
of the Notes.<br />
The payment of principal and interest are allowable deductions in the calculation of cash available for distribution<br />
to unitholders. Should the properties securing this debt generate insufficient revenue to repay the outstanding<br />
balances, the unitholders have no direct liability.<br />
Interest paid during the year did not differ significantly from interest expense.<br />
<strong>ARC</strong> ENERGY TRUST AR <strong>2001</strong>
PAGE 69<br />
NOTES TO CONSOLIDATED FINANCIAL STATEMENTS<br />
7. FINANCIAL INSTRUMENTS<br />
Financial instruments of the Trust carried on the balance sheet consist mainly of current assets, reclamation fund<br />
investments, current liabilities and long-term debt. As at December 31, <strong>2001</strong> and 2000, there were no significant<br />
differences between the carrying value of these financial instruments and their estimated fair value.<br />
Substantially all of the Trust’s accounts receivable are due from customers in the oil and gas industry and are<br />
subject to the normal industry credit risks. The carrying value of accounts receivable reflects management’s<br />
assessment of the associated credit risks.<br />
The Trust utilizes a variety of derivative instruments to reduce its exposure to changes in commodity prices and<br />
foreign exchange rates. The fair values of these derivative instruments are based on an estimate of the amounts<br />
that would have been received or paid to settle these instruments prior to maturity.<br />
The Trust is exposed to losses in the event of default by the counterparties to these derivative instruments. The<br />
Trust manages this risk by diversifying its derivative portfolio amongst a number of financially sound counterparties.<br />
Included in the total market value of all derivative instruments is a net gain of $1.8 million for contracts with one<br />
counterparty for which there is uncertainty with respect to the counterparty’s ability to fulfill the terms of the<br />
contracts.<br />
The following contracts were outstanding as at December 31, <strong>2001</strong>. Settlement of these contracts, which have no<br />
book value, would have resulted in a net receipt by the Trust of $13.0 million as at December 31, <strong>2001</strong>.<br />
Average<br />
Daily Contract Price<br />
Quantity Prices ($) (1) Index Term<br />
Crude oil fixed price contracts<br />
(embedded put option) (2) 2,000 bbls 42.91 (36.63) (2) WTI January 2002 – March 2002<br />
1,000 bbls 42.12 (35.80) (2) WTI April 2002 – December 2002<br />
Crude oil fixed price contracts<br />
(embedded double put option) (3) 2,000 bbls 41.81 (32.25) (3) WTI January 2002 – December 2002<br />
Crude oil fixed price contracts<br />
(embedded “cancel level”) (4) 10,000 bbls 40.17 (29.38) (4) WTI January 2002 – December 2002<br />
Crude oil call option 5,000 bbls 43.00 WTI January 2002 – December 2002<br />
Natural gas fixed price contracts 12,500 GJ 3.66 AECO January 2002 – March 2002<br />
10,000 GJ 3.62 AECO April 2002 – October 2002<br />
Natural gas collared contracts 5,000 GJ 3.50 – 5.64 AECO April 2002 – October 2002<br />
Natural gas put option<br />
(embedded 80 per cent put option) (5) 5,000 GJ 3.50 (3.50) (5) AECO January 2002 – March 2002<br />
Natural gas collared contract<br />
(embedded put option) (6) 10,000 GJ 3.50 – 4.00 (2.50) (6) AECO January 2002 – December 2002<br />
The Trust entered into a contract to fix the price of electricity on five megawatts per hour (“MW/h”) for the period<br />
April 17, <strong>2001</strong> through December 31, 2010 at a price of $63/MW/h. Settlement of this contract would have required<br />
a net payment by the Trust of $6.7 million as at December 31, <strong>2001</strong>.<br />
<strong>ARC</strong> ENERGY TRUST AR <strong>2001</strong>
PAGE 70<br />
NOTES TO CONSOLIDATED FINANCIAL STATEMENTS<br />
In addition to the contracts described on the preceding page, the following contracts, with a liability book value of<br />
$13.1 million, were outstanding as at December 31, <strong>2001</strong>. These contracts were acquired in conjunction with the<br />
Startech acquisition at which time the market value of the contracts was a net liability of $33.1 million. Settlement<br />
of these contracts would have resulted in a net receipt by the Trust of $6.5 million as at December 31, <strong>2001</strong>.<br />
Average<br />
Daily Contract Price<br />
Commodity Contracts Quantity Prices ($) (1) Index Term<br />
Crude oil fixed price contracts 5,000 bbls 37.53 WTI January 2002 – December 2002<br />
Natural gas fixed price contracts 20,750 GJ 4.92 AECO January 2002 – October 2002<br />
4,000 GJ 2.71 AECO November 2002 – October 2004<br />
750 GJ 3.49 San Juan January 2002 – October 2002<br />
1,500 GJ 3.79 Ventura January 2002 – October 2002<br />
Natural gas collared contracts 2,000 GJ 2.30 – 3.10 AECO January 2002 – October 2002<br />
Monthly Contract<br />
Average<br />
Foreign Currency Contracts Amount (US$000) Contract Rate Term<br />
Fixed rate foreign exchange<br />
contracts (sell) 2,000 1.4335 January 2002 – December 2002<br />
1,500 1.4106 January 2003 – December 2003<br />
(1) Commodity contracts denominated in US$ have been converted to CDN$ at the year end exchange rate.<br />
(2) Counterparty may exercise a put option if index falls below the specified price (as denoted in brackets) on a monthly settlement basis.<br />
(3) Counterparty may exercise a put option if index falls below the specified price (as denoted in brackets) on a monthly settlement basis. The put<br />
option is exercisable at $0.02/bbl for each $0.01/bbl that the index price falls below the specified price.<br />
(4) Contract is neutral if index falls below the “cancel level” price on a daily settlement basis.<br />
(5) Counterparty may exercise a put option at $3.50/GJ on 20 per cent of the contract volume if index is above the specified price on monthly<br />
settlement basis.<br />
(6) Counterparty may exercise a put option at $2.50/GJ if index falls below specified price on a monthly settlement basis.<br />
8. UNITHOLDERS’ CAPITAL<br />
On January 31, <strong>2001</strong>, the Trust issued 22.5 million trust units and 7.4 million exchangeable shares of <strong>ARC</strong><br />
<strong>Resources</strong> <strong>Ltd</strong>. at $11.36 per unit/exchangeable share for a total of $341 million as consideration for the Startech<br />
acquisition. The exchangeable shares can be converted (at the option of the holder) into trust units at any time on<br />
or after January 31, <strong>2001</strong>. The number of trust units issuable upon conversion is based upon the exchange ratio<br />
in effect at the conversion date. The exchange ratio is calculated monthly based on the cash distribution paid<br />
divided by the ten day weighted average unit price preceding the record date. The exchangeable shares are not<br />
eligible for distributions and, in the event that they are not converted, any outstanding shares are redeemable by<br />
the Trust on or after February 1, 2004 until February 1, 2010.<br />
During the year, 6,523,354 exchangeable shares were converted to trust units at an average exchange ratio of<br />
1.05277 trust units for each exchangeable share. At December 31, <strong>2001</strong>, the exchange ratio was 1.18422 to 1.<br />
<strong>ARC</strong> ENERGY TRUST AR <strong>2001</strong>
PAGE 71<br />
NOTES TO CONSOLIDATED FINANCIAL STATEMENTS<br />
On November 5, <strong>2001</strong>, the Trust issued 8,050,000 trust units at $11.00 per trust unit for net proceeds of<br />
$84,008,781 pursuant to a public offering prospectus dated October 29, <strong>2001</strong>.<br />
<strong>2001</strong> 2000<br />
Number of<br />
Number of<br />
Trust Units Trust Units $ Trust Units $<br />
Balance, beginning of year 72,524 610,645 53,607 432,690<br />
Issued on acquisition of Startech 22,540 256,051 – –<br />
Issued for cash 8,050 88,550 15,100 156,715<br />
Issued on conversion of exchangeable shares 6,867 74,105 – –<br />
Issued on exercise of warrants – – 3,471 26,791<br />
Issued on exercise of employee rights 571 4,191 266 1,976<br />
Distribution reinvestment program 57 650 80 790<br />
Trust unit issue costs – (4,654) – (8,317)<br />
Balance, end of year 110,609 1,029,538 72,524 610,645<br />
<strong>2001</strong> 2000<br />
Number of<br />
Number of<br />
Exchangeable Shares Shares $ Shares $<br />
Balance, beginning of year – – – –<br />
Issued on acquisition of Startech 7,438 84,497 – –<br />
Converted for trust units (6,523) (74,105) – –<br />
Balance, end of year 915 10,392 – –<br />
Exchange ratio, end of year 1.18422 – – –<br />
Trust units issuable upon conversion, end of year 1,083 10,392 – –<br />
Warrants which were issued upon the acquisition of Starcor Energy Royalty Fund and Orion Energy Trust in 1999<br />
expired in 2000. At December 31, 1999 there were 3,494,951 warrants outstanding of which 3,471,281 were<br />
exercised during 2000. The remaining 23,670 warrants which had not been exercised as at June 15, 2000 were<br />
cancelled.<br />
A Trust Unit Incentive Rights Plan (the “Plan”) was established in 1999 and replaced the existing option plan. All<br />
options previously granted under the former plan were cancelled. The Trust is authorized to grant up to 3,163,108<br />
rights to its employees, independent directors and long-term consultants to purchase trust units. The initial<br />
exercise price of rights granted under the plan may not be less than the current market price of the trust units as<br />
at the date of grant and the maximum term of each right is not to exceed ten years. The exercise price of the rights<br />
is to be adjusted downwards from time to time by the amount, if any, that distributions to unitholders in any calendar<br />
quarter exceed a percentage of the Trust’s net book value of property, plant and equipment (the “Excess<br />
Distribution”), as determined by the Trust.<br />
During the year, the Trust granted 1,509,517 rights (804,000 in 2000) to employees, independent directors and<br />
consultants to purchase trust units at exercise prices ranging from $10.49 to $12.70 per trust unit ($9.10 to $11.65<br />
in 2000). Rights granted under the plan generally have a five year term and vest equally over three years<br />
commencing on the first anniversary date of the grant. In accordance with the Plan, the exercise price of the rights<br />
granted was reduced as a result of calendar year distributions to unitholders exceeding 10 per cent of the Trust’s<br />
net book value of property, plant and equipment.<br />
<strong>ARC</strong> ENERGY TRUST AR <strong>2001</strong>
PAGE 72<br />
NOTES TO CONSOLIDATED FINANCIAL STATEMENTS<br />
A summary of the changes in rights outstanding under the plan is as follows:<br />
<strong>2001</strong> 2000<br />
Weighted<br />
Weighted<br />
Average<br />
Average<br />
Number of Exercise Number of Exercise<br />
Rights Price Rights Price<br />
Balance, beginning of year 1,722 $ 7.48 1,192 $ 7.86<br />
Granted 1,510 11.71 804 9.20<br />
Exercised (571) 7.34 (266) 7.43<br />
Cancelled (152) 9.69 (8) 7.86<br />
Balance before reduction of exercise price 2,509 9.92 1,722 8.55<br />
Reduction of exercise price – (0.87) – (1.07)<br />
Balance, end of year 2,509 $ 9.05 1,722 $ 7.48<br />
A summary of the plan as at December 31, <strong>2001</strong> is as follows:<br />
Exercise Price Adjusted Number of Rights Remaining Contractual Number of<br />
at Grant Date Exercise Price Outstanding Life of Right (years) Rights Exercisable<br />
$ 8.20 $ 5.66 541 2.3 159<br />
9.10 7.19 544 3.3 48<br />
11.65 10.21 10 3.8 3<br />
11.35 10.11 25 3.9 8<br />
11.30 10.27 10 4.0 –<br />
11.17 10.26 592 4.1 –<br />
12.47 11.85 582 4.3 –<br />
11.37 11.21 205 4.8 –<br />
$ 10.36 $ 9.05 2,509 3.8 218<br />
The Trust has adopted a Unitholders’ Rights Plan which provides for the issuance of additional trust units in certain<br />
events when one party acquires more than 20 per cent of the outstanding units of the Trust.<br />
9. NET INCOME AND CASH FLOW FROM OPERATIONS PER TRUST UNIT<br />
Net income and cash flow from operations per trust unit are as follows:<br />
<strong>2001</strong> 2000<br />
Net income<br />
Basic (1) $ 1.38 $ 1.74<br />
Diluted (2) 1.37 1.72<br />
Cash flow from operations (3)<br />
Basic (1) 2.55 2.82<br />
Diluted (2) 2.54 2.79<br />
(1) Basic per unit calculations are based on the weighted average number of trust units outstanding in <strong>2001</strong> of 101,979,000 (63,681,000 in 2000)<br />
which includes outstanding exchangeable shares converted at the average exchange ratio during the period.<br />
(2) Diluted calculations include 620,000 additional trust units in <strong>2001</strong> (623,000 additional trust units in 2000) for the dilutive impact of employee rights<br />
and warrants. There were no adjustments to net income or cash flow from operations in calculating diluted per share amounts.<br />
(3) Calculated by adding future income tax recovery, amortization of deferred foreign exchange translation gain/loss, amortization of commodity and<br />
foreign currency contracts, and depletion, depreciation and amortization to net income and dividing by the weighted average number of trust<br />
units.<br />
Cash distributions per trust unit reflect the sum of the per trust unit amounts paid monthly to unitholders.<br />
<strong>ARC</strong> ENERGY TRUST AR <strong>2001</strong>
PAGE 73<br />
NOTES TO CONSOLIDATED FINANCIAL STATEMENTS<br />
10. INCOME TAXES<br />
The tax provision differs from the amount computed by applying the combined Canadian federal and provincial<br />
income tax statutory rate to income before future income tax recovery as follows:<br />
<strong>2001</strong> 2000<br />
Income before future income tax recovery $ 112,558 $ 110,872<br />
Expected income tax expense at statutory rates 47,950 49,449<br />
Effect on income tax of:<br />
Net income of the Trust (72,852) (44,381)<br />
Effect of change in provincial tax rate (9,111) –<br />
Resource allowance (3,121) (7,982)<br />
Non-deductible crown charges 8,431 3,052<br />
Alberta Royalty Tax Credit (191) (231)<br />
Capital Tax 764 93<br />
Future income tax recovery $ (28,130) $ –<br />
The net future income tax liability is comprised of:<br />
<strong>2001</strong> 2000<br />
Future tax liabilities:<br />
Capital assets in excess of tax value $ 192,679 –<br />
Future tax assets:<br />
Attributed Canadian Royalty Income (5,165) –<br />
Future removal and site restoration costs (11,367) –<br />
Deductible share issue costs (1,444) –<br />
Net future income tax liability $ 174,703 –<br />
The petroleum and natural gas properties and facilities owned by the Trust’s corporate subsidiaries have an<br />
approximate tax basis of $203.6 million ($159.6 million in 2000) available for future use as deductions from taxable<br />
income. Included in this tax basis are non-capital loss carryforwards of $65.2 million ($8.1 million in 2000) which<br />
expire in the years through 2008.<br />
No current income taxes were paid or payable in <strong>2001</strong> or 2000.<br />
<strong>ARC</strong> ENERGY TRUST AR <strong>2001</strong>
PAGE 74<br />
NOTES TO CONSOLIDATED FINANCIAL STATEMENTS<br />
11. RELATED PARTY TRANSACTIONS<br />
Pursuant to a reorganization of the <strong>ARC</strong> Group of Companies on June 9, 2000, <strong>ARC</strong> Financial Corporation assigned<br />
its rights and obligations under the management agreement to <strong>ARC</strong> <strong>Resources</strong> Management <strong>Ltd</strong>. Fees payable to<br />
the Manager for management, advisory and administrative services include a fee equal to three per cent of net<br />
production revenue; and fees of 1.5 per cent, and 1.25 per cent of the purchase price of acquisitions and the net<br />
proceeds of dispositions, respectively. In <strong>2001</strong>, total acquisition and disposition fees paid or payable to the<br />
Manager were $7,926,798 ($2,680,000 in 2000). These fees are accounted for as either part of the purchase price<br />
or as a reduction of the proceeds of disposition of property, plant and equipment.<br />
During <strong>2001</strong>, the Manager was reimbursed $11,714,502 ($5,016,949 in 2000) for general and administrative<br />
expenses incurred on behalf of the Trust.<br />
12. CONTINGENCIES<br />
The Trust is involved in litigation and claims associated with normal operations, and is of the opinion that any<br />
resulting settlements would not materially affect its financial position or reported results of operations.<br />
13. DIFFERENCES BETWEEN CANADIAN AND UNITED STATES<br />
GENERALLY ACCEPTED ACCOUNTING PRINCIPLES<br />
The consolidated financial statements have been prepared in accordance with Canadian generally accepted<br />
accounting principles (“GAAP”), which differ in some respects to those in the United States. Any differences in<br />
accounting principles as they pertain to the accompanying consolidated financial statements are immaterial<br />
except as described below:<br />
The application of US GAAP would have the following effect on net income as reported:<br />
<strong>2001</strong> 2000<br />
Net income as reported $ 140,688 $ 110,872<br />
Adjustments (net of applicable income taxes):<br />
Write-down of property, plant and equipment (a) (110,635) –<br />
Depletion, depreciation and amortization (a) 10,338 10,646<br />
Unrealized gain on derivative instruments (d) 6,592 –<br />
Foreign exchange translation gain (loss) (b) (2,486) 1,106<br />
Unit based compensation (c) (4,474) (4,402)<br />
Net income under US GAAP $ 40,023 $ 118,222<br />
<strong>2001</strong> 2000<br />
Net income per trust unit under US GAAP<br />
Basic $ 0.39 $ 1.86<br />
Diluted 0.39 1.84<br />
<strong>2001</strong> 2000<br />
Comprehensive Income:<br />
Net income under US GAAP $ 40,023 $ 118,222<br />
Unrealized gain on derivative instruments<br />
(net of future income taxes of $6,125) 8,251 –<br />
Other comprehensive income (d) $ 48,274 $ 118,222<br />
<strong>ARC</strong> ENERGY TRUST AR <strong>2001</strong>
PAGE 75<br />
NOTES TO CONSOLIDATED FINANCIAL STATEMENTS<br />
The application of US GAAP would have the following effect on the consolidated balance sheets as reported:<br />
<strong>2001</strong> 2000<br />
Canadian US Canadian US<br />
GAAP GAAP GAAP GAAP<br />
Property, plant and equipment $ 1,311,306$ 1,091,432$ 600,813 $ 511,200<br />
Deferred foreign exchange translation loss 2,053 – – –<br />
Deferred foreign exchange translation gain – – (1,106) –<br />
Commodity and foreign currency contracts (13,107) 12,753 – –<br />
Future income taxes (174,703) (155,083) – –<br />
Unitholders’ capital (1,029,538) (1,038,849) (610,645) (615,482)<br />
Accumulated earnings (283,575) (89,566) (142,887) (49,543)<br />
Accumulated other comprehensive income – (8,251) – –<br />
The above noted differences between Canadian GAAP and US GAAP are the result of the following:<br />
(a)<br />
(b)<br />
(c)<br />
The Trust performs a cost recovery ceiling test for each cost centre which limits net capitalized costs to the<br />
undiscounted estimated future net revenue from proved oil and gas reserves plus the cost of unproved<br />
properties less impairment, using year end prices or average prices in that year if appropriate. In addition,<br />
the aggregate value of all cost centres is further limited by including financing costs, general and<br />
administrative expenses, future removal and site restoration costs and income taxes. Under US GAAP,<br />
companies using the full cost method of accounting for oil and gas producing activities perform a ceiling<br />
test on each cost centre using discounted estimated future net revenue from proved oil and gas reserves<br />
using a discount factor of 10 per cent. Prices used in the US GAAP ceiling tests are those in effect at year<br />
end and financing and general and administrative expenses are excluded from the calculation. The amounts<br />
recorded for depletion, and depreciation have been adjusted in the periods following the additional writedowns<br />
taken under US GAAP to reflect the impact of the reduction of depletable costs.<br />
US GAAP requires long-term debt denominated in foreign currencies to be translated at the rates of<br />
exchange in effect at the balance sheet date, with inclusion of the resulting gain or loss in the net income for<br />
the period. Canadian GAAP requires these gains or losses be deferred and amortized over the remaining<br />
term of the long-term debt.<br />
Under Canadian GAAP, compensation expense is not recognized for rights granted to or exercised by<br />
employees, directors and long-term consultants of the Trust under its Trust Unit Incentive Rights Plan. For<br />
US GAAP purposes, the Trust uses the intrinsic value method of accounting for rights issued to its<br />
employees, directors and long-term consultants who meet the definition of employees. As the exercise price<br />
of the rights is subject to downward revisions from time to time, the rights plan is a variable compensation<br />
plan. Accordingly, compensation expense is determined as the excess of the market price over the exercise<br />
price of the rights at the end of each reporting period and is deferred and recognized in income over the<br />
vesting period of the rights.<br />
<strong>ARC</strong> ENERGY TRUST AR <strong>2001</strong>
PAGE 76<br />
NOTES TO CONSOLIDATED FINANCIAL STATEMENTS<br />
(d) Effective January 1, <strong>2001</strong>, the Trust adopted Statement of Financial Accounting Standards (SFAS) No. 133,<br />
“Accounting for Derivative Instruments and Hedging Activities”. SFAS No. 133 establishes accounting and<br />
reporting standards requiring that all derivative instruments (including derivative instruments embedded in<br />
other contracts), as defined, be recorded on the balance sheet as either an asset or liability measured at fair<br />
value and requires that changes in fair value be recognized currently in earnings unless specific hedge<br />
accounting criteria are met. Hedge accounting treatment allows unrealized gains and losses to be deferred<br />
in other comprehensive income (for the effective portion of the hedge) until such time as the forecasted<br />
transaction occurs, and requires that a company formally document, designate, and assess the<br />
effectiveness of derivative instruments that receive hedge accounting treatment. Upon adoption, the Trust<br />
formally documented and designated all hedging relationships and verified that its hedging instruments<br />
were effective in offsetting changes in actual prices and rates received by the Trust. Certain contracts<br />
entered into during <strong>2001</strong> were not eligible for hedge accounting treatment under US GAAP and the change<br />
in fair value of these contracts has been reported in net income under US GAAP. Hedge effectiveness is<br />
monitored and any ineffectiveness is reported in the Consolidated Statement of Income.<br />
The Trust’s derivative positions consist of contracts entered into by the Trust and derivative positions assumed in<br />
conjunction with the Startech acquisition.<br />
On the transition date, the fair value of the Trust’s derivative instruments represented a net liability of $5.3 million.<br />
At December 31, <strong>2001</strong>, the fair value of the Trust’s derivative instruments represented a net liability of $5.2 million.<br />
On January 31, <strong>2001</strong>, the $33.1 million fair value of derivative positions assumed upon acquisition of Startech was<br />
recorded as a liability (see Note 3). At December 31, <strong>2001</strong>, the fair value of these derivative instruments<br />
represented a net asset of $6.5 million.<br />
A reconciliation of the components of accumulated other comprehensive income related to all derivative positions<br />
is as follows:<br />
Gross<br />
After-Tax<br />
Cumulative effect of change in accounting principle $ (5,251) $ (3,014)<br />
Reclassification of net realized losses into earnings (6,969) (4,000)<br />
Net change in fair value of derivative instruments 26,596 15,265<br />
Accumulated other comprehensive income related<br />
to derivatives at December 31, <strong>2001</strong> $ 14,376 $ 8,251<br />
<strong>ARC</strong> ENERGY TRUST AR <strong>2001</strong>
PAGE 77<br />
HISTORICAL REVIEW<br />
HISTORICAL REVIEW<br />
Years ended December 31<br />
($ thousands, except per unit amounts) <strong>2001</strong> 2000 1999 1998 1997<br />
FINANCIAL<br />
Revenue before royalties 515,458 316,270 155,191 67,124 74,103<br />
Per unit $ 5.05 $ 4.97 $ 3.34 $ 2.62 $ 3.24<br />
Cash flow 260,270 179,349 80,814 30,040 37,757<br />
Per unit $ 2.55 $ 2.82 $ 1.74 $ 1.17 $ 1.65<br />
Net income 140,688 110,872 29,835 (14,093) 9,165<br />
Per unit $ 1.38 $ 1.74 $ 0.64 $ (0.55) $ 0.40<br />
Cash distributions 234,053 128,958 63,773 30,724 33,242<br />
Per unit* $ 2.31 $ 2.01 $ 1.35 $ 1.20 $ 1.40<br />
Working capital 5,805 6,339 15,761 (1,688) 4,647<br />
Long-term debt 294,489 115,068 141,000 72,499 65,955<br />
Unitholders’ equity 818,175 482,255 324,010 167,323 212,140<br />
Weighted average units (thousands) 101,979 63,681 46,480 25,604 22,837<br />
Trust units and units reserved for Exchangeable<br />
Shares outstanding at year-end (thousands) 111,692 72,524 53,607 25,604 25,604<br />
*Based on the number of units outstanding at each cash distribution date<br />
OPERATING<br />
Production<br />
Crude oil (bbl/d) 20,408 11,528 8,408 4,439 3,656<br />
Natural gas (mmcf/d) 115.15 77.17 66.46 37.68 38.40<br />
Natural gas liquids (bbl/d) 3,511 2,965 2,687 2,018 1,929<br />
Total (boe/d) 43,111 27,355 22,172 12,737 11,985<br />
Average prices<br />
Crude oil ($/bbl) 31.70 36.74 24.85 18.99 26.35<br />
Natural gas ($/mcf) 5.72 4.48 2.54 1.93 1.82<br />
Natural gas liquids ($/bbl) 31.03 31.52 17.43 13.17 18.27<br />
Oil equivalent ($/boe) 32.76 31.59 19.15 14.41 16.81<br />
Established (proved plus risked probable) reserves<br />
Crude oil and NGL (mbbl) 114,243 82,419 59,712 35,034 32,373<br />
Natural gas (bcf) 385.5 286.4 241 121.9 148.2<br />
Total (mboe) 178,496 130,147 99,879 55,351 57,073<br />
TRUST UNIT TRADING (based on daily closing price)<br />
Prices ($)<br />
High 13.50 12.15 9.25 11.40 13.00<br />
Low 10.41 8.45 6.15 6.10 10.15<br />
Close 12.10 11.30 8.75 6.15 10.45<br />
Average daily volume (thousands) 414 155 68 32 55<br />
<strong>ARC</strong> ENERGY TRUST AR <strong>2001</strong>
PAGE 78<br />
QUARTERLY REVIEW<br />
QUARTERLY REVIEW<br />
<strong>2001</strong> 2000<br />
($ thousands, except per unit amounts) 4Q 3Q 2Q 1Q 4Q 3Q 2Q 1Q<br />
FINANCIAL<br />
Revenue before royalties 102,518 116,281 132,283 164,376 106,374 77,326 78,124 54,446<br />
Per unit $ 0.94 $ 1.12 $ 1.29 $ 1.77 $ 1.54 $ 1.21 $ 1.25 $ 0.97<br />
Cash flow 49,032 54,479 67,478 89,281 61,337 40,362 46,164 31,486<br />
Per unit $ 0.45 $ 0.53 $ 0.66 $ 0.96 $ 0.89 $ 0.63 $ 0.74 $ 0.56<br />
Net income 12,444 32,474 40,025 55,745 41,752 22,702 28,947 17,471<br />
Per unit $ 0.11 $ 0.31 $ 0.39 $ 0.60 $ 0.61 $ 0.36 $ 0.46 $ 0.31<br />
Cash distributions 48,537 60,813 65,938 58,765 42,789 33,173 28,066 24,930<br />
Per unit* $ 0.45 $ 0.60 $ 0.66 $ 0.60 $ 0.59 $ 0.52 $ 0.45 $ 0.45<br />
Working capital 5,805 – 3,617 9,978 6,339 5,253 17,320 9,897<br />
Long-term debt 294,489 338,135 287,012 280,837 115,068 189,777 189,935 95,000<br />
Unitholders’ equity 818,175 769,494 796,831 819,710 482,255 387,049 396,574 372,523<br />
Weighted average<br />
units (thousands) 108,585 103,449 102,942 92,941 71,577 63,791 62,303 56,107<br />
Trust units outstanding and units<br />
reserved for Exchangeable<br />
Shares at quarter-end 111,692 103,523 103,249 102,692 72,524 63,809 63,684 60,486<br />
*Based on the number of units outstanding at each cash distribution date<br />
OPERATING<br />
Production<br />
Crude oil (bbl/d) 20,753 20,066 20,202 20,614 12,748 12,240 12,492 8,661<br />
Natural gas (mmcf/d) 117.45 109.50 112.82 120.90 86.26 79.22 76.55 69.30<br />
Natural gas liquids (bbl/d) 3,706 3,740 3,090 3,502 3,136 3,053 2,903 2,761<br />
Total (boe/d) 44,034 42,056 42,097 44,271 30,261 28,496 28,153 22,972<br />
Average prices<br />
Crude oil ($/bbl) 27.33 33.27 33.79 32.57 39.11 34.08 37.15 36.19<br />
Natural gas ($/mcf) 4.04 4.45 5.86 8.45 6.46 4.22 3.95 2.98<br />
Natural gas liquids ($/bbl) 22.20 29.61 35.95 38.12 37.56 29.75 30.91 27.24<br />
Oil equivalent ($/boe) 25.31 30.05 34.53 41.26 38.78 29.56 30.41 25.91<br />
TRUST UNIT TRADING (based on daily closing price)<br />
Prices ($)<br />
High 12.10 12.59 13.50 11.89 10.60 12.15 10.95 9.20<br />
Low 10.49 10.41 10.85 11.00 11.65 10.15 8.65 8.55<br />
Close 12.10 10.61 11.55 11.24 11.30 11.30 10.80 8.75<br />
Average daily volume (thousands) 316 391 447 499 189 143 194 88<br />
<strong>ARC</strong> ENERGY TRUST AR <strong>2001</strong>
PAGE 79<br />
DIRECTORS AND OFFICERS<br />
DIRECTORS AND OFFICERS<br />
DIRECTORS<br />
John M. Beddome, B.Sc. Chem. Eng.<br />
Mr. Beddome has been responsible for many significant projects in oil and gas<br />
exploration, production, transportation and processing during a career that included<br />
assignments as President of Dome Petroleum <strong>Ltd</strong>., Chairman of TransCanada Pipelines<br />
<strong>Ltd</strong>., CEO of Alberta Natural Gas Company <strong>Ltd</strong>. and other executive positions in the<br />
industry. Now an independent businessman and consultant, Mr. Beddome recently retired<br />
as a Director of PanCanadian Petroleum <strong>Ltd</strong>. and Chairman of IPSCO Steel Inc. Mr.<br />
Beddome is a member of the Association of Professional Engineers, Geologists and<br />
Geophysicists of Alberta. Mr. Beddome has been a Director of <strong>ARC</strong> since 1996.<br />
Fred C. Coles, B. Sc., P.Eng.<br />
Mr. Coles is the Executive Chairman of Applied Terravision Systems Inc. and<br />
had previously served as a reservoir engineer for a number of oil and gas companies prior<br />
to achieving the role of Chairman and President of an engineering consulting firm<br />
specializing in oil and gas. Mr. Coles also sits as a Director of a number of junior oil and<br />
gas companies. Mr. Coles is a member of the Association for Professional Engineers,<br />
Geologists, and Geophysicists of Alberta and the Canadian Institute of Mining Metallurgy<br />
and Petroleum. Mr. Coles has been a Director of <strong>ARC</strong> since 1996.<br />
Walter DeBoni, P.Eng., MBA<br />
Mr. DeBoni has held numerous top executive posts in the oil and gas industry<br />
with major corporations. He holds a B.A.Sc. Chem. Eng. from the University of British<br />
Columbia, a MBA degree with a major in Finance from the University of Calgary and is a<br />
graduate of the Harvard University Advanced Management Program. Mr. DeBoni is a<br />
member of the Association of Professional Engineers, Geologists and Geophysicists of<br />
Alberta and the Society of Petroleum Engineers. He is a past Chairman of The Petroleum<br />
Society of CIM and a past Director of the Society of Petroleum Engineers. He is Vice-<br />
Chairman and a Director of Bow Valley Energy <strong>Ltd</strong>. Mr. DeBoni has been a Director of<br />
<strong>ARC</strong> since 1996.<br />
<strong>ARC</strong> ENERGY TRUST AR <strong>2001</strong>
PAGE 80<br />
DIRECTORS AND OFFICERS<br />
John P. Dielwart, P.Eng.<br />
Mr. Dielwart is President and CEO of <strong>ARC</strong> <strong>Resources</strong> <strong>Ltd</strong>. and has overseen<br />
the growth of <strong>ARC</strong> Energy Trust from its inception in 1996. Previously Mr. Dielwart was a<br />
Senior Vice-President and Director of Coles Gilbert Associates <strong>Ltd</strong>., a major Calgarybased<br />
oil and gas independent engineering consulting firm. Mr. Dielwart is a past<br />
member of the Board of Governors of the Canadian Association of Petroleum Producers<br />
(CAPP) and a member of the CAPP Executive Committee for 2000-<strong>2001</strong>. Mr. Dielwart is a<br />
member of the Association of Professional Engineers, Geologists, and Geophysicists of<br />
Alberta, the Society of Petroleum Engineers and the Society of Petroleum Evaluation<br />
Engineers. He holds a B.Sc. with Distinction from the University of Calgary and has been<br />
a Director of <strong>ARC</strong> since 1996.<br />
Michael M. Kanovsky, B.Sc., P.Eng., MBA<br />
Mr. Kanovsky graduated from Queen’s University and the Ivey School<br />
of Business. Mr. Kanovsky’s business career included the position of VP of Corporate<br />
Finance with a major Canadian investment dealer followed by co-founding Northstar<br />
Energy Corporation and PowerLink Corporation (electrical cogeneration) where he<br />
served as Senior Executive Board Chariman and Director. Mr. Kanovsky is a Director of<br />
Bonavista Petroleum Inc. and Devon Energy Corporation. He has been a Director of <strong>ARC</strong><br />
since 1996.<br />
John M. Stewart, B.Sc., MBA<br />
Mr. Stewart is a Director of <strong>ARC</strong> <strong>Resources</strong> <strong>Ltd</strong>. and Vice-Chairman and a<br />
founder of <strong>ARC</strong> Financial Corporation. Mr. Stewart holds senior executive responsibilities<br />
focused primarily within the area of private equity investment management. He holds a<br />
B.Sc. in Engineering from the University of Calgary and a MBA from the University of<br />
British Columbia. Prior to <strong>ARC</strong> Financial, he was a Director and Vice-President of a major<br />
national investment firm. His career and experience span nearly thirty years with a focus<br />
on oil and gas and finance. Mr. Stewart has been a Director of <strong>ARC</strong> since 1996.<br />
Mac H. Van Wielingen<br />
Mr. Van Wielingen serves as Vice-Chairman and Director of <strong>ARC</strong> <strong>Resources</strong><br />
<strong>Ltd</strong>. and is Chairman and a founder of <strong>ARC</strong> Financial Corporation. Previously Mr. Van<br />
Wielingen was a Senior Vice-President and Director of a major national investment dealer<br />
responsible for all corporate finance activities in Alberta. He has managed numerous<br />
significant corporate merger and acquisition transactions, capital raising projects and<br />
equity investments relating to the energy sector. Mr. Van Wielingen has been a Director of<br />
<strong>ARC</strong> since its formation in 1996. Mr. Van Wielingen holds an Honours Business Degree<br />
from the University of Western Ontario Business School and has studied post-graduate<br />
Economics at Harvard University.<br />
<strong>ARC</strong> ENERGY TRUST AR <strong>2001</strong>
PAGE 81<br />
DIRECTORS AND OFFICERS<br />
OFFICERS<br />
In addition to John Dielwart who is a director and officer, the officers of <strong>ARC</strong><br />
<strong>Resources</strong> are:<br />
Doug J. Bonner, P.Eng.<br />
Mr. Bonner is Vice-President, Engineering of <strong>ARC</strong> <strong>Resources</strong> <strong>Ltd</strong>. and is<br />
responsible for all exploitation and development activities. He holds a B.Sc. in Geological<br />
Engineering from the University of Manitoba. Mr. Bonner’s major area of expertise is<br />
reservoir engineering and he has extensive technical knowledge of oil and natural gas<br />
fields throughout western Canada, the east coast and northern Canada. Prior to joining<br />
<strong>ARC</strong> in 1996, Mr. Bonner spent 18 years with various major oil and natural gas companies<br />
in positions of increasing responsibility.<br />
David P. Carey, P.Eng., MBA<br />
Mr. Carey is Vice-President, Business Development of <strong>ARC</strong> <strong>Resources</strong> <strong>Ltd</strong>.<br />
and is responsible for all facets of business development and investor relations. He holds<br />
both a B.Sc. in Geological Engineering and a MBA from Queen’s University. Mr. Carey<br />
brings 20 years of diverse experience in the Canadian and International energy industries<br />
covering exploration, production and project evaluations in western Canada, oilsands, the<br />
Canadian frontiers and internationally. Prior to joining <strong>ARC</strong> <strong>Resources</strong> in <strong>2001</strong>, Mr. Carey<br />
held senior positions with Athabasca Oil Sands Investments Inc. and a major Canadian<br />
oil and gas company.<br />
Susan D. Healy, P. Land<br />
Ms. Healy is Vice-President, Land of <strong>ARC</strong> <strong>Resources</strong> <strong>Ltd</strong>. and is responsible<br />
for all of <strong>ARC</strong>’s land-related activities. Prior to joining <strong>ARC</strong> <strong>Resources</strong> <strong>Ltd</strong>. in 1996, Ms.<br />
Healy had over 17 years industry experience with the most recent nine years with a senior<br />
oil and gas exploration and development company.<br />
Steven W. Sinclair, B. Comm., CA<br />
Mr. Sinclair is Vice-President Finance and Chief Financial Officer of <strong>ARC</strong><br />
<strong>Resources</strong> <strong>Ltd</strong>. and oversees all of the financial affairs of <strong>ARC</strong> Energy Trust. Mr. Sinclair<br />
has a Bachelor of Commerce from the University of Calgary, obtained his Chartered<br />
Accountant’s designation in 1981 and has over 20 years experience within the finance,<br />
accounting and taxation areas of the oil and gas industry.<br />
Myron M. Stadnyk, P.Eng.<br />
Mr. Stadnyk is Vice-President, Operations of <strong>ARC</strong> <strong>Resources</strong> <strong>Ltd</strong>. and is<br />
responsible for all of <strong>ARC</strong>’s operational activities. He has 16 years experience in all aspects<br />
of oil and gas production operations. Prior to joining <strong>ARC</strong> <strong>Resources</strong> <strong>Ltd</strong>., Mr. Stadnyk<br />
worked with a major oil and gas company in both domestic and international operations and<br />
oil and gas facility design and construction. He has a B. Sc. in Mechanical Engineering and<br />
is a member of the Association of Professional Engineers in Alberta and Saskatchewan.<br />
Allan R. Twa, Q.C.<br />
A member of the Alberta Bar since 1971, Mr. Twa is a partner in the law firm<br />
Burnet, Duckworth & Palmer LLP. Mr. Twa holds a B.A. (Political Science) from the<br />
University of Calgary, a LL.B. from the University of Alberta and a LL.M. from the<br />
University of London, England. Over the last 25 years, Mr. Twa has been engaged in a<br />
legal practice involving legal administration of public companies and trusts, corporate<br />
finance, and mergers and acquisitions. Mr. Twa is the Corporate Secretary.<br />
<strong>ARC</strong> ENERGY TRUST AR <strong>2001</strong>
PAGE 82<br />
CORPORATE GOVERNANCE<br />
CORPORATE GOVERNANCE<br />
In 1995, the Toronto Stock Exchange (the “TSE”) adopted a set of guidelines<br />
(the “Guidelines”), which were revised in 1999, relating to corporate governance<br />
matters. The Guidelines address such matters as the constitution and independence of<br />
boards of directors, the functions to be performed by boards and their committees, and<br />
the relationship among a corporation’s board, management and shareholders.<br />
Set out below is a selection of the highlights of the Trust’s corporate<br />
governance practices which have been established by the terms of the Trust Indenture,<br />
Shareholder Agreement and Management Agreement and, as such, have been<br />
approved by the Board of Directors of <strong>ARC</strong> <strong>Resources</strong>. The complete text of the Trust’s<br />
corporate governance practices can be found in the management proxy circular.<br />
MANDATE OF THE BOARD OF <strong>ARC</strong> RESOURCES<br />
The Board of Directors of <strong>ARC</strong> <strong>Resources</strong> has a mandate to supervise the<br />
management of the business and affairs of the Trust and <strong>ARC</strong> <strong>Resources</strong> and to act with<br />
a view to the best interests of the Trust and <strong>ARC</strong> <strong>Resources</strong>. Although the Manager<br />
provides certain advisory and management services to <strong>ARC</strong> <strong>Resources</strong> pursuant to the<br />
Management Agreement, the Board of Directors of <strong>ARC</strong> <strong>Resources</strong> supervises the<br />
management of the business and affairs of <strong>ARC</strong> <strong>Resources</strong>.<br />
The Board of Directors' mandate includes: (a) the responsibility for managing<br />
its own affairs; (b) monitoring of management of the Trust; (c) reviewing strategic<br />
operating, capital and financial plans; (d) monitoring of activities of the Trust; and (e)<br />
compliance reporting and corporate communications.<br />
In particular, significant operational decisions and all decisions relating to:<br />
(i) the acquisition and disposition of properties for a purchase price or proceeds in<br />
excess of $10 million; (ii) the approval of capital expenditure budgets; and (iii)<br />
establishment of credit facilities are made by the Board of Directors of <strong>ARC</strong> <strong>Resources</strong>.<br />
<strong>ARC</strong> ENERGY TRUST AR <strong>2001</strong>
PAGE 83<br />
CORPORATE GOVERNANCE<br />
In addition, the Trustee has delegated certain matters to the Board of Directors<br />
of <strong>ARC</strong> <strong>Resources</strong> including all decisions relating to: (i) issuances of additional trust units;<br />
and (ii) the determination of the amount of distributable income. Any amendment to the<br />
Management Agreement or the Royalty Agreement between <strong>ARC</strong> <strong>Resources</strong> and the<br />
Trust requires the approval of the Board of Directors of <strong>ARC</strong> <strong>Resources</strong> on behalf of the<br />
Trust.<br />
The Board of Directors of <strong>ARC</strong> <strong>Resources</strong> holds regularly scheduled meetings<br />
at least quarterly to review the business and affairs of <strong>ARC</strong> <strong>Resources</strong> and make any<br />
necessary decisions relating thereto.<br />
BOARD COMPOSITION<br />
The Board of Directors is presently comprised of seven members, four of whom<br />
are “unrelated directors” within the meaning of the TSE Guidelines.<br />
COMMITTEES<br />
The Board of Directors has established an audit committee comprised of the<br />
four unrelated directors, a reserve audit committee comprised of two unrelated directors<br />
and a compensation committee comprised of three unrelated directors.<br />
<strong>ARC</strong> ENERGY TRUST AR <strong>2001</strong>
PAGE 84<br />
CORPORATE AND UNITHOLDER INFORMATION<br />
CORPORATE AND UNITHOLDER INFORMATION<br />
DIRECTORS<br />
Walter DeBoni (1) (3)<br />
Chairman<br />
Mac H. Van Wielingen<br />
Vice-Chairman<br />
John P. Dielwart<br />
President and Chief Executive Officer<br />
John M. Beddome (1) (3)<br />
Frederic C. Coles (1) (2) (3)<br />
Michael M. Kanovsky (1) (2)<br />
John M. Stewart<br />
(1) Member of Audit Committee<br />
(2) Member of Reserve Audit Committee<br />
(3) Member of Compensation Committee<br />
OFFICERS<br />
John P. Dielwart<br />
President and Chief Executive Officer<br />
Steven W. Sinclair<br />
Vice-President, Finance and<br />
Chief Financial Officer<br />
Susan D. Healy<br />
Vice-President, Land<br />
Doug J. Bonner<br />
Vice-President, Engineering<br />
Myron M. Stadnyk<br />
Vice-President, Operations<br />
David P. Carey<br />
Vice-President, Business Development<br />
Allan R. Twa<br />
Corporate Secretary<br />
EXECUTIVE OFFICE<br />
<strong>ARC</strong> <strong>Resources</strong> <strong>Ltd</strong>.<br />
2100, 440 – 2 Avenue S.W.<br />
Calgary, Alberta T2P 5E9<br />
Telephone: (403) 503-8600<br />
Toll Free: 1-888-272-4900<br />
Facsimile: (403) 503-8609<br />
Website: www.arcresources.com<br />
Email:<br />
arc_energy_trust@arcresources.com<br />
TRUSTEE AND<br />
TRANSFER AGENT<br />
Computershare Trust Company<br />
of Canada and Montreal Trust<br />
Company of Canada<br />
600, 530 – 8 Avenue S.W.<br />
Calgary, Alberta T2P 3S8<br />
Telephone: (403) 267-6800<br />
AUDITORS<br />
Arthur Andersen LLP<br />
Calgary, Alberta<br />
ENGINEERING<br />
CONSULTANTS<br />
Gilbert Laustsen Jung Associates <strong>Ltd</strong>.<br />
Calgary, Alberta<br />
LEGAL COUNSEL<br />
Burnet, Duckworth & Palmer LLP<br />
Calgary, Alberta<br />
STOCK EXCHANGE<br />
LISTING<br />
The Toronto Stock Exchange<br />
Trading Symbols:<br />
AET.UN (trust units)<br />
ARX (Exchangeable Shares)<br />
INVESTOR INFORMATION<br />
Visit our website<br />
www.arcresources.com<br />
or contact:<br />
Investor Relations<br />
(403) 509-6418 or<br />
1-888-272-4900 (Toll Free)<br />
NOTICE OF ANNUAL AND<br />
SPECIAL MEETING<br />
The <strong>Annual</strong> and Special Meeting<br />
will be held on April 10, 2002 at<br />
3:30 pm in the Belair Room at<br />
the Westin Hotel, 320 – 4 Avenue<br />
S.W., Calgary, Alberta.<br />
DISTRIBUTION<br />
REINVESTMENT AND<br />
OPTIONAL CASH<br />
PAYMENT PROGRAM<br />
New <strong>ARC</strong> Energy Trust unitholders<br />
should be aware of the Distribution<br />
Reinvestment Plan (DRIP) under which a<br />
unitholder can elect to reinvest cash<br />
distributions into new <strong>ARC</strong> Energy Trust<br />
units. If distributions are reinvested, a<br />
unitholder can elect to make optional<br />
cash payments under the DRIP to<br />
acquire up to $3,000 of additional trust<br />
units per distribution date. All units<br />
purchased under the DRIP are made at<br />
prevailing market prices without any<br />
additional fees or commissions. For<br />
further details on the DRIP contact<br />
Computershare.<br />
CORPORATE CALENDAR<br />
Announcement on or before:<br />
2002<br />
April 10 <strong>Annual</strong> Meeting<br />
April 18 Announcement of<br />
2002 Q2<br />
Distribution Monthly<br />
Amounts<br />
May 8 2002 Q1 Results<br />
July 18 Announcement of<br />
2002 Q3 Distribution<br />
Monthly Amounts<br />
August 21 2002 Q2 Results<br />
October 17 Announcement of<br />
2002 Q4 Distribution<br />
Monthly Amounts<br />
November 8 2002 Q3 Results<br />
2003<br />
January 16<br />
February 14<br />
Announcement of<br />
2003 Q1 Distribution<br />
Monthly Amounts<br />
2002 Financial Results<br />
<strong>ARC</strong> ENERGY TRUST AR <strong>2001</strong>
THE PEOPLE OF <strong>ARC</strong> ENERGY TRUST WHO CONTRIBUTED TO OUR SUCCESS IN <strong>2001</strong> AND THE YEARS<br />
THEY JOINED THE COMPANY<br />
PRE-1996 JOHN DIELWART<br />
* GAYLE COSGROVE * 1996 DOUG BONNER * SUSAN HEALY STEVEN SINCLAIR<br />
*<br />
* JOCELYN FORD * VERNA MAH * ELIZABETH MARSHALL * 1997 MYRON STADNYK * JAYNA BARRIE *<br />
WENDY BRUNEAU<br />
* DARIN DELEEUW * TED DOHERTY * DEBRA HARDEN * DILYS LUK * DON MCLEAN *<br />
DIANA MEADS<br />
* ERWIN MELESKO * MARK MOIR * SABINE MUELLER * ROBERT NEWBERRY * LES REDER *<br />
MARK REID<br />
* ALLAN ROBERTS * VESTA SHIPLACK * MARTINA SKVARIL * RANDY SONNENBERG LISA VAN<br />
*<br />
* 1998 SHIRLEY HAIST * KELLY HASKELL * DAVE HUDSON * JOHN MCMULLEN * KAREN ROE * JOE<br />
STRAKA<br />
* 1999 BRYON BARTON * STEVEN BRACE * ANNETTE BROCK * DALE CADIEUX * CURTIS CEASOR *<br />
MILES CHAPIN<br />
* DEAN CHAPMAN * GAY CHERVINSKI * JACQUELINE CONNERY * VAN DAFOE BRUCE DONALD<br />
*<br />
* LES ENGMAN * DAN GEREMIA * NELLIE GRAVES * BRENDA GREEN * STEWART HANSON *<br />
LAURIE HELLWIG<br />
* THOMAS HOUSMAN * WILF JOHNSON * KEVIN JONES * DWAINE KORSBREK *<br />
TERRY KRAWEC<br />
* SHAWN LELEK * DEB LEMKE * WAYNE LENTZ * MILT MANSELL * KEN MCKELLAR *<br />
BARBARA METTLER-JORDAN<br />
* STEPHEN MICHALSKY * HELEN O’BRIEN * NATASHA PAWLUK * DEAN<br />
POTTER<br />
* SCOTT SEWALL * JANEY SLENO * DAVID SORKILMO * CORY STEWART * WENDY TEARE * PETE<br />
TINDALL<br />
* REO VAN MAARION * JAY WILLIAMSON * 2000 TERRY ANDERSON * CHARLENE BAGU *<br />
LELAND BAZIN<br />
* RANDY BIRNIE-BROWNE * JULIE BOLTER * LORI BRIGLEY * ROLAND CARON * DEAN<br />
EVANS<br />
* MARILYN GARDENER * GEORGE GERVAIS * JOHN GOLBY * DAVE GOURLAY * LORNA HAASE *<br />
BRUCE HALL<br />
* GORDON HALLGREN * DAVID HARRIS * LAWRENCE HAUGEN * DORIS IVERS * JASON<br />
KALUSKI<br />
* LAURA LOCKHART * ROBERT MEADS * HARVEY PHILLIPS * TREVOR RICHELS * PERRY ROY *<br />
LESLEY SAMBU<br />
* KENNETH SAMPSON * MARIA SEDGWICK * PAMELA MAY STRAKA BART THISTLETHWAITE<br />
*<br />
* BRADLEY TURNBULL * <strong>2001</strong> DAVID CAREY * CASSANDRA ANDREWS * LES AVERY * SAM BAILLIE *<br />
LOU BARRON<br />
* STEVE BEBLOW * GLORIA BECKER * ALICIA BEIERBACH * RYAN BERRETT *<br />
JAY BILLESBERGER<br />
* AMANDA BONNER * ERIN BUSCHERT * FLORENCE CAIRNS * NEIL CAMPBELL *<br />
MICHAEL CAPON<br />
* YVAN CHRETIEN * REGINA CHUI * GARY COMEAU * TERESA CONTRADA *<br />
TOM COPELAND<br />
* JENNIFERANNE CORBEIL * NIKI COTE * ROD COUTTS * SUSAN CUMMINGS *<br />
JOE DAVIS<br />
* BOYD DAYMAN * PETER DICKSON * SCOTT EDWARDS * BEVERLEY EVANS * LARRY EWERT *<br />
ANDREA FIEDLER<br />
* PAUL FLADELAND * JULIE FODE * EDWARD FONG * LIONEL FRADETTE *<br />
PAUL FRADETTE<br />
* M<strong>ARC</strong>EL GERARD * LERIZA GETUIZA * JAKE GIESBRECHT * TREVOR GOULD *<br />
GRANT GREENSLADE<br />
* TODD HAGEN * JERRY HALL * GORDON HAMILTON * CHERIE HARRIS GORDON HART<br />
*<br />
* JAMES HILLSTEAD * SANDY HINDS * MELISSA HINES * TRACEY HOLLOWAY * MAURY JACKSON *<br />
ROB JACOBI<br />
* TODD JENSEN * BLAKE JOHNSON * ERIN JOHNSON * LINE JOHNSON DEANNA KALENCHUK<br />
*<br />
* DAVID KEHRIG * DALE KIEFER * ERIN KNOWLES * DAVE KOSTIUK * PATRICK KUKURA BRIAN LAMBE<br />
*<br />
* PAULA LANGE * MARY LAWRENCE * JOHN LINCOLN * MARYANN LUCAS * LAINE LUND * LORENA<br />
MABLEY<br />
* ANDY MAGEE * DORIS MAH * LLOYD MARTIN * DEREK MCCORMAC * JAMIE MCINTYRE *<br />
EDWARD MCMILLEN<br />
* HEATHER MILLER * PATRICK MILLS * LYNNE MIZERA * MARSHALL MORIN *<br />
LORNA NELSON<br />
* MARGO PAGONIS * KEN PETERSON * MORRIS PHILLIPS * CHRISTOPHER PIPER *<br />
BRUCE PORTER<br />
* COREY QUINTON * AL RADBOURNE * ROBERT RAIWET * RANDY REYNOLDS *<br />
SCOTT REYNOLDS<br />
* BRUCE RIECHERT * BRUCE RIEP * FRANCINE ROLLOCK * BLAIR ROSQUIST *<br />
DARLENE SAVARD<br />
* GEORGE SCHOFIELD * MARIO SICOLO * RYAN SIMPSON * MICHELLE SMITH *<br />
SHARON SMITH<br />
* KEVIN SQUIRES * EVELYN STUDER * DAN TAYLOR * ROBIN THORSEN * JAN THUE *<br />
TAMMY TOPEROSKY<br />
* M<strong>ARC</strong>US TRAN * BILL TURKO * ROBYN UNRAU * KENNETH VAIL DAVE VOGELSANG<br />
*<br />
* MICHAEL WARNER * ANDY WELDON * DWAYNE WESTMAN * JEFFREY WICKENS * LEE WIENCKI *<br />
BRADLEY WILSON<br />
* JODY WILSON * MICHELLE YARROW * JANICE YOUNG * JAMES ZALESAK *<br />
DEREK ZHANG<br />
* CURTIS ZIEMER *<br />
Designed and produced by Result Associates Inc.<br />
Printed in Canada by Sundog Printing Limited.
ANNUAL REPORT <strong>2001</strong><br />
AR <strong>2001</strong> <strong>ARC</strong> ENERGY TRUST<br />
AR <strong>2001</strong> <strong>ARC</strong> ENERGY TRUST<br />
TSE: AET.un<br />
Get interactive with <strong>ARC</strong> Energy Trust<br />
Along with our <strong>2001</strong> print annual report, we are providing an online electronic version<br />
containing the identical information, easy to access with interactive navigation.<br />
www.AETreports<strong>2001</strong>.com<br />
<strong>ARC</strong> ENERGY TRUST<br />
Suite 2100, 440 – 2 Avenue S.W., Calgary, Alberta, Canada T2P 5E9<br />
1-888-272-4900