Neural correlates of attentional expertise in long-term meditation ...
Neural correlates of attentional expertise in long-term meditation ...
Neural correlates of attentional expertise in long-term meditation ...

You also want an ePaper? Increase the reach of your titles
YUMPU automatically turns print PDFs into web optimized ePapers that Google loves.
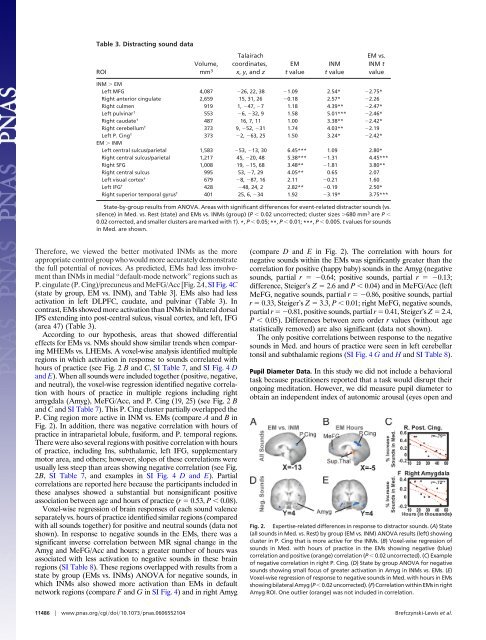
Table 3. Distract<strong>in</strong>g sound data<br />
ROI<br />
Volume,<br />
mm 3<br />
Talairach<br />
coord<strong>in</strong>ates,<br />
x, y, and z<br />
EM<br />
t value<br />
INM<br />
t value<br />
EM vs.<br />
INM t<br />
value<br />
INM EM<br />
Left MFG 4,087 26, 22, 38 1.09 2.54* 2.75*<br />
Right anterior c<strong>in</strong>gulate 2,659 15, 31, 26 0.18 2.57* 2.26<br />
Right culmen 919 1, 47, 7 1.18 4.39** 2.47*<br />
Left pulv<strong>in</strong>ar † 553 6, 32, 9 1.58 5.01*** 2.46*<br />
Right caudate † 487 16, 7, 11 1.00 3.38** 2.42*<br />
Right cerebellum † 373 9, 52, 31 1.74 4.03** 2.19<br />
Left P. C<strong>in</strong>g † 373 2, 63, 25 1.50 3.24* 2.42*<br />
EM INM<br />
Left central sulcus/parietal 1,583 53, 13, 30 6.45*** 1.09 2.80*<br />
Right central sulcus/parietal 1,217 45, 20, 48 5.38*** 1.31 4.45***<br />
Right SFG 1,008 19, 15, 68 3.48** 1.81 3.80**<br />
Right central sulcus 995 53, 7, 29 4.05** 0.65 2.07<br />
Left visual cortex † 679 8, 87, 16 2.11 0.21 1.60<br />
Left IFG † 428 48, 24, 2 2.82** 0.19 2.50*<br />
Right superior temporal gyrus † 401 25, 6, 34 1.92 3.19* 3.75***<br />
State-by-group results from ANOVA. Areas with significant differences for event-related distracter sounds (vs.<br />
silence) <strong>in</strong> Med. vs. Rest (state) and EMs vs. INMs (group) (P 0.02 uncorrected; cluster sizes 680 mm 3 are P <br />
0.02 corrected, and smaller clusters are marked with †). *, P 0.05; **, P 0.01; ***, P 0.005. t values for sounds<br />
<strong>in</strong> Med. are shown.<br />
Therefore, we viewed the better motivated INMs as the more<br />
appropriate control group who would more accurately demonstrate<br />
the full potential <strong>of</strong> novices. As predicted, EMs had less <strong>in</strong>volvement<br />
than INMs <strong>in</strong> medial ‘‘default-mode network’’ regions such as<br />
P. c<strong>in</strong>gulate (P. C<strong>in</strong>g)/precuneus and MeFG/Acc [Fig. 2A, SI Fig. 4C<br />
(state by group, EM vs. INM), and Table 3]. EMs also had less<br />
activation <strong>in</strong> left DLPFC, caudate, and pulv<strong>in</strong>ar (Table 3). In<br />
contrast, EMs showed more activation than INMs <strong>in</strong> bilateral dorsal<br />
IPS extend<strong>in</strong>g <strong>in</strong>to post-central sulcus, visual cortex, and left, IFG<br />
(area 47) (Table 3).<br />
Accord<strong>in</strong>g to our hypothesis, areas that showed differential<br />
effects for EMs vs. NMs should show similar trends when compar<strong>in</strong>g<br />
MHEMs vs. LHEMs. A voxel-wise analysis identified multiple<br />
regions <strong>in</strong> which activation <strong>in</strong> response to sounds correlated with<br />
hours <strong>of</strong> practice (see Fig. 2 B and C, SI Table 7, and SI Fig. 4 D<br />
and E). When all sounds were <strong>in</strong>cluded together (positive, negative,<br />
and neutral), the voxel-wise regression identified negative correlation<br />
with hours <strong>of</strong> practice <strong>in</strong> multiple regions <strong>in</strong>clud<strong>in</strong>g right<br />
amygdala (Amyg), MeFG/Acc, and P. C<strong>in</strong>g (19, 25) (see Fig. 2 B<br />
and C and SI Table 7). This P. C<strong>in</strong>g cluster partially overlapped the<br />
P. C<strong>in</strong>g region more active <strong>in</strong> INM vs. EMs (compare A and B <strong>in</strong><br />
Fig. 2). In addition, there was negative correlation with hours <strong>of</strong><br />
practice <strong>in</strong> <strong>in</strong>traparietal lobule, fusiform, and P. temporal regions.<br />
There were also several regions with positive correlation with hours<br />
<strong>of</strong> practice, <strong>in</strong>clud<strong>in</strong>g Ins, subthalamic, left IFG, supplementary<br />
motor area, and others; however, slopes <strong>of</strong> these correlations were<br />
usually less steep than areas show<strong>in</strong>g negative correlation (see Fig.<br />
2B, SI Table 7, and examples <strong>in</strong> SI Fig. 4 D and E). Partial<br />
correlations are reported here because the participants <strong>in</strong>cluded <strong>in</strong><br />
these analyses showed a substantial but nonsignificant positive<br />
association between age and hours <strong>of</strong> practice (r 0.53, P 0.08).<br />
Voxel-wise regression <strong>of</strong> bra<strong>in</strong> responses <strong>of</strong> each sound valence<br />
separately vs. hours <strong>of</strong> practice identified similar regions (compared<br />
with all sounds together) for positive and neutral sounds (data not<br />
shown). In response to negative sounds <strong>in</strong> the EMs, there was a<br />
significant <strong>in</strong>verse correlation between MR signal change <strong>in</strong> the<br />
Amyg and MeFG/Acc and hours; a greater number <strong>of</strong> hours was<br />
associated with less activation to negative sounds <strong>in</strong> these bra<strong>in</strong><br />
regions (SI Table 8). These regions overlapped with results from a<br />
state by group (EMs vs. INMs) ANOVA for negative sounds, <strong>in</strong><br />
which INMs also showed more activation than EMs <strong>in</strong> default<br />
network regions (compare F and G <strong>in</strong> SI Fig. 4) and <strong>in</strong> right Amyg<br />
(compare D and E <strong>in</strong> Fig. 2). The correlation with hours for<br />
negative sounds with<strong>in</strong> the EMs was significantly greater than the<br />
correlation for positive (happy baby) sounds <strong>in</strong> the Amyg (negative<br />
sounds, partial r 0.64; positive sounds, partial r 0.13;<br />
difference, Steiger’s Z 2.6 and P 0.04) and <strong>in</strong> MeFG/Acc (left<br />
MeFG, negative sounds, partial r 0.86, positive sounds, partial<br />
r 0.33, Steiger’s Z 3.3, P 0.01; right MeFG, negative sounds,<br />
partial r 0.81, positive sounds, partial r 0.41, Steiger’s Z 2.4,<br />
P 0.05). Differences between zero order r values (without age<br />
statistically removed) are also significant (data not shown).<br />
The only positive correlations between response to the negative<br />
sounds <strong>in</strong> Med. and hours <strong>of</strong> practice were seen <strong>in</strong> left cerebellar<br />
tonsil and subthalamic regions (SI Fig. 4 G and H and SI Table 8).<br />
Pupil Diameter Data. In this study we did not <strong>in</strong>clude a behavioral<br />
task because practitioners reported that a task would disrupt their<br />
ongo<strong>in</strong>g <strong>meditation</strong>. However, we did measure pupil diameter to<br />
obta<strong>in</strong> an <strong>in</strong>dependent <strong>in</strong>dex <strong>of</strong> autonomic arousal (eyes open and<br />
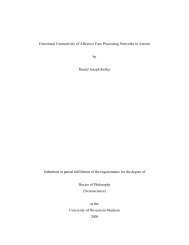
Fig. 2. Expertise-related differences <strong>in</strong> response to distractor sounds. (A) State<br />
(all sounds <strong>in</strong> Med. vs. Rest) by group (EM vs. INM) ANOVA results (left) show<strong>in</strong>g<br />
cluster <strong>in</strong> P. C<strong>in</strong>g that is more active for the INMs. (B) Voxel-wise regression <strong>of</strong><br />
sounds <strong>in</strong> Med. with hours <strong>of</strong> practice <strong>in</strong> the EMs show<strong>in</strong>g negative (blue)<br />
correlation and positive (orange) correlation (P 0.02 uncorrected). (C) Example<br />
<strong>of</strong> negative correlation <strong>in</strong> right P. C<strong>in</strong>g. (D) State by group ANOVA for negative<br />
sounds show<strong>in</strong>g small focus <strong>of</strong> greater activation <strong>in</strong> Amyg <strong>in</strong> INMs vs. EMs. (E)<br />
Voxel-wise regression <strong>of</strong> response to negative sounds <strong>in</strong> Med. with hours <strong>in</strong> EMs<br />
show<strong>in</strong>g bilateral Amyg (P 0.02 uncorrected). (F) Correlation with<strong>in</strong> EMs <strong>in</strong> right<br />
Amyg ROI. One outlier (orange) was not <strong>in</strong>cluded <strong>in</strong> correlation.<br />
11486 www.pnas.orgcgidoi10.1073pnas.0606552104 Brefczynski-Lewis et al.

![[F-18]-L-DOPA PET scan shows loss of dopaminergic neurons](https://img.yumpu.com/41721684/1/190x146/f-18-l-dopa-pet-scan-shows-loss-of-dopaminergic-neurons.jpg?quality=85)