Introduction to Positron Emission Tomography - Waisman ...
Introduction to Positron Emission Tomography - Waisman ...
Introduction to Positron Emission Tomography - Waisman ...
- No tags were found...

Create successful ePaper yourself
Turn your PDF publications into a flip-book with our unique Google optimized e-Paper software.
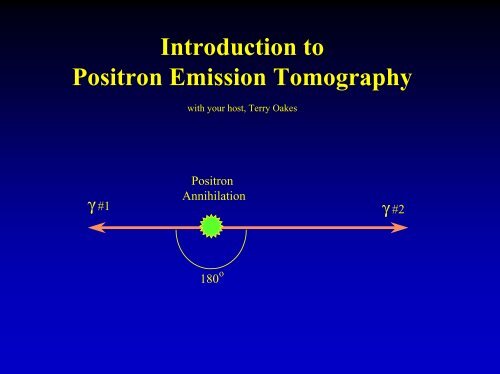
<strong>Introduction</strong> <strong>to</strong><strong>Positron</strong> <strong>Emission</strong> <strong>Tomography</strong>with your host, Terry Oakes<strong>Positron</strong>Annihilationγ #1 γ #2180 o
<strong>Positron</strong> Annihilationpositronemittinga<strong>to</strong>mneighboringa<strong>to</strong>m<strong>Positron</strong> range:1-10 mmγ #1 γ #2positronannihilationGamma-Ray range:10 mm -8180 o
<strong>Positron</strong> <strong>Emission</strong> <strong>Tomography</strong>detec<strong>to</strong>rringdetec<strong>to</strong>r #2γ #2detec<strong>to</strong>r #1γ #1
<strong>Positron</strong> <strong>Emission</strong> <strong>Tomography</strong>detec<strong>to</strong>r #2γ #2detec<strong>to</strong>r #1γ #1
<strong>Positron</strong> <strong>Emission</strong> <strong>Tomography</strong>
<strong>Positron</strong> <strong>Emission</strong> <strong>Tomography</strong>
<strong>Positron</strong> <strong>Emission</strong> <strong>Tomography</strong>
P.E.T. measures Concentration of Radioactivity1) Gamma-rays escape from body:External detection possible.2) Two gamma rays emittedoat 180 when a positronannihilates:The annihilation occuredsomewhere betweenthe two detec<strong>to</strong>rs.3) Regions with greaterradioactivity levelsproduce more LORs:Concentration of radioactivitycan be measured and quantified.
P.E.T. yields Quantitative results.( µCi/cc tissue )Corrections must be applied <strong>to</strong> raw data:1) Dead-time, Random events2) Calibration3) Normalization4) Scatter-correction5) Attenuation correction6) Reconstruction
Corrections <strong>to</strong> Sinogramscolor scaleraw sinogram(20 cm cylinder)trim(remove edges)Scatter-CorrectNormalized,without Scatter-CorrectionNormalizemash(combine angular views)
Effect of Corrections on ImagesScattercorrectedNormalizedXXXXXXAttenuationcorrectedXXXUniform20 cm cylindercolor scale
CalibrationConverting“counts/pixel”<strong>to</strong>“microCi / cc tissue”detec<strong>to</strong>rringMeasure response ofthe PET scanner <strong>to</strong> aknown concentrationof radioactivity.knownradioactivityconcentrationObtainCalibration Fac<strong>to</strong>rapplicable for all scans.( CF ~ (µCi/cc)/counts )
Normalizationdetec<strong>to</strong>rring
NormalizationIndividual detec<strong>to</strong>rs responddifferently <strong>to</strong> the same levelof radioactivity.Normalization produces auniform response <strong>to</strong> thesame level of radioactivity.
Gamma-ray attenuation proportional <strong>to</strong>:1) density of object2) pathlength through objectAttenuation CorrectionAttenuation can be corrected with adensity-weighted map of the object.gamma-rayattenuatedrotatingradioactiveline-sourceAttenuation causes a non-uniform loss of events;more gamma rays passing through the middle of the object are lost.
Scatter CorrectionScattered gamma rays causerecorded events <strong>to</strong> be mispositioned.Scatter tends <strong>to</strong> increase the concentrationmeasured <strong>to</strong>ward the center of the object.gamma-rayscatterednumber of eventsscatteredeventsunscattered(true) eventsradial bin
PET Data Acquistionraw sinogramRadioactive sourcein PET scanner
P.E.T. data are acquired as discrete Lines of Response (LORs)radial binsradial binsradial binsAngular View #1(theta = 0)Angular View #2(theta = 45)Angular View #3(theta = 90)
Three Angular ViewsAngular View #1(theta = 0)Angular View #2(theta = 45)Angular View #3(theta = 90)
Sinogram#1Angular View #1(theta = 0)#2angular views#3Angular View #2(theta = 45)radial binsAngular View #3(theta = 90)
Image Reconstructionit’s magic!raw sinogramReconstructed Image

![[F-18]-L-DOPA PET scan shows loss of dopaminergic neurons](https://img.yumpu.com/41721684/1/190x146/f-18-l-dopa-pet-scan-shows-loss-of-dopaminergic-neurons.jpg?quality=85)