livestock manure production rates and nutrient content - Ontario Agri ...
livestock manure production rates and nutrient content - Ontario Agri ...
livestock manure production rates and nutrient content - Ontario Agri ...

You also want an ePaper? Increase the reach of your titles
YUMPU automatically turns print PDFs into web optimized ePapers that Google loves.
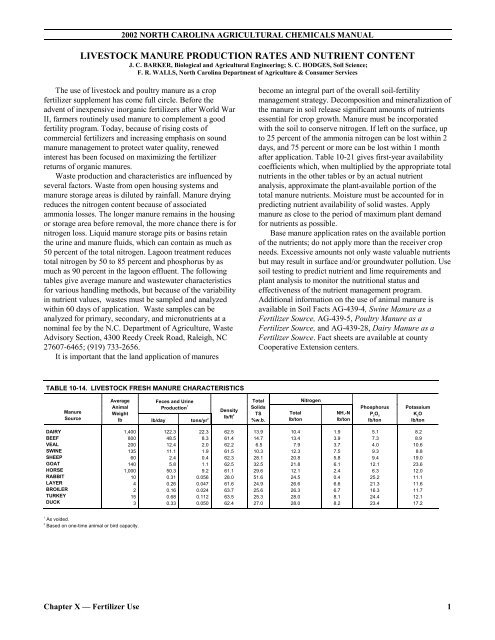
2002 NORTH CAROLINA AGRICULTURAL CHEMICALS MANUAL<br />
LIVESTOCK MANURE PRODUCTION RATES AND NUTRIENT CONTENT<br />
J. C. BARKER, Biological <strong>and</strong> <strong>Agri</strong>cultural Engineering; S. C. HODGES, Soil Science;<br />
F. R. WALLS, North Carolina Department of <strong>Agri</strong>culture & Consumer Services<br />
The use of <strong>livestock</strong> <strong>and</strong> poultry <strong>manure</strong> as a crop<br />
fertilizer supplement has come full circle. Before the<br />
advent of inexpensive inorganic fertilizers after World War<br />
II, farmers routinely used <strong>manure</strong> to complement a good<br />
fertility program. Today, because of rising costs of<br />
commercial fertilizers <strong>and</strong> increasing emphasis on sound<br />
<strong>manure</strong> management to protect water quality, renewed<br />
interest has been focused on maximizing the fertilizer<br />
returns of organic <strong>manure</strong>s.<br />
Waste <strong>production</strong> <strong>and</strong> characteristics are influenced by<br />
several factors. Waste from open housing systems <strong>and</strong><br />
<strong>manure</strong> storage areas is diluted by rainfall. Manure drying<br />
reduces the nitrogen <strong>content</strong> because of associated<br />
ammonia losses. The longer <strong>manure</strong> remains in the housing<br />
or storage area before removal, the more chance there is for<br />
nitrogen loss. Liquid <strong>manure</strong> storage pits or basins retain<br />
the urine <strong>and</strong> <strong>manure</strong> fluids, which can contain as much as<br />
50 percent of the total nitrogen. Lagoon treatment reduces<br />
total nitrogen by 50 to 85 percent <strong>and</strong> phosphorus by as<br />
much as 90 percent in the lagoon effluent. The following<br />
tables give average <strong>manure</strong> <strong>and</strong> wastewater characteristics<br />
for various h<strong>and</strong>ling methods, but because of the variability<br />
in <strong>nutrient</strong> values, wastes must be sampled <strong>and</strong> analyzed<br />
within 60 days of application. Waste samples can be<br />
analyzed for primary, secondary, <strong>and</strong> micro<strong>nutrient</strong>s at a<br />
nominal fee by the N.C. Department of <strong>Agri</strong>culture, Waste<br />
Advisory Section, 4300 Reedy Creek Road, Raleigh, NC<br />
27607-6465; (919) 733-2656.<br />
It is important that the l<strong>and</strong> application of <strong>manure</strong>s<br />
become an integral part of the overall soil-fertility<br />
management strategy. Decomposition <strong>and</strong> mineralization of<br />
the <strong>manure</strong> in soil release significant amounts of <strong>nutrient</strong>s<br />
essential for crop growth. Manure must be incorporated<br />
with the soil to conserve nitrogen. If left on the surface, up<br />
to 25 percent of the ammonia nitrogen can be lost within 2<br />
days, <strong>and</strong> 75 percent or more can be lost within 1 month<br />
after application. Table 10-21 gives first-year availability<br />
coefficients which, when multiplied by the appropriate total<br />
<strong>nutrient</strong>s in the other tables or by an actual <strong>nutrient</strong><br />
analysis, approximate the plant-available portion of the<br />
total <strong>manure</strong> <strong>nutrient</strong>s. Moisture must be accounted for in<br />
predicting <strong>nutrient</strong> availability of solid wastes. Apply<br />
<strong>manure</strong> as close to the period of maximum plant dem<strong>and</strong><br />
for <strong>nutrient</strong>s as possible.<br />
Base <strong>manure</strong> application <strong>rates</strong> on the available portion<br />
of the <strong>nutrient</strong>s; do not apply more than the receiver crop<br />
needs. Excessive amounts not only waste valuable <strong>nutrient</strong>s<br />
but may result in surface <strong>and</strong>/or groundwater pollution. Use<br />
soil testing to predict <strong>nutrient</strong> <strong>and</strong> lime requirements <strong>and</strong><br />
plant analysis to monitor the nutritional status <strong>and</strong><br />
effectiveness of the <strong>nutrient</strong> management program.<br />
Additional information on the use of animal <strong>manure</strong> is<br />
available in Soil Facts AG-439-4, Swine Manure as a<br />
Fertilizer Source, AG-439-5, Poultry Manure as a<br />
Fertilizer Source, <strong>and</strong> AG-439-28, Dairy Manure as a<br />
Fertilizer Source. Fact sheets are available at county<br />
Cooperative Extension centers.<br />
TABLE 10-14. LIVESTOCK FRESH MANURE CHARACTERISTICS<br />
Manure<br />
Source<br />
Average<br />
Feces <strong>and</strong> Urine<br />
Animal<br />
Production 1<br />
Density<br />
Weight<br />
lb/ft 3<br />
lb lb/day tons/yr 2<br />
Total<br />
Solids<br />
TS<br />
%w.b.<br />
Total<br />
lb/ton<br />
Nitrogen<br />
NH 4<br />
-N<br />
lb/ton<br />
Phosphorus<br />
P 2<br />
O 5<br />
lb/ton<br />
Potassium<br />
K 2<br />
O<br />
lb/ton<br />
DAIRY<br />
BEEF<br />
VEAL<br />
SWINE<br />
SHEEP<br />
GOAT<br />
HORSE<br />
RABBIT<br />
LAYER<br />
BROILER<br />
TURKEY<br />
DUCK<br />
1,400<br />
800<br />
200<br />
135<br />
60<br />
140<br />
1,000<br />
10<br />
4<br />
2<br />
15<br />
3<br />
122.3<br />
48.5<br />
12.4<br />
11.1<br />
2.4<br />
5.8<br />
50.3<br />
0.31<br />
0.26<br />
0.16<br />
0.68<br />
0.33<br />
22.3<br />
8.3<br />
2.0<br />
1.9<br />
0.4<br />
1.1<br />
9.2<br />
0.056<br />
0.047<br />
0.024<br />
0.112<br />
0.050<br />
62.5<br />
61.4<br />
62.2<br />
61.5<br />
62.3<br />
62.5<br />
61.1<br />
28.0<br />
61.6<br />
63.7<br />
63.5<br />
62.4<br />
13.9<br />
14.7<br />
6.5<br />
10.3<br />
28.1<br />
32.5<br />
29.6<br />
51.6<br />
24.9<br />
25.6<br />
25.3<br />
27.0<br />
10.4<br />
13.4<br />
7.9<br />
12.3<br />
20.8<br />
21.8<br />
12.1<br />
24.5<br />
26.6<br />
26.3<br />
28.0<br />
28.0<br />
1.9<br />
3.9<br />
3.7<br />
7.5<br />
5.8<br />
6.1<br />
2.4<br />
0.4<br />
6.6<br />
6.7<br />
8.1<br />
8.2<br />
5.1<br />
7.3<br />
4.0<br />
9.3<br />
9.4<br />
12.1<br />
6.3<br />
25.2<br />
21.3<br />
16.3<br />
24.4<br />
23.4<br />
8.2<br />
8.9<br />
10.6<br />
8.8<br />
19.0<br />
23.6<br />
12.0<br />
11.1<br />
11.6<br />
11.7<br />
12.1<br />
17.2<br />
1<br />
As voided.<br />
2<br />
Based on one-time animal or bird capacity.<br />
Chapter X — Fertilizer Use 1
Continued<br />
TABLE 10-15. LIVESTOCK LOT SURFACE SCRAPED MANURE CHARACTERISTICS<br />
Manure<br />
Source<br />
Average<br />
Animal<br />
Manure<br />
Accumulation<br />
lb lb/day tons/yr 1<br />
Weight<br />
lb/ft 2<br />
Total<br />
Solids<br />
TS<br />
%w.b.<br />
Total<br />
lb/ton<br />
Nitrogen<br />
NH 4<br />
-N<br />
lb/ton<br />
Phosphorus<br />
P 2<br />
O 5<br />
lb/ton<br />
Potassium<br />
K 2<br />
O<br />
lb/ton<br />
BEEF<br />
800<br />
paved feed lot 3<br />
unpaved feedlot 4<br />
DAIRY 2<br />
1,400<br />
HORSE<br />
1,000<br />
LAYER<br />
undercage scraped 3<br />
4<br />
highrise stored 6<br />
SWINE 2<br />
135<br />
33.5<br />
12.7<br />
88.0<br />
32.9<br />
0.16<br />
0.11<br />
7.8<br />
5.7<br />
2.2<br />
16.1<br />
6.0<br />
0.028<br />
0.020<br />
1.3<br />
59.7<br />
60.3<br />
56.4<br />
14.0<br />
62.4<br />
51.2<br />
62.4<br />
28.6<br />
58.9<br />
21.8<br />
49.7<br />
35.2<br />
52.8<br />
18.5<br />
14.3<br />
25.1<br />
10.3<br />
12.8<br />
28.3<br />
38.6<br />
13.0<br />
4.9<br />
4.7<br />
2.5<br />
1.9<br />
14.0<br />
11.8<br />
5.6<br />
9.4<br />
17.8<br />
7.1<br />
9.7<br />
31.7<br />
51.1<br />
13.3<br />
12.9<br />
21.6<br />
8.6<br />
13.9<br />
19.5<br />
26.3<br />
9.1<br />
1<br />
Based on one-time animal or bird capacity.<br />
2<br />
Manure collected within 1 week.<br />
3<br />
Manure collected within 2 days.<br />
4<br />
Manure collected after each group of cattle.<br />
5<br />
Annual <strong>manure</strong> accumulation on unpaved surface.<br />
6<br />
Stable <strong>manure</strong> <strong>and</strong> bedding on unpaved surface.<br />
TABLE 10-16. POULTRY HOUSE LITTER CHARACTERISTICS<br />
Manure<br />
Source<br />
Average<br />
Animal<br />
Manure <strong>and</strong> Litter<br />
Accumulation<br />
lb lb/day tons/yr 1<br />
Weight<br />
lb/ft 2<br />
Total<br />
Solids<br />
TS<br />
%w.b.<br />
Total<br />
lb/ton<br />
Nitrogen<br />
NH 4<br />
-N<br />
lb/ton<br />
Phosphorus<br />
P 2<br />
O 5<br />
lb/ton<br />
Potassium<br />
K 2<br />
O<br />
lb/ton<br />
BROILER<br />
Broiler 3<br />
2.0<br />
Roaster3<br />
4.0<br />
Breeder3<br />
6.0<br />
TURKEY<br />
Poult 2<br />
2.5<br />
grower hen 3<br />
10.0<br />
grower tom 3<br />
15.0<br />
DUCK 3 3.0<br />
0.041<br />
0.063<br />
0.13<br />
0.048<br />
0.16<br />
0.24<br />
0.17<br />
0.0063<br />
0.010<br />
0.023<br />
0.0070<br />
0.02<br />
0.041<br />
0.026<br />
31.7<br />
29.0<br />
50.0<br />
22.9<br />
32.3<br />
32.3<br />
500<br />
78.6<br />
76.2<br />
68.6<br />
79.5<br />
73.2<br />
73.2<br />
37.0<br />
72.1<br />
69.5<br />
37.5<br />
40.1<br />
55.6<br />
55.6<br />
17.0<br />
12.0<br />
16.0<br />
8.0<br />
9.6<br />
12.1<br />
12.1<br />
3.7<br />
69.3<br />
69.9<br />
58.3<br />
43.3<br />
63.3<br />
63.3<br />
21.4<br />
46.6<br />
46.7<br />
35.2<br />
26.9<br />
39.9<br />
39.9<br />
12.7<br />
1<br />
Based on one-time bird capacity.<br />
2<br />
Based on cleanout after each group of birds.<br />
3<br />
Based on annual cleanout after full <strong>production</strong>.<br />
TABLE 10-17. POULTRY STOCKPILED LITTER CHARACTERISTICS<br />
Manure<br />
Source<br />
Average<br />
Animal<br />
Manure <strong>and</strong> Litter<br />
Accumulation<br />
lb lb/day tons/yr 1<br />
Weight<br />
lb/ft<br />
Total<br />
Solids<br />
TS<br />
%w.b.<br />
Total<br />
lb/ton<br />
Nitrogen<br />
NH 4<br />
-N<br />
lb/ton<br />
Phosphorus<br />
P 2<br />
O 5<br />
lb/ton<br />
Potassium<br />
K 2<br />
O<br />
lb/ton<br />
2<br />
BROILER 2<br />
DUCK 2 3<br />
TURKEY 2<br />
15<br />
0.038<br />
0.22<br />
0.09<br />
0.0057<br />
0.037<br />
0.014<br />
33.1<br />
24.1<br />
50.0<br />
60.6<br />
61.2<br />
49.1<br />
32.7<br />
32.1<br />
22.3<br />
6.9<br />
5.5<br />
4.3<br />
76.7<br />
69.6<br />
41.2<br />
32.0<br />
30.1<br />
21.7<br />
1<br />
Based on one-time bird capacity.<br />
2<br />
Annual house accumulation removed to uncovered stockpile to be spread within 6 months.<br />
TABLE 10-18. LIVESTOCK LIQUID MANURE SLURRY CHARACTERISTICS<br />
Manure<br />
Source<br />
Average<br />
Animal<br />
Weight<br />
lb<br />
Manure Slurry<br />
Accumulation 1<br />
gal/animal/day<br />
Density<br />
lb/gal<br />
Total<br />
Solids<br />
TS<br />
%w.b.<br />
Total<br />
lb/1,000 gal<br />
Nitrogen<br />
NH 4<br />
-N<br />
lb/1,000 gal<br />
Phosphorus<br />
P 2<br />
O 5<br />
lb/1,000 gal<br />
Potassium<br />
K 2<br />
O<br />
lb/1,000 gal<br />
DAIRY<br />
BEEF<br />
VEAL<br />
SWINE<br />
LAYER<br />
1,400<br />
800<br />
200<br />
135<br />
4<br />
22.5<br />
6.8<br />
1.4<br />
2.3<br />
0.046<br />
8.3<br />
8.3<br />
8.5<br />
8.4<br />
7.8<br />
7.0<br />
12.0<br />
2.6<br />
5.1<br />
11.2<br />
22.5<br />
35.0<br />
30.4<br />
26.7<br />
57.6<br />
9.2<br />
14.6<br />
25.3<br />
16.8<br />
36.8<br />
13.8<br />
22.6<br />
17.0<br />
18.9<br />
52.0<br />
20.0<br />
31.6<br />
42.1<br />
15.2<br />
33.1<br />
1<br />
Based on 6 to 12 months' accumulation of <strong>manure</strong>, excess water usage, storage surface rainfall surplus; does not include fresh water for flushing or lot runoff.<br />
2 Chapter X — Fertilizer Use
Continued<br />
TABLE 10-19. LIVESTOCK ANAEROBIC LAGOON LIQUID CHARACTERISTICS<br />
Manure<br />
Source<br />
Average<br />
Animal<br />
Weight<br />
lb<br />
Lagoon Liquid<br />
Accumulation 1<br />
acre-inch/animal/year<br />
Density<br />
lb/gal<br />
Total<br />
Solids<br />
TS<br />
%w.b.<br />
Total<br />
lb/acre inch<br />
Nitrogen<br />
NH 4<br />
-N<br />
lb/acre inch<br />
Phosphorus<br />
P 2<br />
O 5<br />
lb/acre inch<br />
Potassium<br />
K 2<br />
O<br />
lb/acre inch<br />
DAIRY<br />
BEEF<br />
VEAL<br />
SWINE<br />
LAYER<br />
1,400<br />
800<br />
200<br />
135<br />
4<br />
0.41<br />
0.13<br />
0.032<br />
0.035<br />
0.00095<br />
1<br />
Based on accumulation of <strong>manure</strong>, excess water usage, <strong>and</strong> average annual lagoon surface rainfall surplus; does not include fresh water for flushing or lot runoff.<br />
8.3<br />
8.3<br />
8.3<br />
8.3<br />
8.3<br />
0.52<br />
0.59<br />
—<br />
0.32<br />
0.49<br />
132<br />
92<br />
56<br />
128<br />
180<br />
88<br />
63<br />
36<br />
103<br />
152<br />
75<br />
50<br />
10<br />
51<br />
46<br />
176<br />
134<br />
82<br />
132<br />
279<br />
TABLE 10-20. LIVESTOCK ANAEROBIC LAGOON SLUDGE CHARACTERISTICS<br />
Manure<br />
Source<br />
Average<br />
Animal<br />
Weight<br />
lb<br />
Lagoon Sludge<br />
Accumulation 1<br />
gal/hd/day<br />
Density<br />
lb/gal<br />
Total<br />
Solids<br />
TS<br />
%w.b.<br />
Total<br />
lb/1,000 gal<br />
Nitrogen<br />
NH 3<br />
-N<br />
lb/1,000 gal<br />
Phosphorus<br />
P 2<br />
O 5<br />
lb/1,000 gal<br />
Potassium<br />
K 2<br />
O<br />
lb/1,000 gal<br />
DAIRY<br />
BEEF<br />
SWINE<br />
LAYER<br />
1,400<br />
800<br />
135<br />
4<br />
5.9<br />
2.3<br />
0.1<br />
0.013<br />
8.3<br />
8.3<br />
8.9<br />
8.3<br />
7.3<br />
11.4<br />
10.0<br />
16.5<br />
19.2<br />
38.2<br />
24.4<br />
20.8<br />
6.2<br />
17.1<br />
5.9<br />
6.5<br />
41.8<br />
58.9<br />
52.6<br />
77.2<br />
9.2<br />
14.6<br />
6.5<br />
9.8<br />
1<br />
No <strong>manure</strong> solids removed before waste enters the lagoon.<br />
TABLE 10-21. LIVESTOCK MANURE NUTRIENT FIRST-YEAR AVAILABILITY COEFFICIENTS<br />
Application Method<br />
Manure Source<br />
Injection 1 Soil Incorporation 2 Broadcast 3 Irrigation 4<br />
Plant Nutrient<br />
N Other N Other N Other N Other<br />
PAVED SURFACE SCRAPED MANURE<br />
Dairy<br />
Beef<br />
Swine<br />
Sheep<br />
Goat<br />
Rabbit<br />
Layer<br />
—<br />
—<br />
—<br />
—<br />
—<br />
—<br />
—<br />
—<br />
—<br />
—<br />
—<br />
—<br />
—<br />
—<br />
0.6<br />
0.6<br />
0.6<br />
0.6<br />
0.6<br />
0.5<br />
0.6<br />
0.8<br />
0.8<br />
0.8<br />
0.8<br />
0.8<br />
0.8<br />
0.8<br />
0.4<br />
0.4<br />
0.4<br />
0.4<br />
0.4<br />
0.5<br />
0.4<br />
0.7<br />
0.7<br />
0.7<br />
0.7<br />
0.7<br />
0.7<br />
0.7<br />
—<br />
—<br />
—<br />
—<br />
—<br />
—<br />
—<br />
—<br />
—<br />
—<br />
—<br />
—<br />
—<br />
—<br />
UNPAVED SURFACE MANURE<br />
ACCUMULATION<br />
Beef, feedlot<br />
Horse, stable<br />
Layer, deep pit<br />
—<br />
—<br />
—<br />
—<br />
—<br />
—<br />
0.6<br />
0.5<br />
0.6<br />
0.8<br />
0.8<br />
0.8<br />
0.5<br />
0.5<br />
0.4<br />
0.7<br />
0.7<br />
0.7<br />
—<br />
—<br />
—<br />
—<br />
—<br />
—<br />
POULTRY HOUSE LITTER<br />
Broiler<br />
Broiler breeder<br />
Turkey<br />
Duck<br />
—<br />
—<br />
—<br />
—<br />
—<br />
—<br />
—<br />
—<br />
0.6<br />
0.6<br />
0.6<br />
0.6<br />
0.8<br />
0.8<br />
0.8<br />
0.8<br />
0.5<br />
0.5<br />
0.5<br />
0.5<br />
0.7<br />
0.7<br />
0.7<br />
0.7<br />
—<br />
—<br />
—<br />
—<br />
—<br />
—<br />
—<br />
—<br />
POULTRY STOCKPILED LITTER<br />
Broiler<br />
Turkey<br />
Duck<br />
—<br />
—<br />
—<br />
—<br />
—<br />
—<br />
0.6<br />
0.6<br />
0.6<br />
0.8<br />
0.8<br />
0.8<br />
0.5<br />
0.5<br />
0.5<br />
0.7<br />
0.7<br />
0.7<br />
—<br />
—<br />
—<br />
—<br />
—<br />
—<br />
LIQUID MANURE SLURRY<br />
Dairy<br />
Beef<br />
Veal<br />
Swine<br />
Layer<br />
0.7<br />
0.7<br />
0.9<br />
0.8<br />
0.8<br />
0.8<br />
0.8<br />
0.8<br />
0.8<br />
0.8<br />
0.6<br />
0.6<br />
0.7<br />
0.7<br />
0.7<br />
0.8<br />
0.8<br />
0.8<br />
0.8<br />
0.8<br />
0.4<br />
0.4<br />
0.4<br />
0.4<br />
0.4<br />
0.7<br />
0.7<br />
0.7<br />
0.7<br />
0.7<br />
0.4<br />
0.4<br />
0.3<br />
0.3<br />
0.3<br />
0.7<br />
0.7<br />
0.7<br />
0.7<br />
0.7<br />
ANAEROBIC LAGOON LIQUID<br />
Dairy<br />
Beef<br />
Veal<br />
Swine<br />
Layer<br />
0.8<br />
0.7<br />
0.8<br />
0.9<br />
0.9<br />
0.8<br />
0.8<br />
0.8<br />
0.8<br />
0.8<br />
0.7<br />
0.7<br />
0.7<br />
0.8<br />
0.8<br />
0.8<br />
0.8<br />
0.8<br />
0.8<br />
0.8<br />
0.5<br />
0.5<br />
0.5<br />
0.5<br />
0.5<br />
0.7<br />
0.7<br />
0.7<br />
0.7<br />
0.7<br />
0.5<br />
0.5<br />
0.5<br />
0.5<br />
0.5<br />
0.7<br />
0.7<br />
0.7<br />
0.7<br />
0.7<br />
ANAEROBIC LAGOON SLUDGE<br />
Dairy<br />
Beef<br />
Swine<br />
Layer<br />
0.7<br />
0.7<br />
0.6<br />
0.6<br />
0.8<br />
0.8<br />
0.8<br />
0.8<br />
0.6<br />
0.6<br />
0.6<br />
0.6<br />
0.8<br />
0.8<br />
0.8<br />
0.8<br />
0.4<br />
0.4<br />
0.4<br />
0.4<br />
0.7<br />
0.7<br />
0.7<br />
0.7<br />
0.4<br />
0.4<br />
0.4<br />
0.4<br />
0.7<br />
0.7<br />
0.7<br />
0.7<br />
1<br />
Manure injected directly into soil <strong>and</strong> covered immediately.<br />
2<br />
Surface-spread <strong>manure</strong> plowed or disked into soil within 2 days.<br />
3<br />
Surface-spread <strong>manure</strong> uncovered for 1 month or longer.<br />
4<br />
Sprinkler irrigated liquid uncovered for 1 month or longer.<br />
Chapter X — Fertilizer Use 3
Continued<br />
These recommendations apply only to North Carolina. They may not be appropriate for conditions in other states <strong>and</strong> may not comply with laws<br />
<strong>and</strong> regulations outside of North Carolina. These recommendations are current as of August 2001. Individuals who use agricultural chemicals<br />
are responsible for ensuring that the intended use complies with current regulations <strong>and</strong> conforms to the product label. Be sure to obtain<br />
current information about usage regulations <strong>and</strong> examine a current product label before applying any chemical. For assistance, contact your<br />
county Cooperative Extension Service agent. The use of br<strong>and</strong> names <strong>and</strong> any mention or listing of commercial products or services in this<br />
publication does not imply endorsement by the North Carolina Cooperative Extension Service nor discrimination against similar products or<br />
services not mentioned.<br />
Latest Web Update: December 2001<br />
http://ipmwww.ncsu.edu/agchem/chptr10/1011.pdf<br />
4 Chapter X — Fertilizer Use