genetic diversity in the matrilineal whales: models of cultural ...
genetic diversity in the matrilineal whales: models of cultural ...
genetic diversity in the matrilineal whales: models of cultural ...

Create successful ePaper yourself
Turn your PDF publications into a flip-book with our unique Google optimized e-Paper software.
MARINE MAMMAL SCIENCE, 21(1):58–79 (January 2005)<br />
Ó 2005 by <strong>the</strong> Society for Mar<strong>in</strong>e Mammalogy<br />
GENETIC DIVERSITY IN THE MATRILINEAL<br />
WHALES: MODELS OF CULTURAL<br />
HITCHHIKING AND GROUP-SPECIFIC<br />
NON-HERITABLE DEMOGRAPHIC VARIATION<br />
HAL WHITEHEAD<br />
Department <strong>of</strong> Biology,<br />
Dalhousie University,<br />
Halifax, Nova Scotia B3H 4J1, Canada<br />
E-mail: hwhitehe@dal.ca<br />
ABSTRACT<br />
Cultural hitchhik<strong>in</strong>g is <strong>the</strong> process by which <strong>cultural</strong> selection reduces <strong>the</strong><br />
<strong>diversity</strong> <strong>of</strong> genes that are be<strong>in</strong>g transmitted <strong>in</strong> parallel to selective <strong>cultural</strong> traits.<br />
I use simulation <strong>models</strong> to <strong>in</strong>vestigate <strong>cultural</strong> hitchhik<strong>in</strong>g <strong>in</strong> geographically<br />
unstructured populations <strong>of</strong> <strong>cultural</strong>ly homogeneous tribes. Substantial reduction<br />
<strong>of</strong> <strong>genetic</strong> <strong>diversity</strong> required: a reasonably low mutation rate; that tribes split<br />
fairly frequently when <strong>the</strong>y constitute a substantial part <strong>of</strong> <strong>the</strong> population; a fairly<br />
low migration rate (,;10 migrants per tribe per generation); only a low rate <strong>of</strong><br />
<strong>cultural</strong> evolution (mean <strong>cultural</strong>ly determ<strong>in</strong>ed fitness change .;0.005%/<br />
generation); and that <strong>cultural</strong> assimilation from o<strong>the</strong>r tribes change <strong>the</strong> fitness <strong>of</strong><br />
a tribe less than <strong>cultural</strong> <strong>in</strong>novation with<strong>in</strong> it. Cultural hitchhik<strong>in</strong>g tends to<br />
<strong>in</strong>crease mean tribe size. Measures <strong>of</strong> <strong>genetic</strong> and <strong>cultural</strong> variation among tribes<br />
poorly <strong>in</strong>dicate past <strong>cultural</strong> hitchhik<strong>in</strong>g. Demographic effects, <strong>in</strong> which tribal<br />
fitness varies but is not heritable, can also reduce a population’s <strong>genetic</strong> <strong>diversity</strong> if<br />
<strong>the</strong> fitness varies very considerably, or tribal extirpation is added. In such cases<br />
populations frequently become ext<strong>in</strong>ct. Four species <strong>of</strong> matril<strong>in</strong>eal <strong>whales</strong> have<br />
remarkably low mitochondrial DNA <strong>diversity</strong>. Knowledge <strong>of</strong> <strong>the</strong> population and<br />
social structure <strong>of</strong> <strong>the</strong>se species is consistent with <strong>the</strong> conditions for <strong>cultural</strong><br />
hitchhik<strong>in</strong>g. However, <strong>the</strong>re rema<strong>in</strong> important <strong>in</strong>formation gaps.<br />
Key words: <strong>cultural</strong> evolution, gene-culture coevolution, <strong>genetic</strong> <strong>diversity</strong>, whale,<br />
matril<strong>in</strong>e.<br />
Population substructure can reduce <strong>genetic</strong> <strong>diversity</strong> below <strong>the</strong> level expected <strong>in</strong><br />
a panmictic population <strong>of</strong> <strong>the</strong> same size (Whitlock and Barton 1997). Attributes<br />
which may structure a population <strong>in</strong>clude culture, where culture may be def<strong>in</strong>ed as<br />
<strong>in</strong>formation or behavior shared by members <strong>of</strong> a population or subpopulation and<br />
transmitted by some form <strong>of</strong> social learn<strong>in</strong>g (Rendell and Whitehead 2001).<br />
Culture can reduce <strong>the</strong> <strong>diversity</strong> <strong>of</strong> genes which are be<strong>in</strong>g transmitted <strong>in</strong> parallel<br />
58
WHITEHEAD: CULTURAL EVOLUTION<br />
59<br />
(‘‘symetrically’’ <strong>in</strong> <strong>the</strong> term<strong>in</strong>ology <strong>of</strong> Boyd and Richerson 1985) with selective and<br />
heritable <strong>cultural</strong> traits (Whitehead 1998). I have called this process ‘‘<strong>cultural</strong><br />
hitchhik<strong>in</strong>g’’ (Whitehead 1998), as it is analogous to <strong>genetic</strong> hitchhik<strong>in</strong>g <strong>in</strong> which<br />
selectively advantageous genes spread neighbor<strong>in</strong>g l<strong>in</strong>ked neutral alleles, reduc<strong>in</strong>g<br />
<strong>diversity</strong> at a neutral locus (Maynard Smith and Haigh 1974).<br />
I have suggested that <strong>cultural</strong> hitchhik<strong>in</strong>g caused <strong>the</strong> remarkably low <strong>diversity</strong> <strong>in</strong><br />
<strong>the</strong> mitochondrial DNA (mtDNA) <strong>of</strong> four species <strong>of</strong> whale that have matril<strong>in</strong>eal<br />
social systems (Whitehead 1998). These species are ‘‘matril<strong>in</strong>eal’’ <strong>in</strong> <strong>the</strong> sense that<br />
females generally rema<strong>in</strong> grouped with <strong>the</strong>ir mo<strong>the</strong>r while she is alive. Cultural<br />
hitchhik<strong>in</strong>g may also have caused a low <strong>diversity</strong> <strong>in</strong> Y-chromosome genes, and<br />
possibly also mtDNA, <strong>of</strong> Homo sapiens (Whitehead et al. 2002).<br />
Cultural hitchhik<strong>in</strong>g is a form <strong>of</strong> gene-culture coevolution <strong>in</strong> which both <strong>the</strong><br />
transmission <strong>of</strong> genes and <strong>cultural</strong> traits affect genotypes (Feldman and Laland<br />
1996). Among o<strong>the</strong>rs, Feldman and Laland (1996) consider gene-culture<br />
coevolution to be restricted to humans. Thus, its presence <strong>in</strong> <strong>the</strong> matril<strong>in</strong>eal<br />
<strong>whales</strong> would be particularly significant.<br />
The model that <strong>in</strong>vestigated <strong>the</strong> feasibility <strong>of</strong> <strong>cultural</strong> hitchhik<strong>in</strong>g <strong>in</strong> humans<br />
used current conceptions <strong>of</strong> <strong>the</strong> societies and cultures <strong>of</strong> late Pleistocene hunterga<strong>the</strong>rers<br />
(Whitehead et al. 2002). It <strong>in</strong>cluded tribe-based demography with<br />
ext<strong>in</strong>ctions, territoriality, competition for resources between neighbor<strong>in</strong>g tribes,<br />
<strong>in</strong>tertribe flows <strong>of</strong> genes and culture, <strong>genetic</strong> mutation, and <strong>cultural</strong> evolution.<br />
In contrast, <strong>the</strong> earlier model which <strong>in</strong>troduced <strong>the</strong> idea <strong>of</strong> <strong>cultural</strong> hitchhik<strong>in</strong>g<br />
<strong>in</strong> reference to <strong>the</strong> matril<strong>in</strong>eal <strong>whales</strong> (Whitehead 1998) was much simpler. It<br />
ignored territoriality—reasonable as <strong>the</strong> matril<strong>in</strong>eal <strong>whales</strong> are not territorial—,<br />
<strong>cultural</strong> evolution, and <strong>the</strong> sizes <strong>of</strong> <strong>the</strong> social entities with homogeneous cultures. In<br />
this model, just one, advantageous, <strong>cultural</strong> <strong>in</strong>novation promulgated <strong>in</strong> a simple<br />
matril<strong>in</strong>eal fashion. This model was overly simple, and some <strong>of</strong> its implications<br />
have been used to argue aga<strong>in</strong>st <strong>cultural</strong> hitchhik<strong>in</strong>g <strong>in</strong> <strong>the</strong>se species. To produce<br />
<strong>cultural</strong> hitchhik<strong>in</strong>g, it required an <strong>in</strong>novation which had substantial effect on<br />
fitness, and transmitted faithfully between generations with low rates <strong>of</strong><br />
assimilation outside <strong>the</strong> matril<strong>in</strong>eal l<strong>in</strong>e. Critics questioned whe<strong>the</strong>r such an<br />
<strong>in</strong>novation could be sufficiently constant over time for <strong>the</strong> process to operate<br />
(Deecke et al. 2000), and whe<strong>the</strong>r <strong>the</strong> whale societies were stable enough so that <strong>the</strong><br />
<strong>in</strong>novation would be ma<strong>in</strong>ta<strong>in</strong>ed largely with<strong>in</strong> matril<strong>in</strong>eal l<strong>in</strong>es (Mesnick et al.<br />
1999, Tiedemann and Mil<strong>in</strong>kovitch 1999). The major simplification <strong>of</strong> <strong>the</strong> orig<strong>in</strong>al<br />
model was <strong>the</strong> <strong>in</strong>clusion <strong>of</strong> just one <strong>in</strong>novation, while <strong>cultural</strong> evolution more likely<br />
proceeds by a series <strong>of</strong> small steps.<br />
As an alternative, several authors have suggested that <strong>the</strong> low mtDNA <strong>diversity</strong><br />
<strong>of</strong> <strong>the</strong> matril<strong>in</strong>eal <strong>whales</strong> may result from purely demographic, non-heritable<br />
processes, if animals with<strong>in</strong> matril<strong>in</strong>eal groups tend to have correlated fitness<br />
(Siemann 1994, Amos 1999, Tiedemann and Mil<strong>in</strong>kovitch 1999). I have argued<br />
that such <strong>models</strong> make assumptions or predictions that are not consistent with <strong>the</strong><br />
known natural history <strong>of</strong> <strong>the</strong> species (Whitehead 1998, 1999a), but have not<br />
formally compared demographic <strong>models</strong> with <strong>cultural</strong> hitchhik<strong>in</strong>g.<br />
Here, I look generally at <strong>the</strong> possibility <strong>of</strong> <strong>cultural</strong> hitchhik<strong>in</strong>g <strong>in</strong> geographically<br />
unstructured populations divided <strong>in</strong>to social entities that have dist<strong>in</strong>ctive cultures.<br />
I will call <strong>the</strong>se social entities ‘‘tribes,’’ follow<strong>in</strong>g <strong>the</strong> anthropological def<strong>in</strong>ition <strong>of</strong><br />
<strong>cultural</strong>ly homogeneous entities (e.g., Birdsell 1966). The model allows both genes<br />
and culture to evolve, and both to move between <strong>the</strong> tribes. While based upon <strong>the</strong><br />
<strong>in</strong>formation available for <strong>the</strong> matril<strong>in</strong>eal <strong>whales</strong>, <strong>the</strong> model has sufficient generality
60 MARINE MAMMAL SCIENCE, VOL. 21, NO. 1, 2005<br />
that it can <strong>in</strong>dicate <strong>the</strong> feasibility <strong>of</strong> <strong>cultural</strong> hitchhik<strong>in</strong>g at any locus <strong>in</strong><br />
a geographically unstructured population socially divided <strong>in</strong>to entities that have<br />
dist<strong>in</strong>ctive cultures. Secondarily, I exam<strong>in</strong>e whe<strong>the</strong>r measures <strong>of</strong> <strong>genetic</strong> or <strong>cultural</strong><br />
divergence among tribes can be used to assess <strong>the</strong> likelihood <strong>of</strong> past <strong>cultural</strong><br />
hitchhik<strong>in</strong>g. I also adapt <strong>the</strong> model to <strong>in</strong>vestigate <strong>the</strong> feasibility <strong>of</strong> purely<br />
demographic, non-heritable, processes reduc<strong>in</strong>g <strong>genetic</strong> <strong>diversity</strong> <strong>in</strong> a socially<br />
structured population (follow<strong>in</strong>g Siemann 1994, Amos 1999, Tiedemann and<br />
Mil<strong>in</strong>kovitch 1999).<br />
METHODS<br />
I stochastically simulated <strong>the</strong> progress <strong>of</strong> <strong>genetic</strong> and <strong>cultural</strong> evolution <strong>in</strong><br />
a geographically unstructured haploid population <strong>of</strong> <strong>in</strong>dividuals each <strong>of</strong> which<br />
possesses a haplotype, h. As noted below, <strong>the</strong> results <strong>of</strong> <strong>the</strong> model can be adapted to<br />
consider diploid genes. The population is socially structured <strong>in</strong>to tribes, which may<br />
have dist<strong>in</strong>ctive <strong>cultural</strong> phenotypes. This fits with knowledge <strong>of</strong> <strong>the</strong> matril<strong>in</strong>eal<br />
<strong>whales</strong> where social structures <strong>in</strong>clude permanent groups which travel toge<strong>the</strong>r and,<br />
at least <strong>in</strong> some cases, have dist<strong>in</strong>ctive behavior (e.g., Whitehead 1999b, 2003b;<br />
Ottensmeyer and Whitehead 2003; Yurk 2003). Thus <strong>the</strong> population can be<br />
described by fn(t, h, c)g, <strong>the</strong> number <strong>of</strong> <strong>in</strong>dividuals <strong>in</strong> <strong>the</strong> population which are<br />
members <strong>of</strong> tribe c and have haplotype h at generation t. Each tribe possesses a mean<br />
fitness w(c, t) which can change with time through <strong>cultural</strong> evolution, but mean<br />
fitness does not vary between haplotypes with<strong>in</strong> a tribe. The follow<strong>in</strong>g events can take<br />
place (<strong>in</strong> this order) at each simulated generation: reproduction, <strong>genetic</strong> mutation,<br />
<strong>cultural</strong> evolution, <strong>cultural</strong> assimilation, <strong>in</strong>tertribe migration, and tribe fission.<br />
Reproduction<br />
I represent reproduction by a Poisson process, so that <strong>the</strong> number <strong>of</strong> <strong>in</strong>dividuals<br />
with any haplotype <strong>in</strong> a tribe depends on <strong>the</strong> number <strong>in</strong> <strong>the</strong> previous generation,<br />
adjusted for <strong>the</strong> <strong>cultural</strong>ly determ<strong>in</strong>ed relative fitness <strong>of</strong> <strong>the</strong> tribe (w(c, t)) and <strong>the</strong><br />
total population size relative to <strong>the</strong> carry<strong>in</strong>g capacity <strong>of</strong> <strong>the</strong> environment, K. So:<br />
<br />
<br />
nðt; h; cÞwðc; tÞK<br />
nðt þ 1; h; cÞ ¼Po P P<br />
ð1Þ<br />
h c<br />
nðt; h; cÞwðc; tÞ<br />
where Po(x) is a Poisson random variable with mean x. This leads to density<br />
dependence, and a total population size that approximates K.<br />
Genetic Mutation<br />
Follow<strong>in</strong>g reproduction, each <strong>in</strong>dividual has probability l <strong>of</strong> mutat<strong>in</strong>g <strong>in</strong>to<br />
a totally new haplotype, different at one base-pair from <strong>the</strong> parent haplotype. There<br />
are no back mutations.<br />
Cultural Evolution<br />
Two parameters def<strong>in</strong>e <strong>cultural</strong> evolution: <strong>the</strong> frequency (q) and magnitude (r)<strong>of</strong><br />
fitness changes due to <strong>cultural</strong> <strong>in</strong>novations (which are assumed to spread through<br />
a tribe with<strong>in</strong> a generation). Thus:
WHITEHEAD: CULTURAL EVOLUTION<br />
61<br />
wðc; tÞ with probability 1 q<br />
wðc; t þ 1Þ ¼<br />
ð2Þ<br />
jwðc; tÞNð1; rÞj with probability q<br />
where N(1,r) represents a normal random variable with mean 1.0 and standard<br />
deviation r. Thus, roughly once every 1/q generations, a tribe produces a <strong>cultural</strong><br />
<strong>in</strong>novation which changes its fitness by a factor with mean 1.0 and standard<br />
deviation r. In this formulation, r represents <strong>the</strong> approximate significance <strong>of</strong> <strong>the</strong><br />
<strong>cultural</strong> <strong>in</strong>novations (high r <strong>in</strong>dicat<strong>in</strong>g that <strong>cultural</strong> <strong>in</strong>novations have a major<br />
effect on fitness), and <strong>cultural</strong> <strong>in</strong>novations can have positive or negative effects on<br />
fitness. Then q r approximates <strong>the</strong> proportional absolute change <strong>in</strong> fitness per<br />
generation. I also ran <strong>the</strong> model with a modification so that all <strong>in</strong>novations had<br />
a positive effect on fitness: <strong>in</strong> equation 2, <strong>the</strong> fitness with an <strong>in</strong>novation was<br />
w(c, t) (1 þjN(0,r)j).<br />
Cultural Assimilation<br />
I added <strong>cultural</strong> assimilation between tribes <strong>in</strong> some runs <strong>of</strong> <strong>the</strong> model. In this<br />
scenario culture itself moves across tribal boundaries, as when a tribe adopts<br />
a behavior pattern characteristic <strong>of</strong> ano<strong>the</strong>r tribe and, <strong>in</strong> consequence its fitness<br />
converges towards that <strong>of</strong> <strong>the</strong> donor tribe. At each generation, each tribe, c, has<br />
a probability a <strong>of</strong> receiv<strong>in</strong>g <strong>cultural</strong> <strong>in</strong>put from ano<strong>the</strong>r, randomly chosen, tribe, d:<br />
wðc; tÞ with probability 1 a<br />
wðc; t þ 1Þ ¼<br />
ð3Þ<br />
ð1 bÞ wðc; tÞþb wðd; tÞ with probability a<br />
Thus, a represents <strong>the</strong> frequency <strong>of</strong> <strong>cultural</strong> assimilation, and b its magnitude; b<br />
be<strong>in</strong>g less than 1.0 represents situations when only some <strong>cultural</strong> traits are<br />
assimilated.<br />
Intertribe Migration<br />
At <strong>the</strong> start <strong>of</strong> each generation, a proportion, m, <strong>of</strong> <strong>in</strong>dividuals <strong>in</strong> each tribe leave<br />
and <strong>the</strong>n each moves to a randomly chosen tribe (which could <strong>in</strong>clude <strong>the</strong>ir orig<strong>in</strong>al<br />
tribe), and <strong>the</strong>n adopts <strong>the</strong> <strong>cultural</strong>ly determ<strong>in</strong>ed fitness <strong>of</strong> <strong>the</strong> receiv<strong>in</strong>g tribe.<br />
Tribe Fission<br />
At each generation, each tribe c has a probability, q(c, t), <strong>of</strong> splitt<strong>in</strong>g <strong>in</strong>to two<br />
separate tribes:<br />
P<br />
h<br />
nðt; h; cÞ<br />
qðc; tÞ ¼<br />
K P þ P ð4Þ<br />
h<br />
nðt; h; cÞ<br />
Thus, <strong>the</strong> probability <strong>of</strong> a tribe splitt<strong>in</strong>g rises as <strong>the</strong> tribe’s population <strong>in</strong>creases<br />
towards K P. After a split, a proportion p <strong>of</strong> <strong>the</strong> members <strong>of</strong> <strong>the</strong> tribe with<br />
a particular haplotype are assigned randomly to <strong>the</strong> first daughter tribe, and a<br />
proportion 1 p to <strong>the</strong> o<strong>the</strong>r, where p is chosen randomly from <strong>the</strong> [0 1] uniform<br />
distribution. The fitness <strong>of</strong> both daughter tribes <strong>in</strong>itially equal that <strong>of</strong> <strong>the</strong>ir parent,<br />
but subsequently <strong>the</strong>y evolve <strong>in</strong>dependently.
62 MARINE MAMMAL SCIENCE, VOL. 21, NO. 1, 2005<br />
Table 1. Comb<strong>in</strong>ations <strong>of</strong> parameters used <strong>in</strong> model runs. Ten runs were made with all<br />
comb<strong>in</strong>ations <strong>of</strong> parameters <strong>in</strong> each vertical column.<br />
Carry<strong>in</strong>g capacity K ¼ 1,000 K ¼ 10,000 K ¼ 100,000<br />
l, mutation rate 10 3 * 10 3 ,10 4 10 4 ,10 5<br />
per generation<br />
m, migration rate 10 1 ,10 2 , 10 1 ,10 2 , 10 2 ,10 3 ,10 4 ,0§<br />
per generation 10 3 ,10 4 ,0 10 3 ,10 4 ,0<br />
P, splitt<strong>in</strong>g parameter 1, 10, 100, 1,000 1, 10, 100, 1,000 100, 1,000{<br />
per generation<br />
* For small populations, low mutation rates produced no <strong>genetic</strong> <strong>diversity</strong> so analyses<br />
were redundant.<br />
§ For large populations, a very high migration rate (m ¼ 0.1) produced too much <strong>genetic</strong><br />
<strong>diversity</strong> with<strong>in</strong> tribes to be reasonably modeled.<br />
{ For large populations, a low splitt<strong>in</strong>g parameter produced too many tribes to be<br />
reasonably modeled.<br />
Procedure for Runn<strong>in</strong>g Model<br />
This model <strong>the</strong>n has parameters K, l, q, r, a, b, m, and P, as well as <strong>the</strong> option<br />
<strong>of</strong> us<strong>in</strong>g ei<strong>the</strong>r positive/negative <strong>in</strong>novations (as <strong>in</strong> equation 2) or just positive<br />
<strong>in</strong>novations.<br />
First, I produced ‘‘basel<strong>in</strong>e’’ populations, with <strong>the</strong> degree <strong>of</strong> <strong>genetic</strong> <strong>diversity</strong><br />
expected given <strong>the</strong> carry<strong>in</strong>g capacity, K, (which will be very close to mean population<br />
size because <strong>of</strong> <strong>the</strong> density-dependent nature <strong>of</strong> <strong>the</strong> formulation), <strong>the</strong> mutation rate<br />
(l), <strong>the</strong> <strong>in</strong>tertribe migration rate (m), and <strong>the</strong> tribe fission parameter (P). To do this,<br />
I ran <strong>the</strong> model without <strong>cultural</strong> <strong>in</strong>novation (q ¼ 0) on a population <strong>in</strong>itially<br />
consist<strong>in</strong>g <strong>of</strong> K <strong>genetic</strong>ally and <strong>cultural</strong>ly identical <strong>in</strong>dividuals <strong>in</strong> one tribe. I noted<br />
when, at T E generations, <strong>the</strong> overall haplotype <strong>diversity</strong> first exceeded <strong>the</strong> expected<br />
equilibrium <strong>genetic</strong> <strong>diversity</strong> given an <strong>in</strong>f<strong>in</strong>ite allele model (Birky et al. 1983):<br />
<br />
MðT E Þ 2 P Ph c nðT 2<br />
E; h; cÞ<br />
. 2lK<br />
ð5Þ<br />
MðT E ÞðMðT E Þ 1Þ ð1 þ 2lKÞ<br />
where M is <strong>the</strong> population size (M(t) ¼ PP n(t,h,c)). I <strong>the</strong>n ran <strong>the</strong> model for<br />
ano<strong>the</strong>r T E generations to produce an approximate ‘‘equilibrium’’ population. At<br />
this stage, I saved <strong>the</strong> <strong>genetic</strong> structure <strong>of</strong> <strong>the</strong> <strong>cultural</strong>ly undifferentiated population<br />
(given by fn(2T E , h, c)g).<br />
Us<strong>in</strong>g this procedure, I produced basel<strong>in</strong>e populations for comb<strong>in</strong>ations <strong>of</strong> three<br />
carry<strong>in</strong>g capacities: K ¼ 1,000, 10,000, or 100,000; mutation rates so that K l ¼ 1<br />
or 10; splitt<strong>in</strong>g parameters P ¼ 1, 10, 100 or 1,000; and migration rates, m ¼ 10 1 ,<br />
10 2 ,10 3 ,10 4 , or 0.0. A few comb<strong>in</strong>ations <strong>of</strong> <strong>the</strong>se parameters were not used<br />
because <strong>the</strong>y were unrealistic or not computationally feasible (Table 1). I produced<br />
ten different basel<strong>in</strong>e populations for each <strong>of</strong> <strong>the</strong> comb<strong>in</strong>ations <strong>of</strong> K, l, P, and m<br />
given <strong>in</strong> <strong>the</strong> columns <strong>of</strong> Table 1.<br />
I <strong>the</strong>n ‘‘tested’’ each <strong>of</strong> <strong>the</strong>se basel<strong>in</strong>e populations for 200 generations <strong>in</strong><br />
situations first (as a control) with no <strong>cultural</strong> <strong>in</strong>novation (q ¼ 0), and <strong>the</strong>n with all<br />
comb<strong>in</strong>ations <strong>of</strong> <strong>the</strong> follow<strong>in</strong>g parameters govern<strong>in</strong>g <strong>cultural</strong> <strong>in</strong>novation (but no<br />
<strong>cultural</strong> assimilation, i.e., a ¼ 0):
WHITEHEAD: CULTURAL EVOLUTION<br />
63<br />
(1) Cultural <strong>in</strong>novations positive/negative, or just positive;<br />
(2) Cultural <strong>in</strong>novation rate: q ¼f10 1 ,10 2 ,10 3 ,10 4 g;<br />
(3) Cultural <strong>in</strong>novation magnitude: r ¼f0.0125, 0.05, 0.2g.<br />
I <strong>in</strong>vestigated <strong>the</strong> effects <strong>of</strong> <strong>cultural</strong> assimilation by mak<strong>in</strong>g test runs with<br />
positive or negative <strong>in</strong>novations, all comb<strong>in</strong>ations <strong>of</strong> <strong>the</strong> <strong>cultural</strong> <strong>in</strong>novation<br />
parameters a ¼f0, 0.01, 0.05, 0.1, 0.5g and b ¼f0.2, 0.5, 0.8g, and each <strong>of</strong> <strong>the</strong><br />
follow<strong>in</strong>g sets <strong>of</strong> o<strong>the</strong>r parameters:<br />
K ¼ 1,000; l ¼ 10 3 ; P ¼ 1; m ¼ 10 4 ; q ¼ 0.1; r ¼ 0.05<br />
K ¼ 10,000; l ¼ 10 3 ; P ¼ 1; m ¼ 10 4 ; q ¼ 0.1; r ¼ 0.05<br />
K ¼ 10,000; l ¼ 10 4 ; P ¼ 1; m ¼ 10 4 ; q ¼ 0.1; r ¼ 0.05<br />
K ¼ 100,000; l ¼ 10 4 ; P ¼ 100; m ¼ 10 4 ; q ¼ 0.1; r ¼ 0.05<br />
K ¼ 100,000; l ¼ 10 5 ; P ¼ 100; m ¼ 10 4 ; q ¼ 0.1; r ¼ 0.05<br />
Output from each test run <strong>in</strong>cluded <strong>the</strong> number <strong>of</strong> tribes <strong>in</strong> <strong>the</strong> population, <strong>the</strong><br />
mean tribe size at <strong>the</strong> end <strong>of</strong> <strong>the</strong> test run (N), and <strong>the</strong> approximate number <strong>of</strong><br />
migrants enter<strong>in</strong>g or leav<strong>in</strong>g a tribe per generation, estimated by N m, and <strong>the</strong><br />
haplotype and nucleotide diversities. Haplotype <strong>diversity</strong> (left side <strong>of</strong> equation 5)<br />
refers to <strong>the</strong> number and distribution <strong>of</strong> haplotypes <strong>in</strong> <strong>the</strong> population; nucleotide<br />
<strong>diversity</strong> also <strong>in</strong>corporates <strong>the</strong> number <strong>of</strong> base-pair differences between haplotypes.<br />
For <strong>the</strong> runs which <strong>in</strong>cluded <strong>cultural</strong> assimilation, I calculated <strong>the</strong> ratio <strong>of</strong> <strong>the</strong> sum<br />
<strong>of</strong> <strong>the</strong> absolute changes <strong>in</strong> fitness that were due to assimilation to those that were<br />
due to <strong>in</strong>novation, as well as <strong>the</strong> variation <strong>in</strong> fitness among tribes (given by <strong>the</strong><br />
coefficient <strong>of</strong> variation <strong>of</strong> w(c)), and <strong>the</strong> <strong>genetic</strong> divergence among tribes (G ST ).<br />
Non-heritable Demographic Variation<br />
In order to <strong>in</strong>vestigate whe<strong>the</strong>r purely demographic processes could reduce<br />
<strong>genetic</strong> <strong>diversity</strong> <strong>in</strong> a socially structured population, I amended <strong>the</strong> model for <strong>the</strong><br />
test<strong>in</strong>g phase <strong>in</strong> two ways. In both cases tribal fitness varies but this variation is not<br />
heritable, a contrast with <strong>the</strong> <strong>cultural</strong> <strong>models</strong>. In <strong>the</strong> first version, which follows <strong>the</strong><br />
outl<strong>in</strong>e <strong>of</strong> Tiedemann and Mil<strong>in</strong>kovitch’s (1999) model (except for spatial<br />
structur<strong>in</strong>g), <strong>the</strong> fitness <strong>of</strong> a tribe at any generation is given by:<br />
wðc; tÞ ¼Nð1; mÞ<br />
ð6Þ<br />
In this formulation tribal fitness is not heritable but varies with time and has an<br />
overall mean <strong>of</strong> 1.0 and standard deviation <strong>of</strong> m for all tribes. Tribes with zero or<br />
negative fitness are automatically extirpated. Such non-heritable variation <strong>in</strong> fitness<br />
could arise from several causes <strong>in</strong>clud<strong>in</strong>g tribe-specific habitat use, tribe-specific<br />
disease epidemiology, or short-term ‘‘horizontal’’ cultures (transmitted among<br />
members <strong>of</strong> <strong>the</strong> same generation).<br />
In <strong>the</strong> second version, us<strong>in</strong>g <strong>the</strong> basic model <strong>of</strong> Siemann (1994), tribes disappear<br />
through mass mortality at a rate <strong>of</strong> d per generation. This is modeled by:<br />
wðc; tÞ ¼ 0 with probability d<br />
ð7Þ<br />
1 with probability 1 d<br />
The mass strand<strong>in</strong>g mortalities <strong>of</strong> some whale species, especially <strong>the</strong> pilot <strong>whales</strong><br />
(Globicephala spp.), suggested such a scenario (Siemann 1994).<br />
For each <strong>of</strong> <strong>the</strong> comb<strong>in</strong>ations <strong>of</strong> K, l, m, and P given <strong>in</strong> <strong>the</strong> columns <strong>of</strong> Table 1,<br />
and each <strong>of</strong> <strong>the</strong> ten equilibrium populations, each <strong>of</strong> <strong>the</strong>se <strong>models</strong> was run for 200
64 MARINE MAMMAL SCIENCE, VOL. 21, NO. 1, 2005<br />
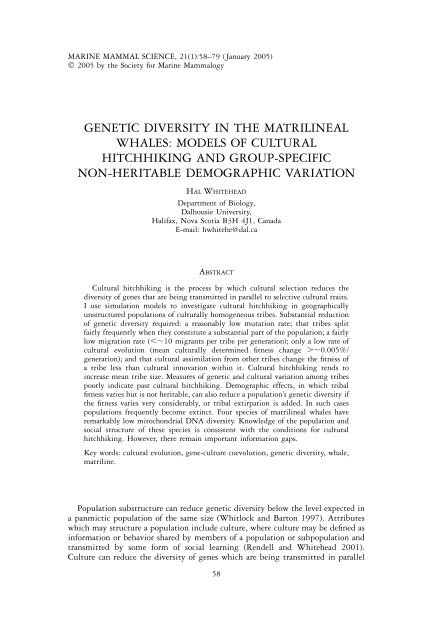
Figure 1. Ten runs <strong>of</strong> <strong>the</strong> model show<strong>in</strong>g changes <strong>in</strong> haplotype <strong>diversity</strong> (-, left axes) and<br />
<strong>cultural</strong> divergence among tribes, given by CV(w), (, right axes) over 200 generations<br />
with <strong>the</strong> same parameters (K ¼ 10,000, P ¼ 1, l ¼ 0.0001, m ¼ 0.0001, q ¼ 0.001, r ¼<br />
0.05, with just positive <strong>cultural</strong> <strong>in</strong>novations).<br />
generations, with m ¼f0.4, 0.2, 0.1, 0.05g <strong>in</strong> <strong>the</strong> first case, and d ¼f0.1, 0.05,<br />
0.025, 0.0125g <strong>in</strong> <strong>the</strong> second.<br />
RESULTS<br />
The Process <strong>of</strong> Cultural Hitchhik<strong>in</strong>g<br />
The model runs shown <strong>in</strong> Figure 1 illustrate <strong>the</strong> process <strong>of</strong> <strong>cultural</strong> hitchhik<strong>in</strong>g.<br />
They use a set <strong>of</strong> parameters that sometimes, but not always, reduced <strong>genetic</strong><br />
<strong>diversity</strong>. In <strong>the</strong> <strong>in</strong>itial fifty-or-so generations, with little <strong>cultural</strong> divergence<br />
(equivalent to little variation <strong>in</strong> fitness) among tribes, <strong>genetic</strong> <strong>diversity</strong> rema<strong>in</strong>ed<br />
fairly constant, but once <strong>the</strong> coefficient <strong>of</strong> variation <strong>of</strong> tribal fitness reached about<br />
0.02 (i.e., roughly a 2% difference between <strong>the</strong> fitness <strong>of</strong> different tribes), <strong>the</strong>n<br />
<strong>genetic</strong> <strong>diversity</strong> <strong>of</strong>ten began to change. Sometimes (e.g., Fig. 1F, I) <strong>the</strong>re was an<br />
<strong>in</strong>itial rise, <strong>in</strong>dicat<strong>in</strong>g that <strong>the</strong> fitter tribes were <strong>in</strong>itially smaller. Later on, <strong>genetic</strong><br />
<strong>diversity</strong> usually fell, sometimes to very low levels (Fig. 1B, E, G, H), and at o<strong>the</strong>rs<br />
to <strong>in</strong>termediate values (Fig. 1A, D). With low <strong>genetic</strong> <strong>diversity</strong>, <strong>in</strong>dicat<strong>in</strong>g<br />
a population descended from just one or two <strong>cultural</strong>ly successful tribes, <strong>cultural</strong><br />
divergence among tribes also decl<strong>in</strong>ed (Fig. 1B, D, E, G, H, I). However, results <strong>of</strong><br />
<strong>the</strong>se model runs show much variation; sometimes, us<strong>in</strong>g <strong>the</strong> same set <strong>of</strong> parameters<br />
that produced substantial <strong>cultural</strong> hitchhik<strong>in</strong>g, <strong>genetic</strong> <strong>diversity</strong> was not reduced
WHITEHEAD: CULTURAL EVOLUTION<br />
65<br />
Figure 2. Examples <strong>of</strong> test runs <strong>of</strong> model us<strong>in</strong>g <strong>the</strong> same ten ‘‘equilibrium’’ populations<br />
(produced with K ¼ 10,000, P ¼ 1, l ¼ 0.0001, m ¼ 0.0001), and three rates <strong>of</strong> <strong>cultural</strong><br />
<strong>in</strong>novation (A: q ¼ 0.0001; B: q ¼ 0.001; C: q ¼ 0.1; r ¼ 0.05 with just positive <strong>cultural</strong><br />
<strong>in</strong>novations <strong>in</strong> all cases).<br />
with<strong>in</strong> 200 generations despite a <strong>cultural</strong> divergence among tribes <strong>of</strong> greater than<br />
0.02 (Fig. 1J).<br />
Incidence <strong>of</strong> Cultural Hitchhik<strong>in</strong>g<br />
Under some parameter comb<strong>in</strong>ations, <strong>cultural</strong> evolution usually made little<br />
impact (e.g., Fig. 2A), while <strong>in</strong> o<strong>the</strong>r circumstances <strong>the</strong> <strong>in</strong>troduction <strong>of</strong> <strong>cultural</strong><br />
evolution usually decimated <strong>genetic</strong> <strong>diversity</strong> with<strong>in</strong> only a few tens <strong>of</strong> generations<br />
(e.g., Fig. 2C). However, especially at <strong>in</strong>termediate parameter comb<strong>in</strong>ations, <strong>cultural</strong><br />
hitchhik<strong>in</strong>g was unpredictable, with <strong>genetic</strong> <strong>diversity</strong> sometimes plummet<strong>in</strong>g and<br />
at o<strong>the</strong>rs rema<strong>in</strong><strong>in</strong>g unaffected (e.g., Fig. 1, 2B). The values <strong>of</strong> K and P used to<br />
generate <strong>the</strong> results <strong>in</strong> Figure 2 result <strong>in</strong> populations consist<strong>in</strong>g <strong>of</strong> about 100 tribes<br />
before <strong>cultural</strong> hitchhik<strong>in</strong>g, so Figure 2C corresponds to about 2,000 <strong>in</strong>novations <strong>in</strong><br />
<strong>the</strong> population per run dur<strong>in</strong>g <strong>the</strong> 200 test generations, whereas <strong>in</strong> <strong>the</strong> runs <strong>of</strong> Figure<br />
2B only approximately 20 <strong>in</strong>novations occurred per run, and <strong>in</strong> Figure 2A about two<br />
<strong>in</strong>novations per run. So, even with very few <strong>in</strong>novations (Fig. 2A), <strong>cultural</strong> evolution<br />
sometimes greatly reduced <strong>genetic</strong> <strong>diversity</strong>.<br />
The <strong>models</strong> conta<strong>in</strong> a number <strong>of</strong> parameters and produce several output<br />
measures. I have tried to organize this <strong>in</strong>formation <strong>in</strong> Figures 3 and 5 by display<strong>in</strong>g<br />
<strong>the</strong> rates <strong>of</strong> achiev<strong>in</strong>g moderate (50%–90%) or severe (.90%) reductions <strong>in</strong> <strong>genetic</strong><br />
<strong>diversity</strong> after 200 generations for each parameter and output measure, over<br />
comb<strong>in</strong>ations <strong>of</strong> o<strong>the</strong>r parameters, for both haplotype and nucleotide <strong>diversity</strong>.
66 MARINE MAMMAL SCIENCE, VOL. 21, NO. 1, 2005<br />
Figure 3. Frequencies <strong>of</strong> model runs produc<strong>in</strong>g different reductions <strong>in</strong> haplotype and<br />
nucleotide <strong>diversity</strong> compared over <strong>the</strong> range <strong>of</strong> <strong>the</strong> splitt<strong>in</strong>g parameter, P, for each<br />
comb<strong>in</strong>ation <strong>of</strong> carry<strong>in</strong>g capacity (K) and mutation rate (l) listed <strong>in</strong> Table 1.<br />
Below, I group results from related parameters and output measures, display<strong>in</strong>g<br />
only one representative measure when <strong>the</strong> pattern <strong>of</strong> reduction <strong>in</strong> <strong>genetic</strong> <strong>diversity</strong><br />
is similar among parameters and measures.<br />
Mutation Rate<br />
For a given total population size, as <strong>in</strong>dicated by K, <strong>cultural</strong> hitchhik<strong>in</strong>g <strong>in</strong><br />
haplotype <strong>diversity</strong> was more likely at K l ¼ 1 than K l ¼ 10 (Fig. 3). This is<br />
<strong>in</strong>tuitively reasonable, as high mutation rates quickly counter reductions <strong>in</strong> <strong>genetic</strong><br />
<strong>diversity</strong> from o<strong>the</strong>r causes. The reduction <strong>in</strong> nucleotide <strong>diversity</strong> was not so clearly<br />
affected by higher mutation rates as that <strong>of</strong> haplotype <strong>diversity</strong> (Fig. 3). This<br />
contrast is also expected as each new mutation generally <strong>in</strong>creases haplotype<br />
<strong>diversity</strong> more than nucleotide <strong>diversity</strong>.<br />
Population Size<br />
Cultural hitchhik<strong>in</strong>g did not obviously become more or less important over <strong>the</strong><br />
range <strong>of</strong> population sizes <strong>in</strong>vestigated (Fig. 3). Although cases <strong>of</strong> reduced <strong>genetic</strong><br />
<strong>diversity</strong> became less frequent at <strong>the</strong> highest population sizes (K ¼ 100,000), this<br />
may well be related to <strong>the</strong> relatively higher values <strong>of</strong> <strong>the</strong> splitt<strong>in</strong>g parameter (P)
WHITEHEAD: CULTURAL EVOLUTION<br />
67<br />
Figure 4. Mean (over 10 runs with a particular set <strong>of</strong> parameters) tribe size after 200<br />
generations <strong>of</strong> <strong>cultural</strong> evolution plotted aga<strong>in</strong>st <strong>the</strong> <strong>in</strong>itial mean tribe size <strong>in</strong> cases where<br />
haplotype <strong>diversity</strong> was reduced by more than 90% (þ) or less than 10% ().<br />
used with this population size (see Table 1, Fig. 3). It was impracticable to use<br />
lower splitt<strong>in</strong>g parameters at this population size, as large numbers <strong>of</strong> tribes were<br />
produced and computer run-times became prohibitively long.<br />
Tribe Size<br />
Reduction <strong>in</strong> <strong>genetic</strong> <strong>diversity</strong> depended on hav<strong>in</strong>g reasonably low values <strong>of</strong> <strong>the</strong><br />
splitt<strong>in</strong>g parameter, P, (Fig. 3) so that <strong>the</strong> population was <strong>in</strong>itially divided <strong>in</strong>to<br />
quite a number <strong>of</strong> small tribes. However, at <strong>the</strong> end <strong>of</strong> <strong>the</strong> 200 generations, and<br />
especially with <strong>the</strong> larger populations sizes (K), large tribe size (N) better <strong>in</strong>dicated<br />
<strong>cultural</strong> hitchhik<strong>in</strong>g (Fig. 4). The process <strong>of</strong> <strong>cultural</strong> hitchhik<strong>in</strong>g, <strong>in</strong> which<br />
<strong>cultural</strong>ly fitter tribes overwhelm those with lower fitness, tends to <strong>in</strong>crease mean<br />
tribe size (Fig. 4). Over all tests runs which did not <strong>in</strong>clude <strong>cultural</strong> assimilation,<br />
tribe size <strong>in</strong>creased by a mean factor <strong>of</strong> 3.3 when nucleotide <strong>diversity</strong> was reduced<br />
by 50%–60% and a factor <strong>of</strong> 5.2 when nucleotide <strong>diversity</strong> was reduced by more<br />
than 90%.<br />
Migration Rate<br />
As <strong>the</strong> migration rate between tribes (m) and <strong>the</strong> number <strong>of</strong> migrants per tribe<br />
per generation (Nm, Fig. 5A) <strong>in</strong>creased, a reduction <strong>in</strong> <strong>genetic</strong> <strong>diversity</strong> became less<br />
likely, because <strong>in</strong>tertribe migration tends to reduce <strong>genetic</strong> divergence among<br />
tribes. However, <strong>cultural</strong> hitchhik<strong>in</strong>g was still present at rates <strong>of</strong> about 10 migrants<br />
per generation per tribe (Fig. 5A).
68 MARINE MAMMAL SCIENCE, VOL. 21, NO. 1, 2005<br />
Figure 5. Frequencies <strong>of</strong> model runs produc<strong>in</strong>g different reductions <strong>in</strong> haplotype and<br />
nucleotide <strong>diversity</strong> (.90% reduction <strong>in</strong> black; 50%–90% reduction <strong>in</strong> gray; ,50% <strong>in</strong><br />
white) compared over <strong>the</strong> range <strong>of</strong>: A, estimated migrants per tribe per generation (Nm);<br />
B, <strong>cultural</strong> evolution rates (q r; approximate mean change <strong>in</strong> fitness per generation);<br />
C, <strong>cultural</strong> assimilation rates (given by <strong>the</strong> ratio <strong>of</strong> <strong>the</strong> total change <strong>in</strong> fitness due to<br />
assimilation from neighbor<strong>in</strong>g tribes to that due to <strong>in</strong>novation from with<strong>in</strong> tribes); D, <strong>the</strong><br />
<strong>cultural</strong> divergence among tribes at <strong>the</strong> end <strong>of</strong> <strong>the</strong> test runs (given by CV(w)); and E, <strong>the</strong><br />
<strong>genetic</strong> divergence among tribes at <strong>the</strong> end <strong>of</strong> <strong>the</strong> test runs (given by G ST ). The distributions<br />
use outcomes <strong>of</strong> runs with all comb<strong>in</strong>ations <strong>of</strong> <strong>in</strong>put parameters, with <strong>the</strong> exception <strong>of</strong> that<br />
for <strong>cultural</strong> assimilation (C) when only a reduced selection <strong>of</strong> parameters, more likely to<br />
show <strong>cultural</strong> hitchhik<strong>in</strong>g, was used (see text).
WHITEHEAD: CULTURAL EVOLUTION<br />
69<br />
Rate <strong>of</strong> Cultural Evolution<br />
In Figure 5B, <strong>the</strong> <strong>in</strong>cidence <strong>of</strong> <strong>cultural</strong> hitchhik<strong>in</strong>g is plotted aga<strong>in</strong>st <strong>the</strong> <strong>cultural</strong><br />
evolution rate (q r), <strong>the</strong> proportional change <strong>in</strong> fitness per generation. It is clear<br />
that <strong>genetic</strong> <strong>diversity</strong> was <strong>in</strong>creas<strong>in</strong>gly likely to be reduced as <strong>the</strong> <strong>cultural</strong> evolution<br />
rate <strong>in</strong>creased, and that <strong>the</strong> process rarely operated if <strong>cultural</strong> evolution changed<br />
fitness by less than 0.005%/generation. Plots <strong>of</strong> <strong>the</strong> likelihood <strong>of</strong> <strong>cultural</strong><br />
hitchhik<strong>in</strong>g aga<strong>in</strong>st q and r separately showed <strong>the</strong> same pattern as <strong>in</strong> Figure 5B.<br />
Positive or Negative Innovations<br />
Models with just positive, or positive and negative, <strong>cultural</strong> <strong>in</strong>novations gave<br />
similar rates <strong>of</strong> moderate and severe <strong>cultural</strong> hitchhik<strong>in</strong>g. Genetic hitchhik<strong>in</strong>g can<br />
operate on purely deleterious mutations (Charlesworth et al. 1993). So, although<br />
a system <strong>of</strong> purely deleterious <strong>cultural</strong> <strong>in</strong>novations would seem unlikely, I checked to<br />
see whe<strong>the</strong>r <strong>cultural</strong> hitchhik<strong>in</strong>g could result from purely negative <strong>in</strong>novations by<br />
mak<strong>in</strong>g runs with <strong>the</strong> parameter comb<strong>in</strong>ations used <strong>in</strong> Figure 2, and just negative<br />
<strong>in</strong>novations. Although <strong>the</strong> highest rate <strong>of</strong> <strong>cultural</strong> <strong>in</strong>novation (q ¼ 0.1) produced<br />
some reduction <strong>in</strong> <strong>genetic</strong> <strong>diversity</strong>, this (mean reduction <strong>of</strong> 77%) was less than with<br />
purely positive <strong>in</strong>novations (mean <strong>of</strong> 91% for <strong>the</strong> runs <strong>in</strong> Fig. 2C). The lower rates <strong>of</strong><br />
<strong>cultural</strong> <strong>in</strong>novation (q ¼ 0.001, 0.0001) gave no reduction at all. Therefore negative<br />
<strong>in</strong>novations seem to have less impact on <strong>genetic</strong> variation than positive ones. This is<br />
reasonable, as elevat<strong>in</strong>g <strong>the</strong> fitness <strong>of</strong> one tribe above all o<strong>the</strong>rs is likely to produce<br />
a selective sweep more easily than lower<strong>in</strong>g fitness <strong>in</strong> just some tribes.<br />
Cultural Assimilation<br />
The addition <strong>of</strong> <strong>cultural</strong> assimilation reduced <strong>the</strong> effects <strong>of</strong> <strong>cultural</strong> hitchhik<strong>in</strong>g<br />
(Fig. 5C). As <strong>the</strong> amount <strong>of</strong> fitness change due to <strong>cultural</strong> assimilation from o<strong>the</strong>r<br />
tribes approached that due to <strong>in</strong>novations with<strong>in</strong> <strong>the</strong> tribe, marked reductions <strong>in</strong><br />
<strong>genetic</strong> <strong>diversity</strong> became less frequent, and when fitness was more affected by<br />
assimilation than <strong>in</strong>novation, <strong>cultural</strong> hitchhik<strong>in</strong>g virtually disappeared. The<br />
likelihood <strong>of</strong> <strong>cultural</strong> hitchhik<strong>in</strong>g decreased with <strong>in</strong>creas<strong>in</strong>g values <strong>of</strong> both a, <strong>the</strong><br />
frequency <strong>of</strong> <strong>cultural</strong> assimilation, and, to a lesser extent, b, its magnitude.<br />
Cultural and Genetic Divergence among Tribes<br />
Although <strong>cultural</strong> divergence among tribes is a prerequisite for <strong>cultural</strong><br />
hitchhik<strong>in</strong>g to reduce <strong>genetic</strong> variability (Fig. 1), <strong>the</strong> amount <strong>of</strong> <strong>cultural</strong> divergence<br />
among tribes rema<strong>in</strong><strong>in</strong>g (CV(w(c))) after 200 generations varied considerably (Fig.<br />
1, 5D). Cultural hitchhik<strong>in</strong>g also needs <strong>genetic</strong> divergence among tribes; <strong>in</strong>itial<br />
values <strong>of</strong> G ST exceeded 0.5 <strong>in</strong> most <strong>in</strong>stances <strong>of</strong> substantial <strong>cultural</strong> hitchhik<strong>in</strong>g<br />
(Fig. 6). However, after 200 generations G ST was <strong>of</strong>ten reduced below 0.2 (Fig. 5E,<br />
6). Thus, although <strong>cultural</strong> hitchhik<strong>in</strong>g needs <strong>genetic</strong> and <strong>cultural</strong> differentiation<br />
among tribes to operate, it can substantially reduce both.<br />
Non-heritable Demographic Variation<br />
Table 2 summarizes <strong>the</strong> results <strong>of</strong> runn<strong>in</strong>g <strong>the</strong> model with non-heritable<br />
variation <strong>in</strong> tribal fitness (as given by Eq. 6 or 7). In <strong>the</strong> first scenario, variation <strong>in</strong>
70 MARINE MAMMAL SCIENCE, VOL. 21, NO. 1, 2005<br />
Figure 6. Genetic <strong>diversity</strong> among tribes (G ST ) before and after 200-generation test runs<br />
with little (left) and substantial (right) <strong>cultural</strong> hitchhik<strong>in</strong>g.<br />
fitness had to be quite substantial (CV ;0.2) to obta<strong>in</strong> even a low <strong>diversity</strong><br />
reduction (8% <strong>of</strong> runs show<strong>in</strong>g .50% reduction <strong>in</strong> <strong>diversity</strong> and 0.4% hav<strong>in</strong>g<br />
.90% reduction with CV ¼ 0.2). With very substantial tribal fitness variation<br />
(CV ¼ 0.4), reduced <strong>genetic</strong> <strong>diversity</strong> was more frequent, but <strong>in</strong> <strong>the</strong>se runs <strong>the</strong> total<br />
population frequently went ext<strong>in</strong>ct. In <strong>the</strong> second scenario, with mass mortality <strong>of</strong><br />
tribes, fairly low rates <strong>of</strong> tribal extirpation (1.25% per generation) produced some<br />
reductions <strong>in</strong> <strong>genetic</strong> <strong>diversity</strong> (7% <strong>of</strong> runs show<strong>in</strong>g greater than 50% reduction <strong>in</strong><br />
<strong>genetic</strong> <strong>diversity</strong>), but population ext<strong>in</strong>ction was even more prevalent (22% <strong>of</strong> runs,<br />
Table 2). To reduce <strong>genetic</strong> <strong>diversity</strong> substantially us<strong>in</strong>g non-heritable variation <strong>in</strong><br />
tribal fitness, a reasonable proportion <strong>of</strong> <strong>the</strong> tribes <strong>in</strong> a population must be<br />
extirpated with<strong>in</strong> not too many generations, but, if this happens, <strong>the</strong>n <strong>the</strong><br />
population itself is at considerable risk.<br />
DISCUSSION<br />
Generality and Validity <strong>of</strong> Results<br />
The results suggest that <strong>cultural</strong> hitchhik<strong>in</strong>g will reduce <strong>genetic</strong> <strong>diversity</strong> if: (1)<br />
<strong>genetic</strong> mutations are not too frequent (relative to tribal turnover); (2) tribes split<br />
fairly frequently when <strong>the</strong>y constitute a substantial part <strong>of</strong> <strong>the</strong> population so that,<br />
before <strong>cultural</strong> evolution comes <strong>in</strong>to play, <strong>the</strong>re are quite a number <strong>of</strong> small tribes;<br />
(3) <strong>in</strong>dividuals rarely move between tribes (Nm ,;10); (4) cultures evolve at least<br />
slowly (with <strong>the</strong> <strong>cultural</strong>ly determ<strong>in</strong>ed contribution to <strong>the</strong> fitness <strong>of</strong> a tribe<br />
chang<strong>in</strong>g by a mean <strong>of</strong> more than about 0.005%/generation); and (5) <strong>cultural</strong><br />
assimilation changes fitness less than <strong>cultural</strong> <strong>in</strong>novation. These results are<br />
consistent with those from more general <strong>the</strong>ory <strong>of</strong> subdivided populations (e.g.,<br />
Whitlock and Barton 1997), especially that as connections between subpopulations<br />
are reduced, expected <strong>genetic</strong> <strong>diversity</strong> decreases.<br />
Although much more realistic than its predecessor (Whitehead 1998), <strong>the</strong> model<br />
used here still simplifies <strong>the</strong> social, demographic, <strong>genetic</strong>, and <strong>cultural</strong> dynamics <strong>of</strong><br />
a real population <strong>of</strong> matril<strong>in</strong>eal <strong>whales</strong>, or any o<strong>the</strong>r animals. So how likely are <strong>the</strong>se<br />
results to <strong>in</strong>dicate whe<strong>the</strong>r <strong>genetic</strong> <strong>diversity</strong> has been reduced by <strong>cultural</strong> evolution<br />
<strong>in</strong> real populations
WHITEHEAD: CULTURAL EVOLUTION<br />
71<br />
Table 2. Results <strong>of</strong> runn<strong>in</strong>g model with non-heritable variation <strong>in</strong> tribal fitness <strong>in</strong><br />
control conditions (no variation), different levels <strong>of</strong> normally distributed variation <strong>in</strong> tribal<br />
fitness (given by <strong>the</strong> standard deviation <strong>of</strong> <strong>the</strong> tribal fitness, m) and with mass tribal<br />
mortality (at a rate <strong>of</strong> d per generation). Shown are <strong>the</strong> number <strong>of</strong> runs with little (,50%),<br />
moderate (50%–90%) or severe (.90%) reductions <strong>in</strong> haplotype <strong>diversity</strong> after 200<br />
generations, as well as <strong>the</strong> number <strong>of</strong> runs <strong>in</strong> which <strong>the</strong> total population went ext<strong>in</strong>ct.<br />
Reduction <strong>in</strong> haplotype <strong>diversity</strong><br />
Conditions ,50% 50%–90% .90% Ext<strong>in</strong>ction<br />
Control 756 4 0 0<br />
m ¼ 0.05 757 3 0 0<br />
m ¼ 0.10 745 14 1 0<br />
m ¼ 0.20 700 57 3 0<br />
m ¼ 0.40 473 130 65 92<br />
d ¼ 0.0125 544 29 21 166<br />
d ¼ 0.0250 285 46 18 411<br />
d ¼ 0.0500 132 35 13 580<br />
d ¼ 0.1000 71 38 29 622<br />
The patterns found over a wide range <strong>of</strong> parameter estimates and model variants<br />
usually agreed, and <strong>the</strong> general results concord with those <strong>of</strong> <strong>the</strong> quite differently<br />
structured territorial model used to <strong>in</strong>vestigate <strong>cultural</strong> hitchhik<strong>in</strong>g <strong>in</strong> humans<br />
(Whitehead et al. 2002). Conditions for <strong>cultural</strong> hitchhik<strong>in</strong>g were similar between<br />
<strong>the</strong> results <strong>of</strong> <strong>the</strong> two <strong>models</strong> for migration rates among tribes and <strong>the</strong> amount <strong>of</strong><br />
permissible <strong>cultural</strong> assimilation between tribes. However, rates <strong>of</strong> <strong>cultural</strong><br />
evolution as low as 0.005%/generation led to reduced <strong>genetic</strong> <strong>diversity</strong> <strong>in</strong> <strong>the</strong><br />
geographically unstructured model used here, whereas <strong>the</strong> territorial model for<br />
humans set a lower limit at about 0.3%/generation. This difference may relate to <strong>the</strong><br />
<strong>in</strong>creased importance <strong>of</strong> stochastic events <strong>in</strong> <strong>the</strong> highly structured human model.<br />
The model assumes that <strong>in</strong>novations spread through tribes with<strong>in</strong> a generation.<br />
This may not be realistic, especially with large tribe sizes. However, a gradual<br />
change <strong>in</strong> tribal fitness over a few generations, ra<strong>the</strong>r than <strong>the</strong> sudden step modeled<br />
here, would seem unlikely to change <strong>the</strong> results <strong>of</strong> <strong>the</strong> model<strong>in</strong>g <strong>in</strong> any substantial<br />
way. In killer <strong>whales</strong>, Orc<strong>in</strong>us orca, (Table 3), and humans, <strong>the</strong>re are <strong>cultural</strong><br />
differences at several levels <strong>of</strong> social structure, which could allow multilevel <strong>cultural</strong><br />
hitchhik<strong>in</strong>g, where <strong>in</strong>novations spread quickly through ‘‘subtribes’’ and <strong>the</strong>n more<br />
slowly, or perhaps never, <strong>in</strong>to <strong>the</strong> wider tribe. Model<strong>in</strong>g such situations would be<br />
complex, but I can see no reason why <strong>the</strong> results should not be basically similar to<br />
those found here.<br />
The model used <strong>in</strong> this paper is conservative <strong>in</strong> several respects. For practical<br />
reasons, it only considered 200 generations <strong>of</strong> <strong>cultural</strong> evolution, and, especially with<br />
low rates <strong>of</strong> <strong>cultural</strong> evolution (e.g., Fig. 2), <strong>the</strong> process may take longer to operate.<br />
Additionally, when tribes split, <strong>the</strong> model randomly assigns <strong>in</strong>dividuals to <strong>the</strong> two<br />
daughter tribes. In reality, <strong>the</strong> tribal division is likely to occur, at least partially,<br />
along k<strong>in</strong>ship l<strong>in</strong>es (e.g., <strong>in</strong> killer <strong>whales</strong>; Ford et al. 2000) so that <strong>the</strong> daughter tribes<br />
will have less <strong>in</strong>ternal <strong>genetic</strong> <strong>diversity</strong> and more <strong>genetic</strong> divergence than envisioned<br />
by <strong>the</strong> model, thus provid<strong>in</strong>g a better substrate for <strong>cultural</strong> hitchhik<strong>in</strong>g. Similarly,<br />
<strong>in</strong>tertribe migration may be preferentially directed to <strong>genetic</strong>ally, and/or <strong>cultural</strong>ly,<br />
similar tribes, <strong>in</strong> contrast to <strong>the</strong> random movement modeled.
72 MARINE MAMMAL SCIENCE, VOL. 21, NO. 1, 2005<br />
Table 3. Possible <strong>cultural</strong> ‘‘tribes’’ <strong>in</strong> matril<strong>in</strong>eal <strong>whales</strong>.<br />
Species ‘‘Tribe’’ Tribe size<br />
Killer whale ‘‘Type’’ (‘‘resident’’,<br />
‘‘transient’’)<br />
‘‘Resident’’<br />
killer whale<br />
Intertribe<br />
migration<br />
rate <strong>of</strong> females<br />
Mat<strong>in</strong>g<br />
with<strong>in</strong><br />
tribe<br />
Cultural attributes<br />
<strong>of</strong> tribe<br />
;1,000–10,000 None Yes Vocal repertoire, forag<strong>in</strong>g<br />
patterns, habitat use, social<br />
system, diet<br />
‘‘Community’’ ;100 Low Yes, usually Vocal repertoire, habitat<br />
use, greet<strong>in</strong>g ceremonies<br />
‘‘Clan’’ ;50 Very low Usually<br />
no<br />
Vocal repertoire<br />
‘‘Pod’’ ;10 High No Vocal repertoire, forag<strong>in</strong>g<br />
patterns<br />
‘‘Matril<strong>in</strong>eal group’’ ;4 Very low No Vocal repertoire<br />
Sperm whale ‘‘Social unit’’ ;10 Some No Vocal repertoire,<br />
movement patterns<br />
‘‘Clan’’ ;10,000 Probably low Vocal repertoire, habitat<br />
use, movement patterns<br />
Longf<strong>in</strong>ned<br />
pilot whale<br />
Shortf<strong>in</strong>ned<br />
pilot whale<br />
‘‘Unit’’ ;10 <br />
‘‘Pod’’ ;100 Very rare <br />
‘‘Pod’’ ;10 <br />
References:<br />
Killer <strong>whales</strong>: Baird 2000, Barrett-Lennard 2000, Ford et al. 2000, Hoelzel et al. 2002, Yurk 2003.<br />
Sperm <strong>whales</strong>: Whitehead 1999b, 2003b, Whitehead and Weilgart 2000, Rendell and Whitehead 2003, Whitehead and Rendell 2004.<br />
Longf<strong>in</strong>ned pilot whale: Amos 1993, Ottensmeyer and Whitehead 2003.<br />
Shortf<strong>in</strong>ned pilot whale: Heimlich-Boran 1993, as <strong>in</strong>terpreted by Ottensmeyer and Whitehead 2003.
WHITEHEAD: CULTURAL EVOLUTION<br />
73<br />
For all <strong>the</strong>se reasons I believe that <strong>the</strong> model gives useful <strong>in</strong>dications as to <strong>the</strong><br />
conditions <strong>in</strong> which <strong>genetic</strong> <strong>diversity</strong> <strong>in</strong> a haploid gene may be reduced by <strong>cultural</strong><br />
evolution.<br />
The results can easily be extended to diploid genes, simply by replac<strong>in</strong>g <strong>the</strong> term<br />
‘‘<strong>in</strong>dividuals’’ by ‘‘gene copies’’ <strong>in</strong> <strong>the</strong> formulation <strong>of</strong> <strong>the</strong> model. Thus <strong>the</strong><br />
equilibrium population conta<strong>in</strong>s K/2 <strong>in</strong>dividuals, and an average <strong>of</strong> m/2 <strong>in</strong>dividuals<br />
migrate between tribes or mate across tribes per generation.<br />
Relationship to O<strong>the</strong>r Models<br />
Gene-culture coevolution has been explored from a number <strong>of</strong> perspectives, us<strong>in</strong>g<br />
a wide range <strong>of</strong> <strong>models</strong> (e.g., Feldman and Cavalli-Sforza 1984, Boyd and Richerson<br />
1985, Laland 1992, Bull et al. 2000). A general result <strong>of</strong> this work is that <strong>in</strong> a dualreplicator<br />
system, <strong>cultural</strong> evolution may, under some circumstances, affect <strong>genetic</strong><br />
evolution, and vice versa. Among <strong>the</strong> results most relevant to <strong>the</strong> <strong>cultural</strong><br />
hitchhik<strong>in</strong>g hypo<strong>the</strong>sis are Whitlock and Barton’s (1997) general conclusion that<br />
population subdivision, result<strong>in</strong>g from any mechanism, tends to reduce <strong>genetic</strong><br />
<strong>diversity</strong>, and Bull et al.’s (2000) model <strong>of</strong> meme-gene coevolution which found<br />
that <strong>cultural</strong> evolution can have a ‘‘significantly detrimental effect on <strong>the</strong> evolution<br />
<strong>of</strong> genes.’’ However, as far as I know, <strong>the</strong> only o<strong>the</strong>r <strong>models</strong> that have specifically<br />
addressed <strong>the</strong> effects <strong>of</strong> <strong>cultural</strong> evolution on <strong>the</strong> <strong>diversity</strong> <strong>of</strong> neutral genes are <strong>the</strong><br />
orig<strong>in</strong>al, and greatly simplified, presentation <strong>of</strong> <strong>cultural</strong> hitchhik<strong>in</strong>g (Whitehead<br />
1998), and <strong>the</strong> territorial model developed to explore <strong>the</strong> issues <strong>in</strong> humans<br />
(Whitehead et al. 2002).<br />
Detect<strong>in</strong>g Cultural Hitchhik<strong>in</strong>g<br />
Cultural hitchhik<strong>in</strong>g depends on <strong>cultural</strong>ly determ<strong>in</strong>ed fitness differences<br />
between tribes, and <strong>genetic</strong> divergence among <strong>the</strong>m (Fig. 1, 6). Thus, I had hoped<br />
that assessments <strong>of</strong> <strong>genetic</strong> and <strong>cultural</strong> <strong>diversity</strong> among tribes might be used to<br />
<strong>in</strong>dicate whe<strong>the</strong>r <strong>cultural</strong> hitchhik<strong>in</strong>g had operated. Unfortunately, <strong>the</strong> process <strong>of</strong><br />
<strong>cultural</strong> hitchhik<strong>in</strong>g <strong>of</strong>ten reduces both <strong>cultural</strong> and <strong>genetic</strong> divergence among<br />
tribes (Fig. 1, 6), and so this hope was not fulfilled. There are both <strong>the</strong>oretical and<br />
empirical grounds (<strong>in</strong> humans) for believ<strong>in</strong>g that <strong>cultural</strong> evolution may<br />
homogenize populations (e.g., Laland et al. 2000).<br />
However, <strong>the</strong> process may leave o<strong>the</strong>r dist<strong>in</strong>ctive <strong>genetic</strong> or <strong>cultural</strong> traces. If <strong>the</strong><br />
fitness-<strong>in</strong>fluenc<strong>in</strong>g culture transmits <strong>in</strong> parallel with one set <strong>of</strong> genes but not<br />
ano<strong>the</strong>r, we might expect reduced <strong>diversity</strong> <strong>in</strong> <strong>the</strong> former but not <strong>the</strong> latter. So, if<br />
culture transmits, and tribes are formed, along matril<strong>in</strong>eal l<strong>in</strong>es, <strong>the</strong>n mtDNA<br />
<strong>diversity</strong> may be reduced, but not that <strong>of</strong> patril<strong>in</strong>eally-transmitted genes, such as<br />
those <strong>in</strong> <strong>the</strong> Y-chromosome <strong>of</strong> mammals. Measures <strong>of</strong> <strong>the</strong> relative <strong>diversity</strong> <strong>of</strong> genes<br />
with different transmission systems can thus <strong>in</strong>dicate <strong>the</strong> presence <strong>of</strong> <strong>cultural</strong><br />
hitchhik<strong>in</strong>g <strong>in</strong> populations with reduced <strong>genetic</strong> <strong>diversity</strong> (Schlötterer 1999). They<br />
may allow us to dist<strong>in</strong>guish between <strong>cultural</strong> hitchhik<strong>in</strong>g and population<br />
bottlenecks as causes <strong>of</strong> reduced <strong>diversity</strong>, as a bottleneck reduces <strong>the</strong> <strong>diversity</strong> <strong>of</strong><br />
all genes (although not equally, see Amos 1996, and assortative mat<strong>in</strong>g may<br />
complicate <strong>the</strong> picture). However, such measures <strong>of</strong> relative gene <strong>diversity</strong> cannot<br />
dist<strong>in</strong>guish between <strong>cultural</strong> hitchhik<strong>in</strong>g and molecular hitchhik<strong>in</strong>g (Maynard<br />
Smith and Haigh 1974). Also, when mat<strong>in</strong>g is with<strong>in</strong> tribes, all genes are<br />
transmitted <strong>in</strong> parallel with <strong>the</strong> culture.
74 MARINE MAMMAL SCIENCE, VOL. 21, NO. 1, 2005<br />
Ano<strong>the</strong>r approach is to look at <strong>the</strong> dynamics <strong>of</strong> <strong>the</strong> population; <strong>in</strong>stead <strong>of</strong> G ST ,we<br />
could exam<strong>in</strong>e <strong>in</strong>tertribe migration directly; <strong>in</strong>stead <strong>of</strong> CV(w), study <strong>cultural</strong><br />
evolution with<strong>in</strong> tribes, and <strong>cultural</strong> assimilation between <strong>the</strong>m. Unfortunately,<br />
<strong>the</strong>se dynamic studies are generally much harder to address than <strong>the</strong> ‘‘snapshot’’<br />
measures.<br />
Cultural Hitchhik<strong>in</strong>g <strong>in</strong> Matril<strong>in</strong>eal Whales<br />
So can I say more about <strong>the</strong> orig<strong>in</strong>al hypo<strong>the</strong>sis (Whitehead 1998), that <strong>cultural</strong><br />
hitchhik<strong>in</strong>g has reduced <strong>the</strong> mtDNA <strong>diversity</strong> <strong>of</strong> four species <strong>of</strong> matril<strong>in</strong>eal whale,<br />
<strong>the</strong> killer whale, <strong>the</strong> sperm whale (Physeter macrocephalus), <strong>the</strong> shortf<strong>in</strong>ned pilot<br />
whale (Globicephala macrorhynchus), and <strong>the</strong> longf<strong>in</strong>ned pilot whale (G. melas) In all<br />
<strong>the</strong>se species, mtDNA <strong>diversity</strong> is many-fold below that found <strong>in</strong> o<strong>the</strong>r species <strong>of</strong><br />
Cetacea with similar population sizes (Whitehead 1998) and geographic ranges<br />
(Whitehead 2003a). Here I will reassess <strong>the</strong> likelihood <strong>of</strong> <strong>cultural</strong> hitchhik<strong>in</strong>g<br />
with<strong>in</strong> <strong>the</strong>se species <strong>in</strong> <strong>the</strong> light <strong>of</strong> <strong>the</strong> results presented <strong>in</strong> this paper and new<br />
results on <strong>the</strong> social, <strong>genetic</strong>, and <strong>cultural</strong> structures <strong>of</strong> <strong>the</strong>ir populations.<br />
Firstly, <strong>cultural</strong> hitchhik<strong>in</strong>g, at least <strong>in</strong> haplotype <strong>diversity</strong>, requires that <strong>the</strong><br />
mutation rate should be less than about ten times <strong>the</strong> <strong>in</strong>verse <strong>of</strong> <strong>the</strong> population size.<br />
Mutation rates <strong>in</strong> <strong>the</strong> part <strong>of</strong> <strong>the</strong> control region <strong>of</strong> <strong>the</strong> mitochondrial genome <strong>of</strong><br />
cetaceans that is usually sequenced are <strong>of</strong> <strong>the</strong> order <strong>of</strong> 10 7 /generation (Whitehead<br />
1998), which means that, even with population sizes <strong>of</strong> 1,000,000 <strong>whales</strong> as is<br />
reasonable for sperm and pilot <strong>whales</strong>, <strong>the</strong> mutation rate lies well below <strong>the</strong> <strong>in</strong>verse<br />
<strong>of</strong> <strong>the</strong> population size.<br />
We need ‘‘tribes’’ to assess <strong>the</strong> o<strong>the</strong>r four conditions for <strong>cultural</strong> hitchhik<strong>in</strong>g<br />
suggested by <strong>the</strong> model<strong>in</strong>g: that tribes split when <strong>the</strong>y become large; that<br />
movement between tribes is limited; that tribal cultures evolve, and that<br />
<strong>in</strong>novation with<strong>in</strong> tribes is more important than assimilation. Table 3 lists potential<br />
candidates for tribes <strong>in</strong> <strong>the</strong> matril<strong>in</strong>eal <strong>whales</strong> under <strong>the</strong> names (‘‘pods,’’ ‘‘clans,’’<br />
‘‘units,’’ ...) which have been used <strong>in</strong> <strong>the</strong> primary literature for <strong>the</strong>se species.<br />
The killer whale is <strong>the</strong> best known <strong>of</strong> <strong>the</strong> four species, especially from studies <strong>in</strong><br />
<strong>the</strong> vic<strong>in</strong>ity <strong>of</strong> Vancouver Island <strong>of</strong>f <strong>the</strong> west coast <strong>of</strong> North America. A range <strong>of</strong><br />
matril<strong>in</strong>eally based and hierarchically organized social structures are recognized,<br />
each mapped onto <strong>cultural</strong> dist<strong>in</strong>ctions (Table 3; Baird 2000). Any <strong>of</strong> <strong>the</strong>se could<br />
have been subject to <strong>cultural</strong> hitchhik<strong>in</strong>g, although all have some drawbacks as<br />
candidates for <strong>the</strong> ‘‘tribes’’ <strong>of</strong> my model. At one extreme, <strong>the</strong> ‘‘types’’ are so different<br />
that <strong>the</strong>y may well be subspecies and do not appear to compete for resources (Baird<br />
2000) and, at <strong>the</strong> o<strong>the</strong>r, ‘‘matril<strong>in</strong>eal groups’’ are very small and so less <strong>in</strong>dicative<br />
<strong>of</strong> <strong>cultural</strong> hitchhik<strong>in</strong>g (Table 3). The best candidates may be ‘‘clans’’ or<br />
‘‘communities.’’ Killer whale communities are at least sometimes geographically<br />
based (Ford et al. 2000), and so <strong>the</strong> results <strong>of</strong> <strong>the</strong> model described <strong>in</strong> this paper may<br />
be less applicable than those <strong>of</strong> <strong>the</strong> territorial model developed for humans<br />
(Whitehead et al. 2002). Non-vocal culture is not well recognized at <strong>the</strong> level <strong>of</strong> <strong>the</strong><br />
clan, but it may exist. We do know that some killer whale social entities split when<br />
large (Ford et al. 2000), that killer whale cultures evolve (Deecke et al. 2000), and<br />
we can <strong>in</strong>fer from <strong>the</strong> <strong>cultural</strong> dist<strong>in</strong>ctiveness <strong>of</strong> <strong>the</strong> social structures (Table 3) that<br />
assimilation does not overwhelm <strong>in</strong>novation. Thus, data on killer <strong>whales</strong> are<br />
generally consistent with <strong>the</strong> conditions for <strong>cultural</strong> hitchhik<strong>in</strong>g, although I have<br />
some doubts as to whe<strong>the</strong>r <strong>the</strong>re are suitable tribes. Both nuclear and mtDNA<br />
<strong>diversity</strong> are low <strong>in</strong> killer <strong>whales</strong> (Hoelzel et al. 2002), <strong>in</strong>dicat<strong>in</strong>g that, if <strong>cultural</strong>
WHITEHEAD: CULTURAL EVOLUTION<br />
75<br />
hitchhik<strong>in</strong>g has operated <strong>in</strong> this species, it did so at a level at which mat<strong>in</strong>g occurs<br />
predom<strong>in</strong>antly with<strong>in</strong> tribes, such as ‘‘communities’’ or ‘‘types.’’ Of course, <strong>cultural</strong><br />
hitchhik<strong>in</strong>g may have operated at more than one <strong>of</strong> <strong>the</strong> levels <strong>of</strong> killer whale social<br />
structure, simultaneously or sequentially.<br />
There are two currently known candidates for tribes <strong>in</strong> sperm <strong>whales</strong> (Table 3).<br />
‘‘Social units’’ may be too small and unstable (Christal et al. 1998) to support<br />
<strong>cultural</strong> hitchhik<strong>in</strong>g (Mesnick et al. 1999). The recently discovered ‘‘clans,’’ which<br />
are large, sympatric, and dist<strong>in</strong>ctive <strong>in</strong> vocal and non-vocal cultures, seem excellent<br />
candidates (Rendell and Whitehead 2003, Whitehead and Rendell 2004), but <strong>the</strong><br />
rates <strong>of</strong> migration among <strong>the</strong>m and <strong>cultural</strong> evolution with<strong>in</strong> <strong>the</strong>m have yet to be<br />
estimated. In sperm <strong>whales</strong>, nuclear DNA, unlike mtDNA, seems diverse (Lyrholm<br />
et al. 1999), consistent with <strong>cultural</strong> hitchhik<strong>in</strong>g <strong>in</strong> a population with at least some<br />
mat<strong>in</strong>g between tribes.<br />
The social and population structures <strong>of</strong> pilot <strong>whales</strong> are less well known, and<br />
<strong>the</strong>re have been no published studies <strong>of</strong> <strong>cultural</strong> attributes <strong>in</strong> <strong>the</strong>se species. The two<br />
potential tribe structures suggested for longf<strong>in</strong>ned pilot <strong>whales</strong>, ‘‘units’’ and ‘‘pods’’<br />
(Table 3), come from very different types <strong>of</strong> study, and are <strong>in</strong> some ways mutually<br />
<strong>in</strong>compatible (Ottensmeyer and Whitehead 2003). However, pilot whale societies<br />
seem, <strong>in</strong> some ways, comparable to those found <strong>in</strong> killer and sperm <strong>whales</strong>, and<br />
<strong>the</strong>re may be o<strong>the</strong>r tribe-like structures not listed <strong>in</strong> Table 3; it took many years <strong>of</strong><br />
work before ‘‘clans’’ were uncovered <strong>in</strong> ei<strong>the</strong>r killer or sperm <strong>whales</strong> (Ford 1991,<br />
Rendell and Whitehead 2003).<br />
What k<strong>in</strong>ds <strong>of</strong> culture could drive <strong>cultural</strong> hitchhik<strong>in</strong>g <strong>in</strong> <strong>the</strong>se species They<br />
would need to be quite stable across generations, affect fitness, and be hard to<br />
assimilate. As <strong>in</strong> <strong>the</strong> case <strong>of</strong> humans (Whitehead et al. 2002), elements <strong>of</strong> social<br />
behavior and forag<strong>in</strong>g strategies may be <strong>the</strong> best candidates. For killer and sperm<br />
<strong>whales</strong> <strong>the</strong>re is good evidence that <strong>cultural</strong> variation <strong>in</strong> forag<strong>in</strong>g strategies exists<br />
among <strong>the</strong> putative tribes listed <strong>in</strong> Table 3 (Boran and Heimlich 1999, Whitehead<br />
and Rendell 2004), and <strong>in</strong> sperm <strong>whales</strong> at least <strong>the</strong>se translate <strong>in</strong>to differences <strong>in</strong><br />
forag<strong>in</strong>g success, and so probably fitness (Whitehead and Rendell 2004).<br />
Thus, <strong>the</strong> results <strong>of</strong> <strong>the</strong> model<strong>in</strong>g <strong>in</strong> this paper, and empirical research <strong>in</strong> <strong>the</strong> past<br />
five years, have streng<strong>the</strong>ned <strong>the</strong> case for <strong>cultural</strong> hitchhik<strong>in</strong>g <strong>in</strong> <strong>the</strong> matril<strong>in</strong>eal<br />
<strong>whales</strong>. In particular, <strong>the</strong> model<strong>in</strong>g <strong>in</strong> this paper and new empirical results largely<br />
resolve concerns about <strong>the</strong> constancy <strong>of</strong> <strong>in</strong>novations (Deecke et al. 2000) and <strong>the</strong><br />
stability <strong>of</strong> whale societies (Mesnick et al. 1999, Tiedemann and Mil<strong>in</strong>kovitch<br />
1999) raised by <strong>the</strong> results <strong>of</strong> <strong>the</strong> orig<strong>in</strong>al simple model (Whitehead 1998). The<br />
results <strong>in</strong> this paper substantially widen <strong>the</strong> conditions under which <strong>cultural</strong><br />
hitchhik<strong>in</strong>g may occur compared with <strong>the</strong> previous model; for <strong>in</strong>stance, by<br />
allow<strong>in</strong>g <strong>cultural</strong> evolution <strong>in</strong> many small steps, by allow<strong>in</strong>g negative as well as<br />
positive <strong>in</strong>novations, by <strong>in</strong>creas<strong>in</strong>g <strong>the</strong> amount <strong>of</strong> allowable <strong>in</strong>tertribe migration,<br />
and by considerably lower<strong>in</strong>g <strong>the</strong> m<strong>in</strong>imum rate <strong>of</strong> <strong>cultural</strong> evolution that is<br />
consistent with <strong>cultural</strong> hitchhik<strong>in</strong>g.<br />
The results <strong>of</strong> this paper fur<strong>the</strong>r weaken <strong>the</strong> case for demographic, non-heritable<br />
processes as <strong>the</strong> sole cause <strong>of</strong> <strong>the</strong> low mtDNA <strong>diversity</strong> <strong>of</strong> <strong>the</strong> matril<strong>in</strong>eal <strong>whales</strong>.<br />
Although such processes can reduce a population’s <strong>genetic</strong> <strong>diversity</strong>, <strong>in</strong> <strong>the</strong> version<br />
with vary<strong>in</strong>g fitness, <strong>the</strong> variation must be substantial, a mean <strong>of</strong> at least 20% per<br />
generation compared with a lower limit <strong>of</strong> about 0.005% per generation for<br />
heritable <strong>cultural</strong> variation, and such populations are very likely to be driven<br />
ext<strong>in</strong>ct (Table 2). In <strong>the</strong> tribal extirpation model, population ext<strong>in</strong>ction is even<br />
more likely (Table 2). Variations <strong>of</strong> <strong>the</strong> demographic <strong>models</strong> could possibly be
76 MARINE MAMMAL SCIENCE, VOL. 21, NO. 1, 2005<br />
<strong>in</strong>troduced to safeguard <strong>the</strong> total population from ext<strong>in</strong>ction but allow frequent<br />
tribal extirpations (perhaps by hav<strong>in</strong>g a lower tribal extirpation rate if a tribe is <strong>the</strong><br />
only one left <strong>in</strong> <strong>the</strong> population, or <strong>the</strong> spatial effect mentioned by Tiedemann and<br />
Mil<strong>in</strong>kovitch 1999). If tribes split along matril<strong>in</strong>eal l<strong>in</strong>es, or <strong>in</strong>tertribe migrations<br />
are pr<strong>in</strong>cipally between <strong>genetic</strong>ally similar tribes, <strong>the</strong>n, as <strong>in</strong> <strong>the</strong> case <strong>of</strong> <strong>cultural</strong><br />
hitchhik<strong>in</strong>g, reductions <strong>in</strong> <strong>genetic</strong> <strong>diversity</strong> may be more readily achieved by<br />
demographic processes than is <strong>in</strong>dicated by <strong>the</strong> <strong>models</strong> used here. However, with<br />
<strong>the</strong> results now available, <strong>the</strong> purely demographic <strong>models</strong> do not appear to be very<br />
promis<strong>in</strong>g alternatives to <strong>cultural</strong> hitchhik<strong>in</strong>g.<br />
It seems likely that comb<strong>in</strong>ations <strong>of</strong> non-heritable and heritable tribal fitness<br />
can effectively reduce <strong>genetic</strong> <strong>diversity</strong>. Thus, <strong>the</strong> demographic and <strong>cultural</strong><br />
hitchhik<strong>in</strong>g explanations for <strong>the</strong> low mtDNA <strong>diversity</strong> <strong>of</strong> <strong>the</strong> matril<strong>in</strong>eal <strong>whales</strong><br />
are not mutually exclusive.<br />
O<strong>the</strong>r explanations for <strong>the</strong> reduced mtDNA <strong>diversity</strong> <strong>of</strong> <strong>the</strong> matril<strong>in</strong>eal <strong>whales</strong>,<br />
such as <strong>genetic</strong> bottlenecks (Lyrholm et al. 1996, Hoelzel et al. 2002) and selection<br />
(Janik 2001), should not be discarded, although <strong>the</strong>y also seem to make assumptions<br />
or predictions that are <strong>in</strong>consistent with what we know <strong>of</strong> <strong>the</strong> biology <strong>of</strong> <strong>the</strong><br />
species (Whitehead 1999a, Rendell and Whitehead 2001).<br />
Cultural Hitchhik<strong>in</strong>g <strong>in</strong> O<strong>the</strong>r Species<br />
The phenomenon modeled here could have occurred <strong>in</strong> o<strong>the</strong>r animals, but <strong>the</strong>y<br />
would need to possess a ra<strong>the</strong>r unusual comb<strong>in</strong>ation <strong>of</strong> characters: little<br />
geographically based population structure, social structur<strong>in</strong>g <strong>in</strong>to tribes with<br />
dist<strong>in</strong>ctive cultures, and low <strong>in</strong>tertribe gene flow. Little-studied cetaceans,<br />
especially among <strong>the</strong> larger odontocetes, such as false killer <strong>whales</strong> (Pseudorca<br />
crassidens) and narwhals (Monodon monoceros), are perhaps <strong>the</strong> best candidates, and<br />
both <strong>of</strong> <strong>the</strong>se species have low mtDNA <strong>diversity</strong> (Palsbøll et al. 1997, Chivers et al.<br />
2003 1 ). In both elephants and bats <strong>the</strong>re are sympatric social structures which seem<br />
to have dist<strong>in</strong>ctive cultures (Moss and Poole 1983, Boughman and Wilk<strong>in</strong>son<br />
1998, McComb et al. 2001), but <strong>in</strong> <strong>the</strong>se species geographical barriers probably<br />
usually prevent species-wide <strong>cultural</strong> hitchhik<strong>in</strong>g (see e.g., Georgiadis et al. 1994).<br />
Conclusion<br />
The <strong>models</strong> developed <strong>in</strong> this paper considerably widen <strong>the</strong> known conditions<br />
under which <strong>cultural</strong> processes may reduce <strong>genetic</strong> <strong>diversity</strong> through <strong>cultural</strong><br />
hitchhik<strong>in</strong>g. With<strong>in</strong> geographically unstructured populations, considerable reduction<br />
<strong>of</strong> <strong>genetic</strong> <strong>diversity</strong> requires only low levels <strong>of</strong> <strong>cultural</strong> evolution, and<br />
<strong>diversity</strong> is still reduced with moderate levels <strong>of</strong> <strong>in</strong>tertribe migration and <strong>cultural</strong><br />
assimilation. Knowledge <strong>of</strong> <strong>the</strong> population and social structure <strong>of</strong> <strong>the</strong> matril<strong>in</strong>eal<br />
<strong>whales</strong> is largely consistent with <strong>the</strong> conditions for <strong>cultural</strong> hitchhik<strong>in</strong>g. The results<br />
<strong>in</strong>validate some previous criticisms <strong>of</strong> <strong>cultural</strong> hitchhik<strong>in</strong>g <strong>in</strong> <strong>the</strong> matril<strong>in</strong>eal <strong>whales</strong><br />
and <strong>in</strong>dicate <strong>the</strong> implausibility <strong>of</strong> alternative scenarios us<strong>in</strong>g purely demographic<br />
<strong>models</strong>, although non-heritable and heritable fitness variation may work toge<strong>the</strong>r to<br />
1 Chivers, S. J., R. G. LeDuc and R. W. Baird. 2003. Hawaiian island populations <strong>of</strong> false killer<br />
<strong>whales</strong> and shortf<strong>in</strong>ned pilot <strong>whales</strong> revealed by <strong>genetic</strong> analysis. Abstract. 15th Biennial Conference on<br />
<strong>the</strong> Biology <strong>of</strong> Mar<strong>in</strong>e Mammals. Greensboro, NC. December 2003. Page 32.
WHITEHEAD: CULTURAL EVOLUTION<br />
77<br />
reduce <strong>genetic</strong> <strong>diversity</strong>, and it would be worth exam<strong>in</strong><strong>in</strong>g <strong>the</strong> effects <strong>of</strong> revis<strong>in</strong>g <strong>the</strong><br />
<strong>models</strong> so that tribes split along matril<strong>in</strong>eal l<strong>in</strong>es and/or <strong>in</strong>tertribe migrations are<br />
pr<strong>in</strong>cipally between <strong>genetic</strong>ally similar tribes. Thus, I have streng<strong>the</strong>ned <strong>the</strong> case for<br />
<strong>cultural</strong> hitchhik<strong>in</strong>g <strong>in</strong> <strong>the</strong> matril<strong>in</strong>eal <strong>whales</strong>, but it is still far from proven.<br />
Unfortunately, this study also shows that measures <strong>of</strong> <strong>genetic</strong> and <strong>cultural</strong> variation<br />
among tribes are not good <strong>in</strong>dicators <strong>of</strong> past <strong>cultural</strong> hitchhik<strong>in</strong>g.<br />
ACKNOWLEDGMENTS<br />
This research was supported by <strong>the</strong> Natural Sciences and Eng<strong>in</strong>eer<strong>in</strong>g Research Council <strong>of</strong><br />
Canada. Many thanks to Meaghan Jankowski, Robert Latta (who suggested runn<strong>in</strong>g <strong>the</strong><br />
<strong>models</strong> with demographic alternatives and purely negative <strong>in</strong>novations), Andrea<br />
Ottensmeyer, Luke Rendell, Harald Yurk, and two anonymous reviewers for helpful<br />
comments on manuscripts.<br />
LITERATURE CITED<br />
AMOS, B. 1993. Use <strong>of</strong> molecular probes to analyse pilot whale pod structure: Two novel<br />
analytical approaches. Symposia <strong>of</strong> <strong>the</strong> Zoological Society, London 66:33–48.<br />
AMOS, B. 1996. Levels <strong>of</strong> variability <strong>in</strong> cetacean populations have probably changed little as<br />
a result <strong>of</strong> human activities. Report <strong>of</strong> <strong>the</strong> International Whal<strong>in</strong>g Commission 46:<br />
657–658.<br />
AMOS, W. 1999. Culture and <strong>genetic</strong> evolution <strong>in</strong> <strong>whales</strong>. Science 284:2055a.<br />
BAIRD, R. W. 2000. The killer whale—forag<strong>in</strong>g specializations and group hunt<strong>in</strong>g. Pages<br />
127–153 <strong>in</strong> J. Mann, R. C. Connor, P. Tyack and H. Whitehead, eds. Cetacean<br />
societies. University <strong>of</strong> Chicago Press, Chicago, IL.<br />
BARRETT-LENNARD, L. 2000. Population structure and mat<strong>in</strong>g patterns <strong>of</strong> killer <strong>whales</strong><br />
(Orc<strong>in</strong>us orca) as revealed by DNA analysis. Ph.D. dissertation, University <strong>of</strong> British<br />
Columbia, Vancouver, BC. 97 pp.<br />
BIRDSELL, J. B. 1966. Some predictions for <strong>the</strong> Pleistocene based on equilibrium systems<br />
among recent hunter-ga<strong>the</strong>rers. Pages 229–240 <strong>in</strong> R. B. Lee and I. DeVore, eds. Man<br />
<strong>the</strong> hunter. Ald<strong>in</strong>e, Chicago, IL.<br />
BIRKY, C. W., T. MARUYAMA AND P. FUERST. 1983. An approach to population and<br />
evolutionary <strong>genetic</strong> <strong>the</strong>ory for genes <strong>in</strong> mitochondria and chloroplasts, and some<br />
results. Genetics 103:513–527.<br />
BORAN, J. R., AND S. L. HEIMLICH. 1999. Social learn<strong>in</strong>g <strong>in</strong> cetaceans: Hunt<strong>in</strong>g, hear<strong>in</strong>g and<br />
hierarchies. Symposia <strong>of</strong> <strong>the</strong> Zoological Society, London 73:282–307.<br />
BOUGHMAN, J.W., AND G. S. WILKINSON. 1998. Greater spear-nosed bats discrim<strong>in</strong>ate<br />
group mates by vocalizations. Animal Behaviour 55:1717–1732.<br />
BOYD, R., AND P. RICHERSON. 1985. Culture and <strong>the</strong> evolutionary process. Chicago<br />
University Press, Chicago, IL.<br />
BULL, L., O. HOLLAND AND S. BLACKMORE. 2000. On meme-gene coevolution. Artificial Life<br />
6:227–235.<br />
CHARLESWORTH, B., M. T. MORGAN AND D. CHARLESWORTH. 1993. The effects <strong>of</strong> deleterious<br />
mutations on neutral molecular variation. Genetics 134:1289–1303.<br />
CHRISTAL, J., H. WHITEHEAD AND E. LETTEVALL. 1998. Sperm whale social units: Variation<br />
and change. Canadian Journal <strong>of</strong> Zoology 76:1431–1440.<br />
DEECKE, V. B., J. K. B. FORD AND P. SPONG. 2000. Dialect change <strong>in</strong> resident killer <strong>whales</strong>:<br />
Implications for vocal learn<strong>in</strong>g and <strong>cultural</strong> transmission. Animal Behaviour 40:<br />
629–638.<br />
FELDMAN, M.W., AND L. L. CAVALLI-SFORZA. 1984. Cultural and biological evolutionary<br />
processes: Gene-culture disequilibrium. Proceed<strong>in</strong>gs <strong>of</strong> <strong>the</strong> National Academy <strong>of</strong><br />
Sciences <strong>of</strong> <strong>the</strong> United States <strong>of</strong> America 81:1604–1607.
78 MARINE MAMMAL SCIENCE, VOL. 21, NO. 1, 2005<br />
FELDMAN, M.W.,AND K. N. LALAND. 1996. Gene-culture coevolutionary <strong>the</strong>ory. Trends <strong>in</strong><br />
Ecology and Evolution 11:453–457.<br />
FORD, J. K. B. 1991. Vocal traditions among resident killer <strong>whales</strong> (Orc<strong>in</strong>us orca) <strong>in</strong> coastal<br />
waters <strong>of</strong> British Columbia. Canadian Journal <strong>of</strong> Zoology 69:1454–1483.<br />
FORD, J. K. B., G. M. ELLIS AND K. C. BALCOMB. 2000. Killer <strong>whales</strong>. 2nd Edition. UBC<br />
Press, Vancouver, BC.<br />
GEORGIADIS, N., L. BISCHOF, A.TEMPLETON, J.PATTON, W.KARESH AND D. WESTERN. 1994.<br />
Structure and history <strong>of</strong> African elephant populations: I. eastern and sou<strong>the</strong>rn Africa.<br />
Journal <strong>of</strong> Heredity 85:100–104.<br />
HEIMLICH-BORAN, J. R. 1993. Social organization <strong>of</strong> <strong>the</strong> short-f<strong>in</strong>ned pilot whale<br />
Globicephala macrorhynchus, with special reference to <strong>the</strong> comparative social ecology <strong>of</strong><br />
delph<strong>in</strong>ids. Ph.D. dissertation. Cambridge University, Cambridge, U.K. 235 pp.<br />
HOELZEL, A. R., A. NATOLI, M.E.DAHLHEIM, C.OLAVARRIA, R.W.BAIRD AND N. A. BLACK.<br />
2002. Low worldwide <strong>genetic</strong> <strong>diversity</strong> <strong>in</strong> <strong>the</strong> killer whale (Orc<strong>in</strong>us orca): Implications<br />
for demographic history. Proceed<strong>in</strong>gs <strong>of</strong> <strong>the</strong> Royal Society <strong>of</strong> London, B 269:<br />
1467–1473.<br />
JANIK, V. M. 2001. Is social learn<strong>in</strong>g unique Behavioral and Bra<strong>in</strong> Sciences 24:337–338.<br />
LALAND, K. N. 1992. A <strong>the</strong>oretical <strong>in</strong>vestigation <strong>of</strong> <strong>the</strong> role <strong>of</strong> social transmission <strong>in</strong><br />
evolution. Ethology and Sociobiology 13:87–113.<br />
LALAND, K. N., J. ODLING-SMEE AND M. W. FELDMAN. 2000. Niche construction, biological<br />
evolution and <strong>cultural</strong> change. Behavioral and Bra<strong>in</strong> Sciences 23:131–175.<br />
LYRHOLM, T., O. LEIMAR AND U. GYLLENSTEN. 1996. Low <strong>diversity</strong> and biased substitution<br />
patterns <strong>in</strong> <strong>the</strong> mitochondrial DNA control region <strong>of</strong> sperm <strong>whales</strong>: Implications for<br />
estimates <strong>of</strong> time s<strong>in</strong>ce common ancestry. Molecular Biology and Evolution 13:1318–<br />
1326.<br />
LYRHOLM, T., O. LEIMAR, B.JOHANNESON AND U. GYLLENSTEN. 1999. Sex-biased dispersal <strong>in</strong><br />
sperm <strong>whales</strong>: Contrast<strong>in</strong>g mitochondrial and nuclear <strong>genetic</strong> structure <strong>of</strong> global<br />
populations. Proceed<strong>in</strong>gs <strong>of</strong> <strong>the</strong> Royal Society <strong>of</strong> London, B 266:347–354.<br />
MAYNARD SMITH, J., AND J. HAIGH. 1974. The hitch-hik<strong>in</strong>g effect <strong>of</strong> a favourable gene.<br />
Genetics Research 23:23–35.<br />
MCCOMB, K., C. MOSS, S.M.DURANT, L.BAKER AND S. SAYIALEL. 2001. Matriarchs as<br />
repositories <strong>of</strong> social knowledge <strong>in</strong> African elephants. Science 292:491–494.<br />
MESNICK, S. L., B. L. TAYLOR, R.G.LE DUC, S.E.TREVIÑO, G. M. O’CORRY-CROWE AND<br />
A. E. DIZON. 1999. Culture and <strong>genetic</strong> evolution <strong>in</strong> <strong>whales</strong>. Science 284:2055a.<br />
MOSS, C. J., AND J. H. POOLE. 1983. Relationships and social structure <strong>in</strong> African elephants.<br />
Pages 315–325 <strong>in</strong> R. A. H<strong>in</strong>de, ed. Primate social relationships: An <strong>in</strong>tegrated<br />
approach. Blackwell, Oxford, UK.<br />
OTTENSMEYER, C. A., AND H. WHITEHEAD. 2003. Behavioural evidence for social units <strong>in</strong><br />
long-f<strong>in</strong>ned pilot <strong>whales</strong>. Canadian Journal <strong>of</strong> Zoology 81:1327–1338.<br />
PALSBØLL, P. J., M. P. HEIDE-JØRGENSEN AND R. DIETZ. 1997. Population structure and<br />
seasonal movements <strong>of</strong> narwhals, Monodon monoceros, determ<strong>in</strong>ed from mtDNA analysis.<br />
Heredity 78:284–292.<br />
RENDELL, L., AND H. WHITEHEAD. 2001. Cetacean culture: Still afloat after <strong>the</strong> first naval<br />
engagement <strong>of</strong> <strong>the</strong> culture wars. Behavioral and Bra<strong>in</strong> Sciences 24:360–373.<br />
RENDELL, L., AND H. WHITEHEAD. 2003. Vocal clans <strong>in</strong> sperm <strong>whales</strong> (Physeter macrocephalus).<br />
Proceed<strong>in</strong>gs <strong>of</strong> <strong>the</strong> Royal Society <strong>of</strong> London, B 270:225–231.<br />
SCHLÖTTERER, C. 1999. Culture and <strong>genetic</strong> evolution <strong>in</strong> <strong>whales</strong>. Science 284:2055a.<br />
SIEMANN, L. A. 1994. Mitochondrial DNA sequence variation <strong>in</strong> North Atlantic long-f<strong>in</strong>ned<br />
pilot <strong>whales</strong>, Globicephala melas. Ph.D. dissertation. Massachusetts Institute <strong>of</strong><br />
Technology, Cambridge, MA. 164 pp.<br />
TIEDEMANN, R., AND M. MILINKOVITCH. 1999. Culture and <strong>genetic</strong> evolution <strong>in</strong> <strong>whales</strong>.<br />
Science 284:2055a.<br />
WHITEHEAD, H. 1998. Cultural selection and <strong>genetic</strong> <strong>diversity</strong> <strong>in</strong> matril<strong>in</strong>eal <strong>whales</strong>. Science<br />
282:1708–1711.
WHITEHEAD: CULTURAL EVOLUTION<br />
79<br />
WHITEHEAD, H. 1999a. Culture and <strong>genetic</strong> evolution <strong>in</strong> <strong>whales</strong>. Science 284:2055a.<br />
WHITEHEAD, H. 1999b. Variation <strong>in</strong> <strong>the</strong> visually observable behavior <strong>of</strong> groups <strong>of</strong> Galápagos<br />
sperm <strong>whales</strong>. Mar<strong>in</strong>e Mammal Science 15:1181–1197.<br />
WHITEHEAD, H. 2003a. Society and culture <strong>in</strong> <strong>the</strong> deep and open ocean: The sperm whale.<br />
Pages 444– 464 <strong>in</strong> F. B. M. de Waal and P. L. Tyack, eds. Animal social complexity:<br />
Intelligence, culture and <strong>in</strong>dividualized societies. Harvard University Press, Cambridge,<br />
MA.<br />
WHITEHEAD, H. 2003b. Sperm <strong>whales</strong>: Social evolution <strong>in</strong> <strong>the</strong> ocean. University <strong>of</strong> Chicago<br />
Press, Chicago, IL.<br />
WHITEHEAD, H., AND L. RENDELL. 2004. Movements, habitat use and feed<strong>in</strong>g success <strong>of</strong><br />
<strong>cultural</strong> clans <strong>of</strong> South Pacific sperm <strong>whales</strong>. Journal <strong>of</strong> Animal Ecology 73:190–196.<br />
WHITEHEAD, H., AND L. WEILGART. 2000. The sperm whale: Social females and rov<strong>in</strong>g<br />
males. Pages 154–172 <strong>in</strong> J. Mann, R. C. Connor, P. Tyack and H. Whitehead, eds.<br />
Cetacean societies. University <strong>of</strong> Chicago Press, Chicago, IL.<br />
WHITEHEAD, H., P. J. RICHERSON AND R. BOYD. 2002. Cultural selection and <strong>genetic</strong><br />
<strong>diversity</strong> <strong>in</strong> humans. Selection 3:115–125.<br />
WHITLOCK, M. C., AND N. H. BARTON. 1997. The effective size <strong>of</strong> a subdivided population.<br />
Genetics 146:427–441.<br />
YURK, H. 2003. Do killer <strong>whales</strong> have culture Pages 465–467 <strong>in</strong> F. B. M. de Waal and P. L.<br />
Tyack, eds. Animal social complexity: Intelligence, culture, and <strong>in</strong>dividualized<br />
societies. Harvard University Press, Cambridge, MA.<br />
Received: 5 February 2003<br />
Accepted: 16 July 2004