Article-PDF - Academy of Knowledge Process - Webs
Article-PDF - Academy of Knowledge Process - Webs
Article-PDF - Academy of Knowledge Process - Webs

Create successful ePaper yourself
Turn your PDF publications into a flip-book with our unique Google optimized e-Paper software.
International Journal <strong>of</strong> Contemporary Business Studies<br />
Vol: 4, No: 6 JUNE, 2013 ISSN 2156-7506<br />
Available online at http://w w w.akpinsight.webs.com<br />
(Constant),<br />
.362<br />
tfp_y<br />
a 0.131 0.131 2.0071<br />
a. Dependent Variable: g_m<br />
where y = ouput, l_p = per worker productivity <strong>of</strong> labor, k_p =capital productivity, ph_p = per hour<br />
productivity <strong>of</strong> labor, lk_p = labor & capital productivity, tfp_tr = total factor productivity based on total<br />
revenue and tfp_y = total factor productivity based on output.<br />
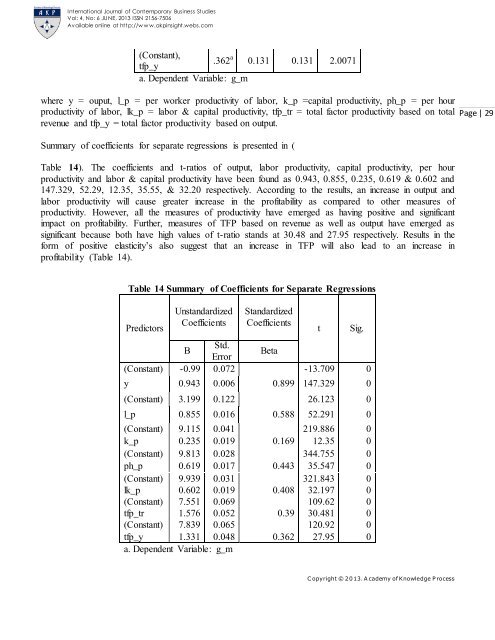
Summary <strong>of</strong> coefficients for separate regressions is presented in (<br />
Table 14). The coefficients and t-ratios <strong>of</strong> output, labor productivity, capital productivity, per hour<br />
productivity and labor & capital productivity have been found as 0.943, 0.855, 0.235, 0.619 & 0.602 and<br />
147.329, 52.29, 12.35, 35.55, & 32.20 respectively. According to the results, an increase in output and<br />
labor productivity will cause greater increase in the pr<strong>of</strong>itability as compared to other measures <strong>of</strong><br />
productivity. However, all the measures <strong>of</strong> productivity have emerged as having positive and significant<br />
impact on pr<strong>of</strong>itability. Further, measures <strong>of</strong> TFP based on revenue as well as output have emerged as<br />
significant because both have high values <strong>of</strong> t-ratio stands at 30.48 and 27.95 respectively. Results in the<br />
form <strong>of</strong> positive elasticity’s also suggest that an increase in TFP will also lead to an increase in<br />
pr<strong>of</strong>itability (Table 14).<br />
Page | 29<br />
Table 14 Summary <strong>of</strong> Coefficients for Separate Regressions<br />
Predictors<br />
Unstandardized<br />
Coefficients<br />
Standardized<br />
Coefficients<br />
t<br />
Sig.<br />
Std.<br />
B<br />
Beta<br />
Error<br />
(Constant) -0.99 0.072 -13.709 0<br />
y 0.943 0.006 0.899 147.329 0<br />
(Constant) 3.199 0.122 26.123 0<br />
l_p 0.855 0.016 0.588 52.291 0<br />
(Constant) 9.115 0.041 219.886 0<br />
k_p 0.235 0.019 0.169 12.35 0<br />
(Constant) 9.813 0.028 344.755 0<br />
ph_p 0.619 0.017 0.443 35.547 0<br />
(Constant) 9.939 0.031 321.843 0<br />
lk_p 0.602 0.019 0.408 32.197 0<br />
(Constant) 7.551 0.069 109.62 0<br />
tfp_tr 1.576 0.052 0.39 30.481 0<br />
(Constant) 7.839 0.065 120.92 0<br />
tfp_y 1.331 0.048 0.362 27.95 0<br />
a. Dependent Variable: g_m<br />
C opyright © 2 0 13. A cademy <strong>of</strong> <strong>Knowledge</strong> P rocess