BENCHMARKING: - Imperial Logistics
BENCHMARKING: - Imperial Logistics
BENCHMARKING: - Imperial Logistics

Create successful ePaper yourself
Turn your PDF publications into a flip-book with our unique Google optimized e-Paper software.
GROWTH FOCUS TALENT VALUE DECISION<br />
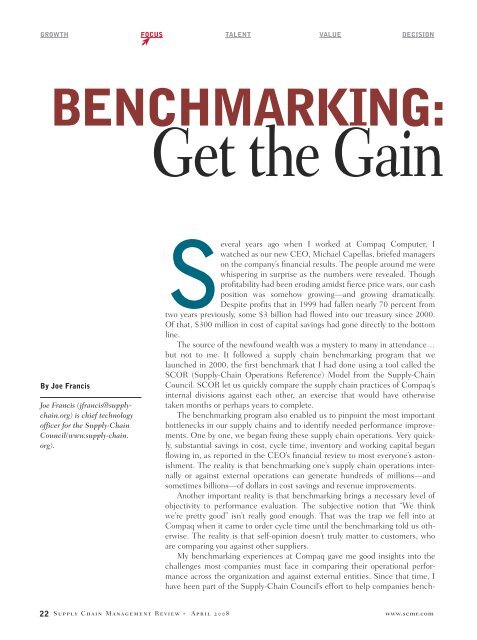
<strong>BENCHMARKING</strong>:<br />
Get the Gain<br />
By Joe Francis<br />
Joe Francis (jfrancis@supplychain.org)<br />
is chief technology<br />
officer for the Supply-Chain<br />
Council(www.supply-chain.<br />
org).<br />
Several years ago when I worked at Compaq Computer, I<br />
watched as our new CEO, Michael Capellas, briefed managers<br />
on the company’s financial results. The people around me were<br />
whispering in surprise as the numbers were revealed. Though<br />
profitability had been eroding amidst fierce price wars, our cash<br />
position was somehow growing—and growing dramatically.<br />
Despite profits that in 1999 had fallen nearly 70 percent from<br />
two years previously, some $3 billion had flowed into our treasury since 2000.<br />
Of that, $300 million in cost of capital savings had gone directly to the bottom<br />
line.<br />
The source of the newfound wealth was a mystery to many in attendance…<br />
but not to me. It followed a supply chain benchmarking program that we<br />
launched in 2000, the first benchmark that I had done using a tool called the<br />
SCOR (Supply-Chain Operations Reference) Model from the Supply-Chain<br />
Council. SCOR let us quickly compare the supply chain practices of Compaq’s<br />
internal divisions against each other, an exercise that would have otherwise<br />
taken months or perhaps years to complete.<br />
The benchmarking program also enabled us to pinpoint the most important<br />
bottlenecks in our supply chains and to identify needed performance improvements.<br />
One by one, we began fixing these supply chain operations. Very quickly,<br />
substantial savings in cost, cycle time, inventory and working capital began<br />
flowing in, as reported in the CEO’s financial review to most everyone’s astonishment.<br />
The reality is that benchmarking one’s supply chain operations internally<br />
or against external operations can generate hundreds of millions—and<br />
sometimes billions—of dollars in cost savings and revenue improvements.<br />
Another important reality is that benchmarking brings a necessary level of<br />
objectivity to performance evaluation. The subjective notion that “We think<br />
we’re pretty good” isn’t really good enough. That was the trap we fell into at<br />
Compaq when it came to order cycle time until the benchmarking told us otherwise.<br />
The reality is that self-opinion doesn’t truly matter to customers, who<br />
are comparing you against other suppliers.<br />
My benchmarking experiences at Compaq gave me good insights into the<br />
challenges most companies must face in comparing their operational performance<br />
across the organization and against external entities. Since that time, I<br />
have been part of the Supply-Chain Council’s effort to help companies bench-<br />
22 Supply Chain Management Review · April 2008 www.scmr.com
Without the Pain<br />
Benchmarking your supply chain performance can be a costly and<br />
time-consuming exercise. And as often as not, it doesn’t really<br />
produce the results you hoped for. It doesn’t have to be this way. A<br />
new benchmarking approach from the Supply-Chain Council called<br />
SCORmark takes out the noise surrounding benchmarking projects and<br />
focuses your improvement efforts on where they’re needed most.<br />
www.scmr.com Supply Chain Management Review · April 2008 23
Benchmarking<br />
mark their supply chains internally and externally. With<br />
our partner APQC (www.apqc.org), one of the world’s<br />
premier benchmarking and best practices organizations,<br />
we launched our benchmarking program, called<br />
SCORmark, in 2007.<br />
This article describes the evolution and core components<br />
of that benchmarking initiative. It outlines the<br />
recurring challenges managers face in attempting to<br />
benchmark their supply chain operations and explains<br />
how the SCORmark approach addresses those challenges.<br />
Finally, we describe some real-world experiences of<br />
the benchmark’s users.<br />
Some Basics of Benchmarking<br />
Before going further, it might be helpful to provide some<br />
basic definitions and describe my earlier benchmarking<br />
experiences at Compaq to put things in context.<br />
There are two main types of benchmarking: qualitative<br />
and quantitative. They both share certain essential<br />
features, but have quite different purposes and outcomes.<br />
In qualitative benchmarking, often called “best<br />
practices” or “leading practices,” managers gather data<br />
Quantitative benchmarking involves<br />
examining a given supply chain and<br />
gathering data on performance, not practices.<br />
on techniques for solving supply chain problems and<br />
improving performance. If you were having issues with<br />
supplier forecasting, for example, you might look at your<br />
capabilities with regard to demand planning, S&OP,<br />
and CPFR. These techniques are generally applicable,<br />
provide valuable results, and have good staying power.<br />
Managers compare their techniques to those of organizations<br />
with similar supply chains. They then analyze the<br />
differences, looking for opportunities to improve certain<br />
processes. When you say “benchmarking,” many companies<br />
think only of this type of qualitative benchmarking.<br />
Basically, this was the type of supply chain benchmarking<br />
program we conducted at Compaq.<br />
The second type is the quantitative benchmarking<br />
of key performance indicators (KPIs), business metrics,<br />
and scorecards. This activity involves examining a<br />
given supply chain and gathering data on performance,<br />
not practices. Managers then compare this performance<br />
data to those of organizations with similar supply chains.<br />
The goal is to identify any performance differences and<br />
note which processes need to be improved and by how<br />
much (that is, what new standards need to be attained).<br />
Companies often conduct this type of quantitative<br />
benchmarking while doing a financial review of company<br />
performance. They also frequently use quantitative<br />
benchmarking to tie the company’s supply chain goals to<br />
its overall strategy.<br />
Our benchmarking efforts at Compaq were mainly<br />
of the qualitative variety. We had a relatively easy time<br />
launching the program as the head of supply chain strategy<br />
was the sponsor. He had the authority in the management<br />
hierarchy to compel the participation of supply<br />
chain managers throughout the company. We also had<br />
urgency around the program because of loss of market<br />
share. It was clear we didn’t have a robust strategy linking<br />
top-line performance and supply chain tactics in a<br />
changing computer market that saw Dell and HP in particular<br />
achieving rapid growth. The qualitative analysis<br />
confirmed that we definitely didn’t have a detailed linkage<br />
between strategy and operations in the field.<br />
In retrospect, however, I realize that it wasn’t a perfect<br />
program. We were unsure of which areas to benchmark,<br />
so we covered all possible supply chain processes<br />
and metrics companywide. This turned<br />
out to be a complex undertaking, and<br />
ultimately we covered a lot of areas<br />
needlessly. The program took us the better<br />
part of four months and cost about<br />
$350,000 in fees with our Big Five<br />
consulting partner. The results we did<br />
achieve were highly dependent on the<br />
consulting firm’s organization of the approach, analysis,<br />
and communication of the outcome. Yet all of this<br />
“walked out the door” after the consultants issued their<br />
final report.<br />
We were satisfied with the results, but I was dissatisfied<br />
with the process. We had a wide but fairly shallow<br />
(internal) benchmark that gave us valuable direction. Yet<br />
we found it difficult to prioritize and focus the program<br />
because it was so large and covered so many different<br />
supply chains. Moreover, we didn’t get any real detail on<br />
what activities needed improvement and by how much.<br />
In the end, we decided to focus on order cycle time<br />
(and inventory) in three of Compaq’s seven major supply<br />
chains. Order cycle time then stood at 27 days average,<br />
and we had months of inventory. We had very low<br />
maturity practices to manage order cycle time. Yet we<br />
found that by correcting some of the deficiencies in how<br />
we managed processes, we could reach a five-day average<br />
order cycle time with at least two weeks less inventory.<br />
This focus would end up saving weeks of cash cycle<br />
time, which resulted in the billions of dollars of working<br />
24 Supply Chain Management Review · April 2008 www.scmr.com
capital savings. Each day of working capital was worth<br />
a few hundred million dollars. Twenty days of improvement<br />
later we hit the $3 billion mark in capital, and<br />
$100+ million in profit improvement—my first billiondollar<br />
SCOR project!<br />
Several years later, after the merger of Compaq and<br />
Hewlett-Packard, we undertook another benchmarking<br />
program to look at internal costs in one division. At the<br />
outset, it seemed simpler than the broad Compaq study.<br />
Since it was quantitative rather than qualitative, we<br />
didn’t have to juggle huge masses of best-practice data.<br />
In addition, the project focused on one specific metric<br />
rather than trying to aggregate and align process, metrics,<br />
and practices. Among the other plus factors: we had<br />
a relatively easy time with the benchmarking launch; C-<br />
level sponsorship; the appropriate authority in the management<br />
hierarchy (as head of business process management,<br />
I worked with his head of strategy to execute the<br />
program); and the post-merger urgency to reduce costs<br />
significantly.<br />
Despite these favorable conditions, this<br />
turned out to be the most painful benchmarking<br />
I’ve ever been through. Instead of using<br />
industry standard metrics that showed how we<br />
compared against our competitors, we ended<br />
up with highly customized metrics and views<br />
on the data. We worked again with a Big Five<br />
consulting firm (different from the first one)<br />
that did the custom research on competing<br />
companies, burned through about $400,000 in<br />
fees, and spent months gathering data and performing<br />
analysis. In this case, we had a narrow but deep benchmark<br />
(internal and external) that gave us good direction.<br />
However, lack of standards for comparing the performance<br />
data created a lot of extra work. And once again,<br />
we did not develop any in-house competency as the consultants<br />
did all the organization, research, analysis and<br />
communication of the benchmark results.<br />
The Challenges of Benchmarking<br />
Through experiences with these and subsequent programs,<br />
I’ve identified some recurring challenges with<br />
regard to instituting an effective benchmarking initiative.<br />
These include:<br />
• Sponsorship—every benchmarking initiative needs<br />
a sponsor, the higher in the organization the better.<br />
• Scope—selecting the supply chains to be benchmarked<br />
is critical; it’s not a simple process.<br />
• Selection of processes and metrics—focusing<br />
on strategic elements helps keep the program targeted<br />
and useful (deep metrics in a few areas rather than<br />
many metrics across numerous areas).<br />
• Standards—standard definitions of supply chain<br />
processes (e.g., what activities are in manufacturing or<br />
procurement) enable “like-for-like” benchmarks across<br />
divisions or companies. Conversely, lack of standards<br />
make meaningful comparisons difficult if not impossible.<br />
• Sources—identifying sources of data for metrics<br />
and having clear pointers to which processes generate<br />
transactional data necessary for calculations.<br />
• Cost—benchmarking can be expensive, especially<br />
when outside consultants are used. It’s not uncommon<br />
for the cost of a single benchmark to range between<br />
$300,000 and $500,000.<br />
• Time—the benchmarking process can take from<br />
three to five months; set expectations accordingly.<br />
• Deriving meaning—the benchmarking initiative<br />
must be structured so that the results produced are<br />
meaningful.<br />
So how do supply chain managers address these<br />
challenges and conduct benchmarking that is<br />
truly effective In the last five years, Supply-<br />
Chain Council members have asked us to<br />
build a metrics repository based on SCOR<br />
for benchmarking purposes—that is, a scorecard<br />
that would let them compare their performance<br />
against industry peers and companies<br />
outside their industry. Many members in<br />
particular wanted to be able to periodically<br />
check on a couple of key metrics to see if<br />
their performance was in order.<br />
The Supply-Chain Council had to carefully consider<br />
how it would respond to this member need, recognizing<br />
that compiling the data necessary for even a casual<br />
check-up could be a daunting task. In 2005, we began<br />
negotiation with APQC to build a SCOR benchmarking<br />
resource for our members. In 2006, IBM sponsored the<br />
development of the SCC/APQC benchmarking system,<br />
which has the trademarked name of SCORmark. The<br />
approach we took recognized the value of process reference<br />
models such as SCOR, coupled with the value of<br />
having access to benchmarking data.<br />
We began the SCORmark development process by<br />
asking what were the realistic expectations of a quantitative<br />
benchmarking exercise and how could we reach<br />
those expectations. We quickly agreed that more than a<br />
database of metrics information was required. Rather,<br />
we needed a system for performing benchmarking that,<br />
to the best of our ability, would resolve the key issues in<br />
the benchmarking process. There were some challenges<br />
we could not address directly—C-level sponsorship of a<br />
benchmarking program, for instance. But we decided we<br />
www.scmr.com Supply Chain Management Review · April 2008 25
Benchmarking<br />
could address most of the other issues.<br />
First, on the challenge of scope and focus. SCOR<br />
provides an elegant and effective three-step process for<br />
(1) identifying all the supply chains in a given business,<br />
(2) prioritizing them according to business impact, and<br />
(3) linking them to business strategy. The “supply chain”<br />
identification matrix greatly simplifies all of the discussions<br />
about “what” supply chains are present. Generated<br />
from sales and marketing segment data, and from product<br />
and supplier segment data, the matrix quickly gives<br />
a commonsense stratification of supply chains for further<br />
examination. Exhibit 1 shows such an identification<br />
matrix for the fictitious ComfyCo Air Conditioning<br />
Company. In this case, ComfyCo identified three supply<br />
chains: Big Air, Small Air, and Commercial.<br />
The supply chain “priority matrix” simply ranks the<br />
identified supply chains according to company performance<br />
criteria (see Exhibit 2). Then the supply chain<br />
“strategy matrix” links the prioritized supply chains to<br />
top-level company strategy<br />
(Exhibit 3), according<br />
to whether each should<br />
be superior (S), give you<br />
an advantage (A), or be<br />
at parity (P) competitively.<br />
This is a simple 1-<br />
2-3 approach to identifying<br />
what to benchmark,<br />
instead of spending weeks<br />
of agonizing discussion.<br />
Continuing on the<br />
issue of scope, SCORmark<br />
adopted the NAICS<br />
(North American Industry<br />
EXHIBIT 1<br />
Supply Chain Identification Matrix for ComfyCo Air Conditioning Co.<br />
Supply-Chain<br />
Identification<br />
Matrix<br />
Big AirCo<br />
Small AirCo<br />
Custom Industrial<br />
Standard Industrial<br />
Big Box<br />
Retailer<br />
X<br />
Geography-Customer or Market Channel<br />
Retail<br />
Internet<br />
Direct<br />
X<br />
X<br />
“Commercial” SC<br />
Supply<br />
Chain<br />
Big Air<br />
Small Air<br />
Comm’l<br />
Overall<br />
Rating<br />
120<br />
180<br />
300<br />
Commercial<br />
Building<br />
X<br />
X<br />
X<br />
Commercial<br />
“Small Air” SC<br />
Criteria<br />
Weight<br />
Commercial<br />
Major Acct<br />
“Big Air” SC<br />
X<br />
Classification System) coding system. (NAICS replaces<br />
the old SIC classifications.) We added in SCOR’s standard<br />
supply chain types—Make-to-Order, Make-to-<br />
Stock, or Engineer-to-Order. Thus, for any company,<br />
even complex conglomerates, once managers identify a<br />
piece of their supply chain that they want to benchmark,<br />
they can unambiguously compare it to similar supply<br />
chain types in a given region and industry.<br />
NAICS has more than 1,175 distinct industry codes,<br />
which provides a rich set of types to identify almost any<br />
possible supply chain industry segment. For instance,<br />
a supply chain may be defined as Chemical Industry,<br />
European, Build-to-Order. It could be defined as High-<br />
Tech Manufacturing, Asia-Pacific, Engineer-to-Order. If<br />
you’re a toy manufacturer, soybean grower, or IT service<br />
provider, there’s a category for you to<br />
use. There are also segments for different<br />
sizes of supply chains based on revenue;<br />
so you can compare small-to-small<br />
and small-to-extra large if that’s your<br />
wish. The categories, geographies, and<br />
supply chain types were “menuized” to<br />
simplify the benchmarker’s task of identifying<br />
both internal and external supply<br />
chains for comparison.<br />
The next challenge addressed was<br />
selection of metrics. This has long<br />
been a subject of intense discussion at<br />
Supply Chain Council training sessions<br />
on the SCOR model. SCOR has several<br />
hundred supply chain metrics organized<br />
by purpose (level) and categories. A purpose<br />
could be creating and measuring strategy (Level 1),<br />
diagnosing process defects (Level 2), or measuring workflow<br />
performance (Level 3). All metrics fall into one of<br />
five categories based on the metric’s strategic impact.<br />
EXHIBIT 2<br />
Supply Chain Priority Matrix for ComfyCo<br />
Weighted<br />
Result<br />
Ranking<br />
Revenue<br />
& Rank<br />
1<br />
20<br />
Gross Margin<br />
& Rank<br />
20<br />
Number of<br />
SKUs & Rank<br />
20<br />
Unit Volume<br />
& Rank<br />
20 2 20 1 20 1 20 1 20<br />
2 40 1 40 2 40 2 40 2 40<br />
3 60 3 60 3 60 3 60 3 60<br />
20<br />
Strategic<br />
Value & Rank<br />
20<br />
26 Supply Chain Management Review · April 2008 www.scmr.com
Reliability<br />
Responsiveness<br />
Flexibility<br />
Cost<br />
Asset Management<br />
EXHIBIT 3<br />
Supply Chain Strategy Matrix for<br />
ComfyCo Air Conditioning Company<br />
Performance<br />
Attribute or Category<br />
Competitive Requirements<br />
Big Small<br />
Comm’l<br />
Airco Airco<br />
S<br />
A<br />
S<br />
A<br />
A<br />
P<br />
P<br />
S = Superior A = Advantage P = Parity<br />
These categories are reliability, responsiveness, agility,<br />
cost, and assets. Order Cycle Time, for example, is a<br />
responsiveness category metric. Cash Cycle Time is an<br />
asset-type metric, and so on.<br />
To understand the breakout, consider Cash Cycle<br />
Time (Level 1-strategic). This metric is composed of<br />
Days Sales Outstanding, Days of Inventory, and Days<br />
Payables Outstanding (Level 2-strategy diagnostic).<br />
Total Supply Chain Management Cost (Level 1-strategic)<br />
is composed of constituent non-COGS process<br />
costs—Plan, Source, Deliver, Return (Level 2 -strategy<br />
diagnostic), which in turn are composed of costs of each<br />
component process (level 3-process diagnostic).<br />
To do a supply chain benchmark with SCORmark,<br />
the user needs to select at least one Level-1 strategic<br />
metric for each of the five major categories. Further,<br />
he or she must prioritize the company’s strategy in each<br />
of those five categories according to whether the supply<br />
chain must achieve superiority, advantage, or parity.<br />
One (and only one) superior rating is allowed for analyzing<br />
a benchmark, two advantage, and two parity ratings.<br />
For the superior category, we would expect managers to<br />
select component metrics at Level 2 – strategy diagnostics<br />
and some at Level 3 – process diagnostics. For the<br />
advantage category, we would expect them to add some<br />
component metrics at level 2 – strategy diagnostics. This<br />
would build out a benchmark or “SCORcard” of 24 metrics:<br />
5 (Level 1 metrics) + 3 (Level 2 superior metrics)<br />
+ 10 (Level 3 superior metrics) + 6 (Level 2 advantage<br />
metrics). That number is not too big, not too small. Most<br />
important, it is sharply focused on company strategy.<br />
(See Exhibit 4 for sample metrics selection)<br />
This process is really not as complicated as it may<br />
sound. When supply chain managers have a menu of<br />
metrics organized by category in front of them, metrics<br />
A<br />
P<br />
S<br />
P<br />
A<br />
A<br />
P<br />
P<br />
selection becomes almost cut and dried. Selecting Level<br />
1, and then inheriting Level 2 (and Level 3) metrics is<br />
a clear and logical process. It is a deceptively simple<br />
system because SCOR already has cause-effect data on<br />
all strategic, strategy-diagnostic, and process-diagnostic<br />
metrics. Rolf Poluha wrote an excellent book 1 that actually<br />
articulates the statistical significance (that is, causeeffect<br />
relationships and correlations between metrics) for<br />
all SCOR metrics. The book provides a fantastic amount<br />
of detail for sticklers.<br />
Compare this straightforward process to the seemingly<br />
endless benchmarking debates around:<br />
• Metric definitions (what should “complete order”<br />
really mean).<br />
• Which metrics are valuable to our company (a<br />
guessing game)<br />
• How should we decompose the metrics once we’ve<br />
defined them.<br />
I’ve been through these debates, and they are neither<br />
pretty nor short. At Compaq in the mid-1990s, when we<br />
were standardizing the definition of order cycle time, ontime<br />
delivery, inventory days and related metrics, it took<br />
almost a year to achieve a global consensus on how to<br />
measure and manage the data.<br />
Responding to the standards challenge, SCOR<br />
developers have created or adopted the most widely<br />
accepted definitions of supply chain metrics in use<br />
among around 2,500 companies worldwide over the<br />
last 11 years. This greatly facilitates data gathering. For<br />
instance, order cycle time is defined as beginning with<br />
receipt of a customer order and ending with the customer<br />
acceptance of the service or material. There is no<br />
debate about interpretation. Managers do not need to<br />
undertake (or have consultants undertake) custom programs<br />
to create like-for-like comparisons. The SCOR<br />
metrics already do that. More significantly, managers do<br />
not have to embark on customized programs to gather<br />
and reclassify external data—that is, figure out how to<br />
Level 1: Supply Chain<br />
Responsiveness Attribute<br />
EXHIBIT 4<br />
Sample Level 1, 2, and 3 Metrics Selection<br />
Level 2: Strategy Diagnostic<br />
Level 3: Process Diagnostic<br />
Order Fulfillment Cycle Time<br />
Delivery Cycle Time<br />
Cycle Time to Reserve<br />
Resources and Determine<br />
Delivery Date<br />
www.scmr.com Supply Chain Management Review · April 2008 27
Benchmarking<br />
compare their operations to those of other companies.<br />
Another important advantage is that SCOR provides<br />
guidance for data gathering. All the SCOR strategic,<br />
strategy-diagnostic, and process-diagnostic metrics provide<br />
a specific list of process sources for the raw data<br />
necessary for calculations. With this guidance, companies<br />
can readily identify process owners who govern<br />
access to IT systems that may hold transactional data.<br />
This provides rough back-of-the-envelope planning for<br />
data gathering and quality control of the measurements,<br />
thereby speeding up the onerous data-gathering phase of<br />
the benchmark.<br />
On the challenge of reducing the cost of benchmarking,<br />
council members and other interested parties<br />
can easily learn how to use the SCOR methodology and<br />
SCORmark workflow. (For more information on this, see<br />
accompanying sidebar.) A consultant may be valuable<br />
in providing the manpower to gather the data and manage<br />
a big benchmarking program. But managers do not<br />
need any expertise in the fundamentals of benchmarking—selecting<br />
and defining the metrics, the methodology,<br />
and how to analyze the data—outside of the SCOR<br />
framework itself. Once a company has standardized on<br />
SCOR and trained managers on how to use the model,<br />
they can easily execute the benchmarking and interpret<br />
the results. No key information “walks out the door” at<br />
the program’s conclusion.<br />
The SCORmark approach saves time and money.<br />
Users avoid the cost of customized benchmarking<br />
because the system is based on open standards shared<br />
among the SCOR community via the SCORmark system.<br />
In effect, access to the standards is part of the<br />
cost of membership to the Supply-Chain Council. In<br />
addition, SCORmark cuts the time required to conduct<br />
a benchmark (assuming that your company manages<br />
supply chains with standard metrics) to a fraction of the<br />
usual three to four months. In fact, we’ve seen high-quality<br />
benchmarks completed in as short a time as one day,<br />
though the norm is typically two to three weeks. APQC<br />
will need time to perform<br />
statistical validation<br />
(“quality checks”) of the<br />
benchmark data, which<br />
can take up to one week.<br />
Once your company is<br />
known to provide quality<br />
data, the statistical<br />
validation can be done<br />
within days.<br />
Consider the implications<br />
of this capability.<br />
Gaining Access to<br />
SCORmark<br />
The SCORmark benchmarking tool itself is available<br />
only to members of the Supply-Chain Council (SCC).<br />
The cost to join the SCC is $3,000 for a company in one<br />
region, for example the United States; $5,000 for companies<br />
in multiple regions; and $600 for academics. There<br />
are no restrictions on the number of individuals within a<br />
company who can log into the tool.<br />
Non-members can view the 2007 benchmark results,<br />
but again must be members to participate.<br />
The Supply-Chain Council plans to introduce a half-day<br />
benchmarking tutorial in 2008 to be presented around the<br />
country. The session will be open to members and nonmembers<br />
alike.<br />
For more information, visit www.supply-chain.org.<br />
Instead of spending one or two quarters benchmarking<br />
and goal setting with lagging data, a company can benchmark<br />
monthly, and identify leading trends and set forward-looking<br />
goals on a continuous basis. There are no<br />
substantial additional costs in using monthly KPI data<br />
(SCOR data), and benchmarking against that data over<br />
and over.<br />
Finally, with respect to deriving meaning from<br />
the benchmark results, we start with the fact that<br />
SCORmark is designed around the SCOR methodology.<br />
So once managers select their appropriate metrics and<br />
identify their company strategy, the benchmark not only<br />
places their company relative (by metric) to their industry<br />
or selected demographic, but also identifies the targeted<br />
improvements needed (see Exhibit 5). The analysis<br />
of this benchmark performance gap ties directly into the<br />
subsequent phases of SCOR—material flow, work and,<br />
information flow—for identifying the root causes of performance<br />
problems. It also tells you what projects you’re<br />
going to need to execute to address the problem areas.<br />
EXHIBIT 5<br />
Sample Summary Benchmark Result<br />
Attribute S/A/P Metric (Level 1) You Parity Adv Superior Target Gap<br />
Reliability S Perfect Order Fulfillment 97% 92% 95% 98% 1%<br />
Responsiveness A Order Fulfillment Cycle Time 14 Days 8 Days 6 Days 4 Days 8 Days<br />
Flexibility P Ups. Supply Chain Flexibility 62 Days 80 Days 60 Days 40 Days 0<br />
Cost P Supply Chain Management Cost 12.2% 10.8% 10.4% 10.2% 1.4%<br />
Assets A Cash-To-Cash Cycle Time 35 Days 45 Days 33 Days 20 Days 2 Days<br />
28 Supply Chain Management Review · April 2008 www.scmr.com
Early Experiences with the Benchmark<br />
What are the lessons learned from development of the<br />
new SCORmark program First, many companies have<br />
serious difficulty defining their supply chain for the purposes<br />
of benchmarking. Many believe they have “a” supply<br />
chain (or three or four or five…) when in fact they<br />
have a large constellation of supply chains. Using the<br />
SCOR supply chain definition matrix technique, companies<br />
can easily identify all of their supply chains by major<br />
project line/customer segment. They<br />
can then choose groupings of these to<br />
benchmark based on shared characteristics.<br />
I see this as becoming more<br />
deeply embedded in the benchmarking<br />
workflow because we designed the<br />
SCORmark system with the assumption<br />
that companies already did something<br />
roughly equivalent to identify supply<br />
chains.<br />
Second, there is a huge variation in how much detail<br />
companies manage in their supply chain data. This<br />
became clear when we saw how long it took various<br />
companies to beta-test the benchmarking system. Here’s<br />
a sampling of how long it took companies to gather and<br />
submit the necessary data for the benchmark tool:<br />
• Company A: 6 hours<br />
• Company B: 2 days<br />
• Company C: 10 days<br />
• Company D: 6 weeks<br />
• Company E: Abandoned the survey because it was<br />
too difficult to get the data.<br />
Now, these companies are in different industries<br />
with different levels of supply chain maturity. However,<br />
Company A had used SCOR for years, had standardized<br />
its operations around the model, and was able to easily<br />
pull its standard performance data for benchmarking.<br />
Company B also had used SCOR for years. The company<br />
had not standardized operations on SCOR metrics,<br />
but it did have metrics data that it used in SCOR<br />
programs. Company C had good operational metrics,<br />
but those metrics were not standardized. Company D<br />
had some operational metrics, not standardized. Finally,<br />
Company E simply had serious difficulty compiling any<br />
metrics. (We also suspect it had trouble in defining its<br />
supply chains for the purpose of benchmarking.)<br />
Among the first 30-40 companies using SCORmark,<br />
we also saw similar variations in time-to-complete the<br />
exercise, with a skew towards taking several weeks to<br />
complete. Half our beta testers were relatively sophisticated<br />
SCOR users. Those users that had standardized<br />
on SCOR could quickly complete benchmark surveys<br />
and get frequent updates. That is the ideal situation.<br />
The biggest hurdle to benchmarking<br />
is coming up with standard ways<br />
to compare one company’s operations with<br />
another’s in order to make “like-for-like”<br />
comparisons.<br />
Benchmarking a supply chain clearly can help<br />
companies determine their relative performance and<br />
shore up operations to stay competitive. But until<br />
recently, conducting effective benchmarking quickly<br />
and cost-effectively was a monumental task, one that<br />
consumed big budgets, patience, and time. The biggest<br />
hurdle was coming up with standard ways to compare<br />
one company’s operations with another’s in order<br />
to make “like-for-like” comparisons. The SCORmark<br />
system has done the heavy lifting of defining those<br />
standards. It’s now becoming far easier for manufacturers<br />
and their supply chain partners to determine<br />
whether they’re keeping pace and what they need to<br />
do about it.<br />
Supply chain benchmarking doesn’t have to a complex,<br />
costly undertaking. Early adopters of SCORmark<br />
have proven that convincingly. If you’re looking for a relatively<br />
pain-free—yet effective—way of benchmarking<br />
your supply chain activities, SCORmark could be right<br />
for you, too. <br />
Sources:<br />
1<br />
Poluha, Rolf G. Application of the SCOR Model in Supply<br />
Chain Management. Youngstown, NY: Cambria Press, May<br />
2007.<br />
www.scmr.com Supply Chain Management Review · April 2008 29