IV - Discrete Probability Distributions - SLC Home Page
IV - Discrete Probability Distributions - SLC Home Page
IV - Discrete Probability Distributions - SLC Home Page

You also want an ePaper? Increase the reach of your titles
YUMPU automatically turns print PDFs into web optimized ePapers that Google loves.
MATHEMATICS 360-255-LW<br />
Quantitative Methods II<br />
Martin Huard<br />
Winter 2013<br />
<strong>IV</strong> – <strong>Discrete</strong> <strong>Probability</strong> <strong>Distributions</strong><br />
1. Let x denote the number of auto accidents that occur in a city during a week. The following<br />
lists the probability distribution of x.<br />
x 0 1 2 3 4 5 6<br />
px 0.12 0.16 0.22 0.18 0.14 0.12 0.06<br />
Determine the probability that the number of auto accidents that will occur during a given<br />
week in this city is<br />
a) exactly 4<br />
b) at least 3<br />
c) less than 3<br />
d) 3 to 5 (inclusively)<br />
2. Here is the probability distribution for the number of candy bars sold at a house by a child<br />
selling the candy for a school fundraiser.<br />
x 0 1 2 3<br />
px 0.4 0.25 0.2 0.15<br />
a) Find the probability that the child fails to sell a candy bar at a particular house.<br />
b) Find the probability that the child sells at least 2 candy bars at a particular house.<br />
c) How many candy bars should the child expect to sell at a house<br />
d) Find the standard deviation of this probability distribution.<br />
e) Draw a histogram for this probability distribution.<br />
3. According to a survey, 60% of all students at a large university suffer from math anxiety.<br />
Two students are randomly selected from this university. Let x denote the number of<br />
students in this sample who suffer from math anxiety.<br />
a) Find the probability distribution for x.<br />
b) Draw a histogram of the probability distribution.<br />
c) Find the mean of this probability distribution.<br />
d) Find the variance for this probability distribution.<br />
4. An urn contains 20 marbles, of which 8 are blue and 12 are green. Three marbles are taken<br />
out of the bag and the number of blue marbles is counted.<br />
a) Construct a probability distribution.<br />
b) Draw a histogram.<br />
c) Find the mean of this probability distribution.<br />
d) Find the standard deviation of this distribution.
QM II<br />
<strong>IV</strong> – <strong>Discrete</strong> <strong>Probability</strong> <strong>Distributions</strong><br />
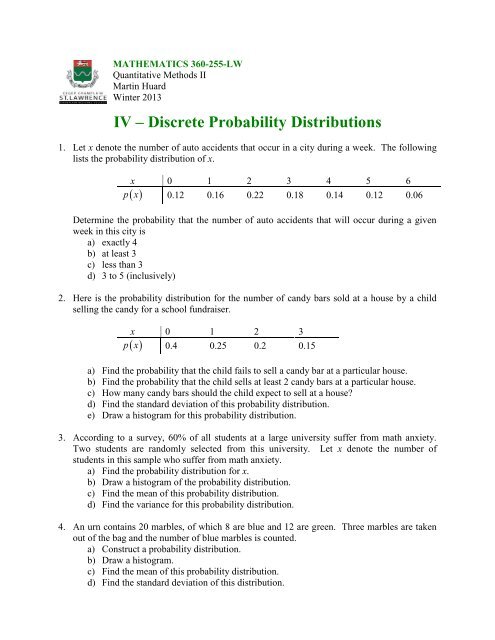
5. A consume agency surveyed all 2500 families living in a small town to collect data on the<br />
number of television sets owned by them. The following table lists the frequency<br />
distribution of the data collected by this agency.<br />
Number of TV sets owned 0 1 2 3 4<br />
Number of families 120 970 730 410 270<br />
a) Construct a probability distribution table for the number of television sets owned by<br />
these families.<br />
b) Draw a histogram.<br />
P x 2<br />
c) Find <br />
d) Find Px<br />
1<br />
e) Find P1 x<br />
2<br />
f) How many TV sets do you expect a family chosen at random to have<br />
g) Find the standard deviation of this distribution.<br />
6. A lottery has a first prize of $5000, two second prices of $1000 each, and two $100 third<br />
prizes. A total of 10000 tickets are sold, at $1 each. Find the expected winnings of a person<br />
buying 1 ticket.<br />
7. In one form of the game Keno, the house has a pot containing 80 balls, each marked with a<br />
different number from 1 to 80. You buy a ticket for $1 and mark one of the 80 numbers on<br />
it. The house then selects 20 numbers at random. If your number is among the 20, you get<br />
$3.20. Find the expected winnings for a person buying one ticket.<br />
8. In Lotto Max, a selection is composed of 7 different numbers from 1 to 47. Prizes can be won<br />
in seven different categories: 7/7, 6/7+, 6/7, 5/7, 4/7, 3/7+ and 3/7. To win, a single selection<br />
must contain 3, 4, 5, 6 or 7 numbers that match the winning selection. The bonus number,<br />
represented by the "+" symbol, is associated only with the categories 6/7+ and 3/7+. To win<br />
in these categories, a single selection must contain respectively, in addition to the bonus<br />
number, 6 or 3 numbers that match the winning selection. Tickets are sold $5 and you get<br />
three selections. Here are the prizes.<br />
Category<br />
Prize<br />
7/7 $20,000,000*<br />
6/7+ bonus $362,919*<br />
6/7 $5,583*<br />
5/7 $124*<br />
4/7 $20<br />
3/7+ bonus $20<br />
3/7 Free ticket<br />
* prize is a percentage of pools fund, these are from January 18, 2013<br />
a) What is the probability of winning the Jackpot<br />
b) What is the probability of winning<br />
c) What is the payoff rate<br />
Winter 2013 Martin Huard 2
p(x)<br />
p(x)<br />
p(x)<br />
p(x)<br />
QM II<br />
<strong>IV</strong> – <strong>Discrete</strong> <strong>Probability</strong> <strong>Distributions</strong><br />
ANSWERS<br />
1. a) 0.14 b) 0.5 c) 0.5 d) 0.44<br />
2. a) 0.4<br />
b) 0.35<br />
c) 1.1<br />
d) 1.09<br />
e)<br />
<strong>Probability</strong> Histogram<br />
3. a) <strong>Probability</strong> Distribution b) c) 1.2<br />
<strong>Probability</strong> Histogram<br />
d) 0.48<br />
x<br />
px<br />
<br />
0 0.16<br />
1 0.48<br />
2 0.36<br />
4. a) <strong>Probability</strong> Distribution b) c) 1.2<br />
<strong>Probability</strong> Histogram<br />
d) 0.803<br />
x<br />
px<br />
<br />
0 0.193<br />
1 0.463<br />
2 0.295<br />
3 0.049<br />
5. a) <strong>Probability</strong> Distribution b) c) 0.272<br />
d) 0.436<br />
x px<br />
<br />
<strong>Probability</strong> Histogram<br />
0.5<br />
e) 0.680<br />
0 0.048<br />
0.4<br />
f) 1.896<br />
0.3<br />
1 0.388<br />
g) 1.079<br />
0.2<br />
2 0.292<br />
0.1<br />
3 0.164<br />
0<br />
4 0.108<br />
0 1 2 3 4<br />
6. -$0.28 7. -$0.20<br />
8. a) 0.0000000477 b) 0.170 or 1 in 5.9 c) 51.3%<br />
Category Prize <strong>Probability</strong><br />
7/7 $20,000,000 0.0000000477<br />
6/7+ bonus $362,919 0.000000334<br />
6/7 $5,583 0.0000130<br />
5/7 $124 0.000781<br />
4/7 $20 0.0165<br />
3/7+ bonus $20 0.0153<br />
3/7 5 0.137<br />
0.5<br />
0.4<br />
0.3<br />
0.2<br />
0.1<br />
0<br />
0 1 2 3<br />
0.6<br />
0.5<br />
0.4<br />
0.3<br />
0.2<br />
0.1<br />
0<br />
0.5<br />
0.4<br />
0.3<br />
0.2<br />
0.1<br />
0.0<br />
x : # of candy sold<br />
0 1 2<br />
x : # studens who suffer math anxiety<br />
0 1 2 3<br />
x : # of blue marbles<br />
x : # TV sets owned<br />
Winter 2013 Martin Huard 3