NVivo 10 Features list - English - QSR International
NVivo 10 Features list - English - QSR International
NVivo 10 Features list - English - QSR International

Create successful ePaper yourself
Turn your PDF publications into a flip-book with our unique Google optimized e-Paper software.
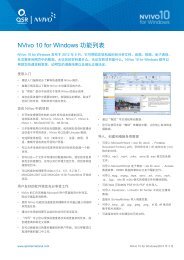
<strong>NVivo</strong> <strong>10</strong> for Windows feature <strong>list</strong><br />
Released in June 2012, <strong>NVivo</strong> <strong>10</strong> for Windows helps you to easily organize and analyze data in<br />
documents, audio, video, spreadsheets, social media and web pages. Whatever your materials,<br />
whatever your project – <strong>NVivo</strong> <strong>10</strong> for Windows can help you to quickly arrive at answers, justify your<br />
findings and make informed decisions.<br />
Getting started<br />
• Get up and running fast with a Getting Started guide.<br />
• View the sample project to see how a project can be set<br />
up in <strong>NVivo</strong>.<br />
• Read step-by-step instructions for working with <strong>NVivo</strong> in<br />
the ‘help’ section.<br />
• Get relevant assistance when you need it with context<br />
sensitive help – the help information changes depending<br />
on the task you’re performing.<br />
Your projects in <strong>NVivo</strong><br />
• Open and work with projects developed in previous<br />
versions of <strong>QSR</strong> software including <strong>NVivo</strong> 9, <strong>NVivo</strong> 8,<br />
<strong>NVivo</strong> 7, <strong>NVivo</strong> 2, <strong>NVivo</strong> 1, N6 (NUD*IST 6), N5 and N4.<br />
• Work with data in virtually any language including<br />
character based languages such as Japanese and<br />
Mandarin. <strong>NVivo</strong> handles Unicode data.<br />
• Choose to work with an <strong>English</strong>, Chinese (Simplified<br />
Chinese), French, German, Japanese, Portuguese or<br />
Spanish user interface.<br />
• Merge separate projects or use the structure of an<br />
existing project for a new one.<br />
• Store your project data and material in a single file,<br />
making your project completely portable. Or store large<br />
files separately and link them to your project.<br />
• Convert and work with projects developed in Atlas.ti<br />
5.2, 5.5, 6.2 and 7; MAXQDA 2007 and MAXQDA <strong>10</strong>; and<br />
FrameWork.<br />
Enjoy working with software that’s user friendly<br />
• <strong>NVivo</strong>’s workspace is based on Microsoft user interface<br />
guidelines, so it looks familiar.<br />
• Use the <strong>NVivo</strong> ribbon to find and understand commands<br />
quickly and complete tasks with a minimum number of<br />
clicks.<br />
• Organize and access all of your project items via a central<br />
navigation view.<br />
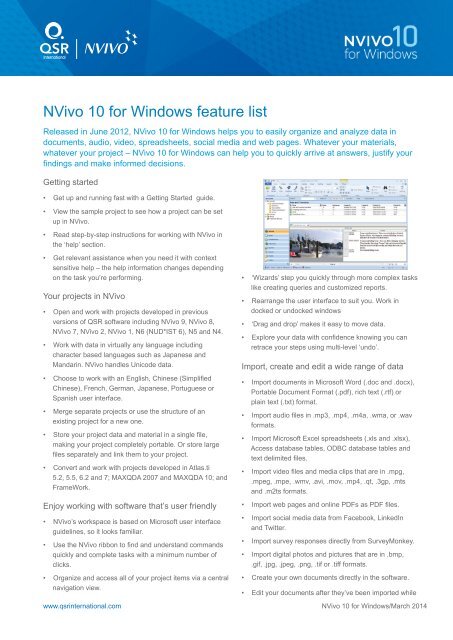
• ‘Wizards’ step you quickly through more complex tasks<br />
like creating queries and customized reports.<br />
• Rearrange the user interface to suit you. Work in<br />
docked or undocked windows<br />
• ‘Drag and drop’ makes it easy to move data.<br />
• Explore your data with confidence knowing you can<br />
retrace your steps using multi-level ‘undo’.<br />
Import, create and edit a wide range of data<br />
• Import documents in Microsoft Word (.doc and .docx),<br />
Portable Document Format (.pdf), rich text (.rtf) or<br />
plain text (.txt) format.<br />
• Import audio files in .mp3, .mp4, .m4a, .wma, or .wav<br />
formats.<br />
• Import Microsoft Excel spreadsheets (.xls and .xlsx),<br />
Access database tables, ODBC database tables and<br />
text delimited files.<br />
• Import video files and media clips that are in .mpg,<br />
.mpeg, .mpe, .wmv, .avi, .mov, .mp4, .qt, .3gp, .mts<br />
and .m2ts formats.<br />
• Import web pages and online PDFs as PDF files.<br />
• Import social media data from Facebook, LinkedIn<br />
and Twitter.<br />
• Import survey responses directly from SurveyMonkey.<br />
• Import digital photos and pictures that are in .bmp,<br />
.gif, .jpg, .jpeg, .png, .tif or .tiff formats.<br />
• Create your own documents directly in the software.<br />
• Edit your documents after they’ve been imported while<br />
www.qsrinternational.com <strong>NVivo</strong> <strong>10</strong> for Windows/March 2014
maintaining coding that’s already been performed.<br />
• You can check spelling as you edit in <strong>NVivo</strong>.<br />
• <strong>NVivo</strong> preserves and uses styles in original documents,<br />
including styles created in non-<strong>English</strong> languages.<br />
Organize and classify your data with ease<br />
• In <strong>NVivo</strong>, the containers for storing themes or ideas are<br />
called ‘nodes’. Nodes can represent anything – like<br />
people, places and organizations, and you can assign<br />
demographic data or attributes to them.<br />
• Create nodes ‘on the fly‘ or ‘up-front‘ and easily manage<br />
them. For example, move nodes into different folders,<br />
organize or rearrange them in hierarchies, merge similar<br />
nodes, or rename a node.<br />
• Assign your own colors to nodes, sources, attribute<br />
values and users, and see them throughout your project -<br />
in charts and models for example.<br />
• Group sources that share common characteristics (such<br />
as interview transcripts) together using ‘Classifications’ to<br />
help with organization and analysis.<br />
• Easily import demographic information such as gender<br />
and age into <strong>NVivo</strong> as a text file or in a spreadsheet.<br />
• Create a collection of ‘shortcuts’ called ‘Sets’ for project<br />
items stored elsewhere in your project.<br />
• Get support for a wide range of research methodologies.<br />
For example, conduct Framework analysis using<br />
framework matrices.<br />
Make sense of your information with coding<br />
• <strong>NVivo</strong> lets you gather all your material about a theme,<br />
idea or topic together through ‘coding’.<br />
• Code your material using a range of techniques<br />
including ‘dragging and dropping’ with your mouse,<br />
paragraph coding or ‘In Vivo’ coding.<br />
• Use the Quick Coding bar to create new nodes quickly,<br />
and to code at nodes that you’ve used most recently.<br />
• Use coding stripes to display coding or demographic<br />
information in documents, pictures, video or audio files<br />
visually. Choose which stripes to display or see up to<br />
200 stripes. Your coding stripes can also be printed.<br />
• Assign your own colors to coding stripes.<br />
• Use the ‘coding density bar’ to see how much coding<br />
has been performed for a specific source.<br />
• See what content has been coded at particular nodes,<br />
or coded by one or more users, with ‘highlight coding’.<br />
• Auto code structured information in documents and<br />
datasets, like interview responses.<br />
• Use ‘drag and drop’ coding to quickly and easily code all<br />
types of source content.<br />
• Use pattern-based auto coding to code large volumes of<br />
text quickly. This experimental feature will be further<br />
developed in future releases of the software.<br />
Capture your thinking: memos and comments<br />
• Create memos to capture your observations and link<br />
them to materials. Easily insert a date and time stamp.<br />
• Create annotations to comment on selected content.<br />
They’re like notes scribbled in a margin, only they can<br />
be easily changed or added to.<br />
Link ideas, themes and information<br />
• Apply ‘see also’ links to note a comparison or to lay a trail<br />
of evidence. Link from any content including a section of<br />
audio or video timeline.<br />
• Use ‘memo links’ to capture important related<br />
observations or insights.<br />
• Use hyperlinks to link selected references to files or<br />
other information outside your <strong>NVivo</strong> project.<br />
Work with documents, audio, video and images<br />
• Select and work directly with text, images and tables<br />
within PDFs and Word documents.<br />
• Easily access any hyperlinked content within your data.<br />
• Code image regions within a PDF, for example a<br />
section of a map or a graphic.<br />
• Review and analyze audio and video in <strong>NVivo</strong>. Vary the<br />
playback speed, continually loop a section, or rewind or<br />
skip sections by a number of seconds.<br />
• Work directly with media files, even if you don’t have a<br />
transcript.<br />
• Create a transcript for an entire audio or video file, for<br />
a section of a file, or just create keywords in <strong>NVivo</strong>.<br />
• Import and link an existing transcript to its corresponding<br />
audio or video file.<br />
• Play an audio or video file and watch your transcript<br />
scroll in synchronization.<br />
• Click on a line in your transcript to bring up the section of<br />
video or audio it relates to.<br />
2
• Code content in a transcript and shadow coding stripes<br />
show you where the coding occurs in the media.<br />
• Work with geospatial data like aerial photos and maps<br />
from ‘Google Earth’.<br />
• Create your own ‘log’ or description of an entire picture, or<br />
for a specific section of a picture, in <strong>NVivo</strong>.<br />
Work with spreadsheets and database tables<br />
• Select how you view and work with your spreadsheets<br />
and database tables. Use the ‘table view’ to see your<br />
data in its original format or work with one survey<br />
response at a time for example, with the ‘form’ view.<br />
• Speed up your analysis – particularly when you’re<br />
working with large datasets – by automatically coding<br />
your data.<br />
• Automatically gather each respondent‘s answers into a<br />
single node representing that individual (by row) or<br />
gather all respondents’ answers to each question in a<br />
node representing that question (by column).<br />
• Automatically group responses based on demographic<br />
data.<br />
Work with literature reviews and bibliographies<br />
• Import bibliographical data from reference management<br />
software like EndNote, Mendeley, RefWorks or Zotero.<br />
• Directly import and work with information like a journal<br />
article’s title, author and your own notes. If you’ve<br />
saved articles as file attachments, they’re added to your<br />
<strong>NVivo</strong> project too.<br />
Capture and analyze online data<br />
• Optionally install NCapture - a web browser extension<br />
for Internet Explorer 8 (or later) or Google Chrome 21<br />
(or later). Use NCapture to collect web pages, online<br />
PDFs, social media data and YouTube videos and then<br />
import this content into <strong>NVivo</strong>.<br />
• Import web pages—the full web page or just the<br />
main article—and online PDFs to work with in <strong>NVivo</strong>.<br />
• Import Facebook wall posts and comments from people,<br />
organizations or groups.<br />
• Import Tweets from Twitter. For example, include a<br />
particular word, phrase or hashtag, or Tweets by a<br />
particular user.<br />
• Import LinkedIn group discussions.<br />
• Import YouTube content. Use NCapture to collect<br />
YouTube videos and work with them in <strong>NVivo</strong>. You may<br />
also want to import comments as a dataset.<br />
• <strong>NVivo</strong> provides automatic coding features to quickly<br />
group social media data—for example, group Facebook<br />
wall posts by conversation, or group Tweets by hashtag.<br />
• <strong>NVivo</strong> provides automatic visualizations for Facebook,<br />
Twitter and LinkedIn datasets to help you see patterns in<br />
your data. For example, use the Map tab to geovisualize<br />
your data or use the Chart tab in Twitter datasets to<br />
compare users based on the number of followers they<br />
have.<br />
• Import survey responses directly from SurveyMonkey.<br />
Import notes from Evernote or OneNote<br />
• If you use Evernote to take notes, collect images or<br />
clip web pages - you can now import your notes into<br />
your project and work with them in <strong>NVivo</strong>.<br />
• You can use Evernote to collect and organize data on<br />
your mobile device when you’re out and about. When<br />
you’re back at your desk, you can connect to your<br />
Evernote account (from within <strong>NVivo</strong>) and import the<br />
material.<br />
• If you use OneNote to gather notes, images or keep<br />
track of ideas, you can now export these pages from<br />
OneNote and bring them into <strong>NVivo</strong>. <strong>NVivo</strong> retains the<br />
way you structured your data so you can begin<br />
working right away.<br />
Transcription Services<br />
• Now there’s a fast, easy and cost efficient way to<br />
transcribe and analyze video and audio content. We have<br />
partnered with TranscribeMe to provide you with a<br />
seamless experience of ordering transcripts from within<br />
<strong>NVivo</strong> and having it automatically download and synch up<br />
to the media file in your project.<br />
Use smart search and find tools<br />
• Use ‘advanced find’ to locate project items based on<br />
their properties or other criteria, including multiple<br />
criteria values.<br />
• Save the criteria you used to ‘find’ an item into a<br />
‘search folder’ - so if you need to re run the same find<br />
later, you’ll be able to do so easily. Search folders are<br />
dynamic which means they’re updated as your project<br />
changes.<br />
Interrogate data with query tools<br />
• Explore your data, test theories and make discoveries<br />
3<br />
using ‘queries’. Re-run them through new data and
track the evolution of results.<br />
• Use a ‘text search’ query to find an exact word match<br />
or words that are similar in meaning.<br />
• Use a ‘word frequency’ query to see a <strong>list</strong> of the words<br />
that appear most often within your materials.<br />
Double-click a word to see it in context.<br />
• Use coding queries to explore and ask questions<br />
about your coding – they help you to look for overlaps<br />
and intersections in your coding.<br />
• Matrix coding queries allow you to compare coded<br />
material across nodes, sets or attribute values.<br />
• Use compound queries to search based on multiple<br />
criteria.<br />
• Use a group query to show particular types of<br />
associations between project items.<br />
Visualize patterns and connections in your data<br />
• Create models to display new ideas, connections and<br />
findings. Use a dynamic model to represent your project<br />
in real time or use a static model to capture your project<br />
at a specific point in time.<br />
• Click on the project item in a model to see the underlying<br />
data in your <strong>NVivo</strong> project.<br />
• Use graphs to see all the project items associated to a<br />
theme, idea, person or any other item. To add your own<br />
ideas, convert this graph into a model and continue<br />
working with it.<br />
• Use word clouds, tree maps and word trees to see the<br />
most frequently appearing words in selected materials<br />
(sources) or nodes and easily interact with them to<br />
explore the context that surrounds the words.<br />
differences in your sources or nodes.<br />
• Explore two-way connections between items and<br />
display them visually with ‘connection maps’ to help<br />
you identify any patterns.<br />
Interchange and share your data<br />
• Use predefined reports or create your own using the<br />
wizard. Your report criteria are saved so you can<br />
reuse it in the same project, or share it with others.<br />
• Modify your reports and extracts by adding or removing<br />
fields or changing the order of your data for example.<br />
You can apply your own color schemes and styles to<br />
reports too.<br />
• Produce a wide range of inbuilt reports such as a<br />
project summary, source summary, node summary, or<br />
coding reports.<br />
• Choose exactly which data to extract and use with the<br />
‘extracts’ feature - export data in XML format, as text<br />
or in a spreadsheet.<br />
• Import and export delimited text files, spreadsheets,<br />
and database tables to and from applications like<br />
Microsoft Excel, Microsoft Access, IBM SPSS Statistics<br />
and SAS/STAT.<br />
• Import and export data to and from reference<br />
management software like EndNote, Mendeley,<br />
RefWorks, or Zotero.<br />
• Share project files and findings as HTML web pages.<br />
Share the information gathered under a node, or<br />
export specific project items like audio files, videos or<br />
sections of documents.<br />
• Export charts, models and visualizations as images to<br />
use in presentations or documents.<br />
• Export the data into Excel for further analysis.<br />
• Export diagrams such as charts, in PDF format.<br />
Enjoy enhanced performance and scalability<br />
• Create and explore ‘charts’ in <strong>NVivo</strong>, including column,<br />
pie and bar charts. View the live data behind a chart with<br />
one click.<br />
• Use cluster analysis to visualize the similarities and<br />
• The way <strong>NVivo</strong> stores and accesses data has been<br />
optimized, so <strong>NVivo</strong> performs tasks even faster<br />
- including coding, auto coding, creating and opening<br />
nodes, running queries and deleting project items.<br />
• <strong>NVivo</strong> performs better when working with large<br />
amounts of data, for example, large sources and nodes<br />
open faster, regardless of size. Queries run faster, even<br />
as project size increases.<br />
4
• The maximum project size for standalone projects has<br />
been increased to <strong>10</strong> GB (previously 4GB).<br />
Work effectively in teams<br />
• Use the event log to record changes to a project and<br />
keep track of what team members are doing.<br />
• View the specific coding, annotations and links<br />
completed by each team member, even after separate<br />
projects have been merged together.<br />
• See which team member originally created a project<br />
item and who last modified it.<br />
• See content that one team member has coded to a<br />
node or broaden the view to see several team<br />
members.<br />
• Use coding stripes to view and compare all the coding<br />
completed by different users.<br />
• Run ‘queries’ on the work completed by team members.<br />
For example, query all the coding created by one team<br />
member. Then click on a result to open the original<br />
source material and see the coding stripes for the team<br />
member.<br />
• Use ‘coding comparison’ queries to show, for example,<br />
the percentage of coding agreement or disagreement<br />
amongst teams. Or use a query to obtain a<br />
measurement for coding reliability called the ‘kappa<br />
coefficient’.<br />
Combine <strong>NVivo</strong> Server with <strong>NVivo</strong> to:<br />
• Allow team members to work in the same project at the<br />
same time and see each other’s changes immediately.<br />
• Streamline project administration by storing and<br />
maintaining projects in one secure location.<br />
• Work with more data and embed larger audio and<br />
video resources in your projects.<br />
• Enhance security by protecting access to projects using<br />
authenticated Windows credentials, and role based<br />
permissions.<br />
• Visit www.qsrinternational.com to find out more about<br />
<strong>NVivo</strong> Server.<br />
More about <strong>NVivo</strong><br />
• View our ‘Introducing <strong>NVivo</strong>’ video<br />
• See <strong>NVivo</strong> in action: join an upcoming eDemo<br />
• Try <strong>NVivo</strong> yourself: download a 30-day free trial.<br />
• Watch tutorials to learn how <strong>NVivo</strong> features are used.<br />
• Watch <strong>QSR</strong> eSeminar videos to learn how others<br />
research and use <strong>NVivo</strong> in their projects.<br />
5