CHAPTER 6 EARTHQUAKE
CHAPTER 6 EARTHQUAKE
CHAPTER 6 EARTHQUAKE

Create successful ePaper yourself
Turn your PDF publications into a flip-book with our unique Google optimized e-Paper software.
<strong>CHAPTER</strong> 6<br />
<strong>EARTHQUAKE</strong><br />
An earthquake is generally defined as a sudden motion or trembling in the Earth caused by<br />
the abrupt release of slowly accumulated strain. The most common types of earthquakes are<br />
caused by movements along faults and by volcanic forces, although they can also result from<br />
explosions, cavern collapse, and other minor causes not related to slowly accumulated<br />
strains.<br />
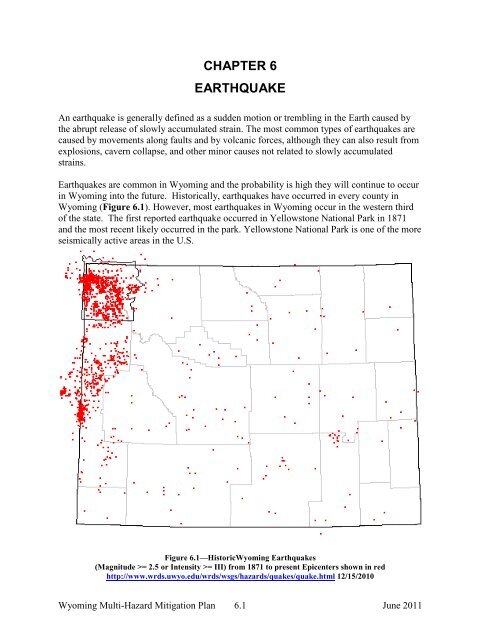
Earthquakes are common in Wyoming and the probability is high they will continue to occur<br />
in Wyoming into the future. Historically, earthquakes have occurred in every county in<br />
Wyoming (Figure 6.1). However, most earthquakes in Wyoming occur in the western third<br />
of the state. The first reported earthquake occurred in Yellowstone National Park in 1871<br />
and the most recent likely occurred in the park. Yellowstone National Park is one of the more<br />
seismically active areas in the U.S.<br />
Figure 6.1—HistoricWyoming Earthquakes<br />
(Magnitude >= 2.5 or Intensity >= III) from 1871 to present Epicenters shown in red<br />
http://www.wrds.uwyo.edu/wrds/wsgs/hazards/quakes/quake.html 12/15/2010<br />
Wyoming Multi-Hazard Mitigation Plan 6.1 June 2011
Earthquake Sources<br />
Most Wyoming earthquakes outside of Yellowstone National Park occur as a result of<br />
movement on faults. If the fault has moved within the Quaternary Period, or last 1.6 million<br />
years, the fault is considered to have the greatest potential to be the source of future large<br />
earthquakes (Michael Machette, U.S. Geological Survey Fact Sheet 2004-3033). Quaternary<br />
faults that show movement over the past 10,000 years are considered to be “active.” Of the<br />
approximately 80 Quaternary faults in Wyoming (Figure 2), 26 are considered to be “active.”<br />
The most well known “active” fault in Wyoming is the Teton fault near Jackson.<br />
Active faults can be exposed at the surface (Figure 6.2) or deeply buried with no significant<br />
surface expression. Historically, no earthquakes have been associated with exposed active<br />
faults. The exposed active faults, however, have the potential to generate the largest<br />
earthquakes. As a result it is necessary to understand both exposed and buried active faults in<br />
order to generate a realistic seismological characterization of the state.<br />
Figure 6.2—Exposed Known or Suspected Active Faults in Wyoming.<br />
Wyoming Multi-Hazard Mitigation Plan 6.2 June 2011
Many of the exposed active faults, including the Teton fault, Star Valley fault, Greys River<br />
fault, Rock Creek fault, and the Bear River fault system in western Wyoming are capable of<br />
generating magnitude 7.0 to 7.5 earthquakes. All of those fault systems have been active in<br />
the last 10,000 years, and most are considered to be overdue for activation.<br />
In central Wyoming, the Stagner Creek fault system near Boysen Reservoir and the South<br />
Granite Mountain fault system near Jeffrey City, are both capable of generating magnitude<br />
6.5 to 6.75 earthquakes. The Cedar Ridge-Dry Fork fault system near Lysite has limited<br />
evidence indicating it may be active, and may be capable of a magnitude 6.7 to 7.1<br />
earthquake. The Chicken Springs fault system near Bairoil is capable of generating<br />
magnitude 6.5 to 6.7 earthquakes.<br />
Historically, no earthquakes have been directly associated with the exposed active faults.<br />
Instead, they are tied to faults that are buried. Buried faults that have never broken the<br />
surface, are generally considered to be capable of generating up to magnitude 6.5<br />
earthquakes. Since the distribution of the buried faults is not well known, it is assumed that<br />
earthquakes up to magnitude 6.5 can occur anywhere in the state. The probability of such an<br />
earthquake is lowest in the southeast and northeast corners of the state, although a magnitude<br />
6.2 to 6.6 earthquake did occur in 1882 between Laramie and Estes Park, Colorado.<br />
As mentioned above, earthquakes are common in Yellowstone National Park. A dynamic<br />
magma chamber beneath the park, combined with regional tectonic forces, results in<br />
significant seismic activity. Many of the earthquakes are associated with movement within or<br />
around the magma chamber. Some of the earthquakes are associated with active faults.<br />
Yellowstone is a super-volcano, and it has explosively erupted 0.64 million, 1.3 million, and<br />
2.1 million years ago. The explosive eruptions led to the formation of giant calderas, the<br />
collapse of which led to the formation of many faults in the vicinity. In addition, after the<br />
major eruptions, resurgent domes formed within the calderas. The doming process led to the<br />
formation of other faults. As a result, many of the faults in Yellowstone are not considered<br />
major threats. There are other faults, however, that are easily capable of generating<br />
magnitude 6.5+ earthquakes.<br />
In 1959, a magnitude 7.5, intensity X earthquake occurred just west of Yellowstone National<br />
Park, near Hebgen Lake, Montana. That earthquake is a model for the types of earthquakes<br />
that can occur in western Wyoming. Even though Wyoming has not experienced a magnitude<br />
7.5 earthquake within its borders in the last 130 years, the potential does exist.<br />
Attempts were made to access current earthquake data utilizing the US Geological Survey<br />
Web Site. The most recent Wyoming posting to their Historic United States Earthquakes<br />
page reflects a 2004 earthquake, magnitude 3.8.<br />
(http://earthquake.usgs.gov/earthquakes/states/historical_state.php) However, there have<br />
been two earthquake swarms in Yellowstone Park in recent years. The first occurred<br />
between December 2008 and January 2009.<br />
(http://volcanoes.usgs.gov/yvo/publications/2009/09swarm.php 12/15/2010) The second<br />
earthquake swarm began on January 15, 2010, diminished to near-background levels by the<br />
Wyoming Multi-Hazard Mitigation Plan 6.3 June 2011
end of February, 2010 and picked up somewhat in early April, 2010.<br />
(http://volcanoes.usgs.gov/yvo/publications/2010/10swarm.php 12/15/2010) These<br />
earthquakes were not significant in terms of damage or magnitude, but were noted because of<br />
their frequency in a short period of time.<br />
Earthquakes in Wyoming have also been associated with mine-related activities. In the early<br />
to mid-1900s, there were seismic events associated with coal mines beneath Rock Springs<br />
and Reliance in Sweetwater County. In many cases there was uncertainty as to whether a<br />
mine collapse generated a seismic event or whether an earthquake caused a mine collapse. In<br />
1995, the collapse of a part of the Solvay trona mine near Green River generated a magnitude<br />
5.3 earthquake. There have been numerous other mine-related events in Sweetwater County<br />
that have generated small earthquakes.<br />
Earthquake Loss Estimates Scenarios – January 2011<br />
Because of recent earthquake activity in Wyoming, the Wyoming State Geological Survey<br />
Office undertook a study including 16 scenarios. The scenarios included four random event<br />
scenarios run on the basis of data from historic earthquakes that occurred near Casper,<br />
Gillette, Laramie Peak, and Estes Park, Colorado. Each of the historic, random event<br />
earthquake scenarios registered a 6.0 magnitude. The Estes Park Scenario was based on an<br />
event occurring in 1882, the Casper area event in 1897, and the Gillette and Laramie Peak<br />
events in 1984.<br />
The State Geological Survey Office also included 12 fault-based scenarios in their study,<br />
based on the information in the table below:<br />
Fault based earthquake scenarios<br />
Quaternary fault<br />
Scenario magnitude<br />
Bear River fault system 6.9<br />
Chicken Springs fault system 6.5<br />
Eagle Bay fault system 6.8<br />
East Mount Sheridan fault<br />
system<br />
6.4<br />
Grand Valley fault system 7.1<br />
Greys River fault 7.1<br />
Hoback fault 6.6<br />
Rock Creek fault 7.0<br />
South Granite fault system 6.8<br />
Stagner Creek fault system 6.8<br />
Teton fault 7.2<br />
Upper Yellowstone fault system 6.5<br />
The fault-based scenarios were run using two methods. Three of the fault based scenarios,<br />
the South Granite Mountain fault system, the Stagner Creek fault system, and the Chicken<br />
Springs fault system, were run using WSGS soil maps and default HAZUS-MH ® models to<br />
provide loss estimates. The remaining nine faults were run with the help of the United States<br />
Wyoming Multi-Hazard Mitigation Plan 6.4 June 2011
Geological Survey (USGS): the USGS provided shakemaps, which model ground shaking<br />
parameters on the basis of complex attenuation functions.<br />
The random event scenarios are based on historic events, and although the data<br />
provided is beneficial, the odds of an earthquake happening in the exact location of each<br />
scenario are infinitesimal. On the other hand the fault based scenarios are based on faults<br />
that have been deemed potential sources of earthquakes. It is impossible to say when an<br />
earthquake can occur, but fault sources point to where large destructive earthquakes would<br />
happen. This study is not all-inclusive, but does provide valuable information for planning<br />
purposes. Scenario regions covered only those areas that would experience potentially<br />
damaging modeled ground motions (> 3.5%g). Areas outside the region boundaries would<br />
undoubtedly experience shaking from the earthquake; but structural damage would not be<br />
expected.<br />
The scenario-based study is nearly ready to publish at the time of this plan. The draft report<br />
has been provided to each requesting county at no cost to them.<br />
The report includes information regarding the likelihood of damage to local and regional<br />
infrastructure, including fire stations, police stations, sheriffs’ departments, schools, and<br />
hospitals. The scenarios reflect anticipated functionality of each infrastructure system<br />
immediately following the scenario earthquake, on day seven following the earthquake and<br />
one month after the earthquake. Additional information provided includes anticipated<br />
households displaced or seeking temporary shelter, electrical outages anticipated, number of<br />
households without potable water, debris generated by the scenario and economic losses<br />
resulting from three categories: buildings, transportation and utilities. (see Appendix<br />
‘Earthquake Loss Estimate Scenarios’)<br />
The information provided in the report will allow for more intelligent exercising of responses<br />
and more complete, concrete information for proposed earthquake mitigation projects<br />
undertaken both locally and statewide. The scenario-based report with all scenarios<br />
described is attached as an appendix to this plan. The scenarios were developed utilizing the<br />
most current development information available at the time. 2010 Census data has since<br />
become available and will be utilized in future earthquake research. Following is one sample<br />
scenario developed by the Wyoming Geological Survey Office utilizing HAZUS-MH:<br />
Fault based scenario - Bear River fault system<br />
The Bear River fault zone is located in Uinta County, Wyo. and Summit County,<br />
Utah. The average strike is 349 degrees, the length is 35 km, and the dip is 45-80 degrees W<br />
(USGS, 2004). The fault slip-rate is between 1.0 and 5.0 mm/yr.<br />
The USGS describes the geologic setting of the Bear River fault zone as a generally<br />
north-trending fault zone east of the Bear River drainage on the west flank of the Uinta<br />
Mountains. The fault lies between the leading edges of the Absaroka and Darby-Hogsback<br />
thrust faults. This newly activated fault zone is east of the Bear River and is expressed as<br />
short, generally right-stepping, north-trending scarps that abruptly change to east-northeast<br />
trend at the southern end. The associated west-dipping normal faults are inferred to merge<br />
Wyoming Multi-Hazard Mitigation Plan 6.5 June 2011
into a ramp of the Laramide-age Darby-Hogsback thrust fault at a depth of about 5-7 km.<br />
Case (1997) gives a maximum credible earthquake of magnitude 7.5.<br />
The earthquake scenario for the Bear River fault system was modeled at magnitude<br />
6.9. The earthquake would cause damage in Lincoln, Sweetwater, and Uinta counties.<br />
Scenario results show that very light damage would be expected as far as 55 miles from the<br />
epicenter, near Granger (Figure 3). Light damage would be expected within 40 miles, out to<br />
Ft. Bridger. Moderate to heavy damage is likely within 15 miles of the fault, which includes<br />
the city of Evanston where ground accelerations of 18-34% gravity (g) would be expected.<br />
Beartown and Hilliard would expect the highest amount of shaking, with ground acceleration<br />
modeled between 34 and 65%g (MMI VIII). These are also the places where damage would<br />
be expected to be the greatest.<br />
The total population in the scenario region is 19,814 according to the 2000 census.<br />
The scenario results estimate that of the 19,814 people, 116 households would be displaced,<br />
and 80 people would seek temporary shelter.<br />
There are 9,180 buildings in the area, and the scenario shows that 1,147 of those<br />
would sustain at least moderate damage from the earthquake. The earthquake would<br />
generate 25,000 tons of debris.<br />
Bear River fault system earthquake scenario quick reference page<br />
Counties affected<br />
Uinta, Lincoln, Sweetwater<br />
Scenario magnitude 6.9<br />
Slip rate<br />
Recurrence interval<br />
Region population<br />
1.0 - 5.0 mm/yr<br />
1-100 ky<br />
19,804 (2000 Census)<br />
Region building count 9,173<br />
Region building value<br />
1.199 billion dollars<br />
Buildings with at least moderate damage 1146<br />
Hospitals functional @ Day 1 2 / 2<br />
Schools functional @ Day 1 17 / 17<br />
Police stations functional @ Day 1 5 / 5<br />
Fire stations functional @ Day 1 6 / 7<br />
Highway segments functional @ Day 1 63 / 63<br />
Bridges functional @ Day 1 127 / 128<br />
Households without potable water @ Day 1 4,243 / 6,847<br />
Households without electricity @ Day 1 0 / 6847<br />
Wyoming Multi-Hazard Mitigation Plan 6.6 June 2011
Debris generated<br />
25,000 tons<br />
Displaced households 116<br />
People seeking temporary shelter 80<br />
Direct economic loss<br />
87.770 million dollars<br />
Figure 3. Map showing ground acceleration based on a magnitude 6.9 earthquake from the Bear River<br />
Fault System<br />
Damage to essential facilities<br />
Essential facilities include fire stations, hospitals, police stations, and schools. There<br />
are 31 essential facilities that would experience damaging ground motions: 7 fire stations, 2<br />
hospitals, 5 police stations, and 17 schools. For more detailed information about essential<br />
facilities see the Bear River folder listed in Appendix B.<br />
Fire stations<br />
Table 2 shows that of the seven fire stations at risk of damage, the Hilliard fire station<br />
would have a greater than 50% risk of being at least slightly damage. The Hilliard fire<br />
station would be exposed to 54%g ground accelerations and would have a 94% chance of at<br />
least moderate damage and a 55% chance of extensive damage.<br />
Wyoming Multi-Hazard Mitigation Plan 6.7 June 2011
Table 1. Bear River fault system fire station damage probability<br />
Name<br />
City<br />
PGA<br />
Damage<br />
(%g) Slight Moderate Extensive<br />
Hilliard Evanston 54.32% 98.59% 93.48% 55.12%<br />
Uinta Co-Evanston-2 Evanston 19.48% 43.08% 22.90% 10.47%<br />
Evanston FD Evanston 19.28% 36.03% 13.95% 0.63%<br />
Almy Fire Hall Evanston 12.76% 11.43% 2.62% 0.04%<br />
Uinta Co Ft. Bridger Fort Bridger 9.60% 3.26% 0.49% 0.00%<br />
Uinta Co-Mountain View Mountain View 9.20% 3.03% 0.44% 0.00%<br />
Uinta Co-Lyman Lyman 8.36% 1.45% 0.17% 0.00%<br />
Estimates of fire station functionality show that the Hilliard fire station would be only<br />
1.4% functional on the day of the earthquake, while the Uinta County-Evanston fire station<br />
would be 56% functional (Table 3). The Evanston Fire Department would have 63%<br />
functionality. The other fire stations, Almy Fire Hall and fire stations in Ft. Bridger,<br />
Mountain View, and Lyman would be expected to be greater than 80% functional the day of<br />
the earthquake. By day 7 after the earthquake the Hilliard fire station would be 6.3%<br />
functional, while the remaining fire stations would all be greater than 75% functional. The<br />
scenario also shows that within one month of the earthquake the Hilliard fire station would<br />
be 44% functional, the Uinta County-Evanston fire station would be up to 89% functional,<br />
and the other fire stations should be fully functional.<br />
Table 2. Bear River fault system fire station functionality<br />
Functionality<br />
Name<br />
City<br />
Day 1 Day 2 Day 3<br />
Hilliard Evanston 1.4% 6.3% 44.8%<br />
Uinta Co-Evanston-2 Evanston 56.9% 76.6% 89.5%<br />
Evanston FD Evanston 63.9% 85.5% 99.3%<br />
Almy Fire Hall Evanston 88.5% 97.1% 99.9%<br />
Uinta Co Ft. Bridger Fort Bridger 96.7% 99.4% 99.9%<br />
Uinta Co-Mountain View Mountain View 96.9% 99.4% 99.9%<br />
Uinta Co-Lyman Lyman 98.5% 99.7% 99.9%<br />
Hospitals<br />
Table 4 shows the two hospitals at risk of damage from an earthquake on the Bear<br />
River fault system. Both hospitals would experience up to 20%g ground accelerations and<br />
there is a 60% chance that both would be at least slightly damaged.<br />
Table 3. Bear River Fault Scenario Hospital Damage Probability<br />
Name<br />
City<br />
PGA<br />
Damage<br />
(%g) Slight Moderate Extensive<br />
Wyoming State Hospital Evanston 20.56% 61.74% 36.27% 6.94%<br />
Evanston Regional<br />
Hospital<br />
Evanston 20.28% 60.61% 34.30% 3.94%<br />
Wyoming Multi-Hazard Mitigation Plan 6.8 June 2011
Each hospital would be approximately 40% functional the day of the earthquake<br />
(Table 5). A week after the earthquake the hospitals would be 63-65% functional and by 30<br />
days after the earthquake both hospitals would be over 90% functional.<br />
Table 4. Bear River fault scenario hospital functionality<br />
Name<br />
City<br />
Functionality<br />
Day 1 Day 7 Day 30<br />
Wyoming State Hospital Evanston 38.2% 63.1% 93.0%<br />
Evanston Regional<br />
Hospital Evanston 39.3% 65.0% 96.0%<br />
Police stations<br />
There are five police stations at risk for damage from an earthquake (Table 6). Of the<br />
five police stations only the two in Evanston, Uinta County Sheriff Headquarters and the<br />
Evanston Police Dept. Headquarters, would be at risk for very strong shaking. The Uinta<br />
County Sheriff Headquarters would have a probability of 41% to receive at least slight<br />
damage, while the Evanston PD HQ would have a 36% chance of sustaining at least slight<br />
damage. The three police stations in Mountain View and Lyman would experience moderate<br />
shaking, but would have a very low chance of sustaining any damage from the earthquake.<br />
Table 5. Bear River fault system police station damage probability<br />
Name<br />
City<br />
PGA<br />
Damage<br />
(%g) Slight Moderate Extensive<br />
Uinta County Sheriff's HQ Evanston 20.76% 41.19% 17.21% 0.91%<br />
Evanston PD HQ Evanston 19.28% 36.03% 13.95% 0.63%<br />
Uinta County Sheriff- Mountain View 9.28% 2.58% 0.36% 0.00%<br />
Mountain View Substation<br />
Mountain View PD HQ Mountain View 9.20% 3.03% 0.44% 0.00%<br />
Lyman PD HQ Lyman 8.36% 1.45% 0.17% 0.00%<br />
Table 7 shows that the three police stations outside Evanston would be more than<br />
90% functional on the day of the earthquake and at 99% functionality within 7 days. The<br />
Uinta County Sheriff Headquarters would be only 59% functional at day 1, while the<br />
Evanston Police Department Headquarters would be 64% functional. By 30 days after the<br />
earthquake, both would be fully functional.<br />
Table 6. Bear River fault system police station functionality<br />
Name<br />
City<br />
Functionality<br />
Day 1 Day 7 Day 30<br />
Uinta County Sheriff HQ Evanston 58.8% 82.2% 99.0%<br />
Evanston PD HQ Evanston 63.9% 85.5% 99.3%<br />
Mountain View PD HQ<br />
Mountain 96.9% 99.4% 99.9%<br />
View<br />
Uinta County Sheriff-Mountain Mountain 97.4% 99.5% 99.9%<br />
View Substation<br />
View<br />
Lyman PD HQ Lyman 98.5% 99.7% 99.9%<br />
Wyoming Multi-Hazard Mitigation Plan 6.9 June 2011
Schools<br />
There are 17 school buildings vulnerable to damage from the earthquake (Table 8).<br />
As with other essential facilities, schools in the Evanston area would experience the most<br />
shaking and highest probability of damage, while schools in Mountain View and Lyman<br />
would have a small probability of damage. Of the Evanston schools, Aspen Elementary<br />
would experience the strongest shaking (22%g), while North Evanston Elementary would<br />
experience slightly weaker ground motion (19%g). School buildings in Evanston would<br />
have a 30-50% chance of at least slight damage and a 2-20% chance of at least moderate<br />
damage. All the schools in Evanston would experience very strong ground motions while<br />
those in Mountain View, Ft Bridger, and Lyman would experience moderate shaking.<br />
Table 7. Bear River fault system school building damage probability<br />
Name<br />
City<br />
PGA<br />
Damage<br />
(%g) Slight Moderate Extensive<br />
Aspen Elem. Evanston 21.60% 44.36% 19.38% 1.13%<br />
Wyoming State Hospital Evanston 21.44% 45.81% 21.94% 4.72%<br />
Uinta Meadows Elem. Evanston 20.64% 41.03% 17.10% 0.90%<br />
Evanston Middle School Evanston 20.24% 39.74% 16.27% 0.82%<br />
Evanston High School Evanston 20.16% 39.75% 16.27% 0.82%<br />
Davis Middle School Evanston 19.76% 38.30% 15.35% 0.74%<br />
Horizon Alt. School Evanston 19.48% 29.13% 1.92% 0.01%<br />
Clark Elementary Evanston 19.24% 36.20% 14.05% 0.63%<br />
North Evanston<br />
Evanston 19.00% 41.06% 21.38% 9.76%<br />
Elementary<br />
Mountain View High Mountain 9.20% 3.03% 0.44% 0.00%<br />
School<br />
View<br />
Mountain View Elementary Mountain 9.20% 3.03% 0.44% 0.00%<br />
View<br />
Mountain View Middle Mountain 9.20% 3.03% 0.44% 0.00%<br />
School<br />
View<br />
Ft. Bridger Elementary Ft. Bridger 9.20% 3.03% 0.44% 0.00%<br />
Urie Elementary Lyman 8.88% 2.76% 0.39% 0.00%<br />
Lyman High School Lyman 8.44% 1.53% 0.18% 0.00%<br />
Lyman Middle School Lyman 8.32% 1.94% 0.25% 0.00%<br />
Lyman Elementary Lyman 8.32% 1.91% 0.24% 0.00%<br />
Table 9 shows the functionality of the schools in Evanston the day of the earthquake<br />
to be between 54 and 71%. The functionality would increase to about 80% by day 7, and<br />
within a month the schools would be fully functional again. The schools outside Evanston<br />
show high functionality the day of the earthquake.<br />
Table 8. Bear River fault system school building functionality<br />
Name<br />
City<br />
Functionality<br />
Day 1 Day 7 Day 30<br />
Wyoming State Hospital Evanston 54.1% 77.5% 95.2%<br />
Aspen Elem. Evanston 55.6% 80.0% 98.8%<br />
Uinta Meadows Elem. Evanston 58.9% 82.3% 99.0%<br />
North Evanston Elementary Evanston 58.9% 78.1% 90.2%<br />
Evanston High School Evanston 60.2% 83.1% 99.1%<br />
Wyoming Multi-Hazard Mitigation Plan 6.10 June 2011
Evanston Middle School Evanston 60.2% 83.1% 99.1%<br />
Davis Middle School Evanston 61.6% 84.1% 99.2%<br />
Clark Elementary Evanston 63.7% 85.4% 99.3%<br />
Horizon Alt. School Evanston 70.8% 97.4% 99.9%<br />
Mountain View High School Mountain 96.9% 99.4% 99.9%<br />
View<br />
Ft. Bridger Elementary Ft. Bridger 96.9% 99.4% 99.9%<br />
Mountain View Elementary Mountain 96.9% 99.4% 99.9%<br />
View<br />
Mountain View Middle Mountain 96.9% 99.4% 99.9%<br />
School<br />
View<br />
Urie Elementary Lyman 97.2% 99.5% 99.9%<br />
Lyman Middle School Lyman 98.0% 99.6% 99.9%<br />
Lyman Elementary Lyman 98.0% 99.7% 99.9%<br />
Lyman High School Lyman 98.4% 99.7% 99.9%<br />
Economic loss<br />
The modeled earthquake on the Bear River fault system would cause a total economic<br />
loss of 87 million dollars for the region. Direct economic losses are estimated in three<br />
categories: buildings, transportation, and utilities. Information about direct economic loss for<br />
each of the three categories can be found in the Bear Fiver Fault System folder located in<br />
Appendix B.<br />
Buildings<br />
Direct economic losses for buildings, which include structural and content damage,<br />
would total 64.448 million dollars for the region. Uinta County would experience the most<br />
damage at 64.447 million, while Sweetwater County would have about a thousand dollars in<br />
direct economic loss for buildings. Lincoln County would not be expected to suffer any<br />
direct economic loss from building damage.<br />
Transportation<br />
Lincoln and Sweetwater Counties would not be expected to have any direct economic<br />
losses for transportation systems. Uinta County would experience a direct economic loss of<br />
2.451 million dollars. The losses reflect damage to highways, bridges, and railways.<br />
Utilities<br />
The regional direct economic loss for utilities would be 20.872 million dollars.<br />
Lincoln County would account for 45 thousand dollars of damage to potable water, waste<br />
water, and natural gas pipelines. Sweetwater County would account for 44 thousand dollars<br />
in damage to the same infrastructure. As seen in the two previous categories, Uinta County<br />
would account for the greatest economic loss. The direct economic loss for utilities in Uinta<br />
County would be 20.782 million dollars. Potable water, waste water, and natural gas<br />
Wyoming Multi-Hazard Mitigation Plan 6.11 June 2011
pipelines would suffer damage, waste water, natural gas, and communication facilities would<br />
also likely be damaged.<br />
[*Wyoming Geological Survey Office – 2011]<br />
History<br />
A detailed description of all earthquakes in Wyoming can be found on a website at<br />
http://www.wrds.uwyo.edu/wrds/wsgs/hazards/quakes/seischar/seischar.html. The<br />
earthquake history of Wyoming is only 130 years, and there are gaps in the record for the late<br />
19 th Century and first half of the 20 th Century. After the Hebgen Lake earthquake in 1959,<br />
however, monitoring in Wyoming started to improve. Prior to the 1950s, most earthquakes<br />
were detected and located by personal reports. After the 1950s, earthquakes were more<br />
commonly located by seismometers.<br />
Earthquakes have many measures, with magnitudes and intensities being the most common.<br />
Magnitudes are instrumentally determined measures of the amount of energy released during<br />
an earthquake. Each one step increase in magnitude is roughly equivalent to a release of 32<br />
times more energy. Intensities are a subjective measure of how an earthquake was felt. As a<br />
result, an earthquake with a single magnitude can have much intensity associated with it,<br />
depending on the distance an observer is from the earthquake source and the response of<br />
surficial materials. An abbreviated intensity scale is presented in Table 6.1.<br />
Minor structural damage or damage to objects on walls or shelves does not occur until<br />
intensity V is reached. It is more difficult to determine at what magnitude damage may occur,<br />
as the orientation of a fault plane, the depth of the rupture on the fault, the bedrock, and<br />
surficial sediments all affect the transmission and attenuation of seismic waves. An<br />
attenuated seismic history of Wyoming, including earthquakes with intensities of V or<br />
greater, magnitudes of 5.0 or greater, or earthquakes with smaller assigned intensities or<br />
magnitudes that did cause some type of damage is presented in Table 6.2.<br />
Wyoming Multi-Hazard Mitigation Plan 6.12 June 2011
Table 6.1—Abridged Modified Mercalli Intensity Scale.<br />
Intensity<br />
I<br />
II<br />
III<br />
IV<br />
V<br />
VI<br />
VII<br />
VIII<br />
IX<br />
X<br />
XI<br />
XII<br />
Intensity description<br />
Not felt except by a very few under especially favorable circumstances.<br />
Felt only by a few persons at rest on upper floors of buildings. Delicately suspended objects may swing.<br />
Felt noticeably indoors, especially on upper floors. Standing automobiles rock slightly. Vibration like passing truck.<br />
During the day felt indoors by many, outdoors by few. Dishes, windows, doors disturbed; walls make creaking<br />
sound. Sensation like heavy truck striking building. Standing automobiles rocked noticeably.<br />
Felt by nearly everyone, many awakened. Some dishes and windows broken; cracked plaster in a few places;<br />
unstable objects overturned. Pendulum clocks may stop.<br />
Felt by all, many frightened and run outdoors. Some heavy furniture moved; a few instances of fallen plaster and<br />
damaged chimneys. Damage slight.<br />
Everybody runs outdoors. Damage minor in buildings of good design and construction; slight to moderate in wellbuilt<br />
ordinary structures; considerable in poorly built structures; some chimneys broken. Noticed by persons driving<br />
cars.<br />
Damage slight in specially designed structures; considerable in ordinary buildings with partial collapse; great in<br />
poorly built structures. Chimneys and walls fall. Heavy furniture overturned. Well water changes. Persons driving<br />
cars disturbed.<br />
Damage considerable in specially designed structures; frame structures thrown out of plumb; great in substantial<br />
buildings, with partial collapse. Buildings shifted off foundations. Ground cracked conspicuously. Underground<br />
pipes broken.<br />
Some well-built wooden structures destroyed; most masonry and frame structures destroyed; ground badly<br />
cracked. Rails bent. Landslides considerable from river banks and steep slopes. Shifted sand and mud.<br />
Few (masonry) structures remain. Bridges destroyed. Broad fissures in ground. Underground pipelines completely<br />
out of service. Earth slumps and land slips in soft ground. Rails bent greatly.<br />
Damage total. Waves seen on ground surface. Lines of sight and level distorted. Objects thrown into the air.<br />
Wyoming Multi-Hazard Mitigation Plan 6.13 June 2011
Table 6.2—History Of Damaging Or Potentially Damaging Earthquakes In Wyoming.<br />
Start Date Location Magnitude Intensity Info<br />
11/7/1882 Laramie to Estes Park Area 6.2 – 6.6 VII Felt over most of Colorado, the southern half of Wyoming, and northeastern<br />
Utah. In Laramie, clocks were stopped, plaster was cracked, and some glass in<br />
windows was broken.<br />
2/20/1893 Yellowstone National Park (YNP) VIII-IX There had been a series of earthquakes in the Park for a few weeks previous to<br />
a February 23, 1893 report. The main road south of Norris Geyser basin caved<br />
in for a long distance. In one area there was a gap 75 feet wide and several<br />
hundred feet in length. After the earthquakes, there was violent activity at the<br />
Giant, Giantess, and Great Castle geysers.<br />
6/25/1894 Natrona County, 3 miles southwest of<br />
Evansville<br />
V<br />
Residents on Casper Mountain reported that dishes rattled to the floor and<br />
people were thrown from their beds. Water in the Platte River changed from<br />
fairly clear to reddish, and became thick with mud due to the riverbanks<br />
slumping into the river during the earthquake.<br />
2/03/1897 Crook County, near Sundance IV-V Severely shook the Shober School on Little Houston Creek, southwest of<br />
Sundance.<br />
11/14/1897 Natrona County, 3 miles southwest of<br />
Evansville<br />
7/25/1910 Sweetwater County, Union Pacific No. 1<br />
Mine, Rock Springs<br />
VI-VII<br />
V<br />
It caused considerable damage to a few buildings. As a result of the earthquake,<br />
a portion of the Grand Central Hotel was cracked from the first to the third story.<br />
Some of the ceilings in the hotel were also severely cracked.<br />
Partial mine collapse. Not known if mine collapse generated the earthquake or if<br />
an earthquake with a tectonic source caused the mine to collapse.<br />
10/24/1922 Johnson County, 8 miles east of Sheridan V Houses were shaken and dishes were rattled near Sheridan.<br />
10/25/1922 Natrona County, 6 miles north-northeast of<br />
Barr Nunn<br />
3/24/1923 Teton County, 13 miles northeast of<br />
Jackson<br />
V<br />
V<br />
Dishes were rattled and hanging pictures were tilted near Salt Creek. Felt in<br />
Casper, Salt Creek, and Bucknum.<br />
Several shocks were felt, with the largest rocking buildings all over the county.<br />
The paper reported that “Rocks weighing tons were shaken loose along the<br />
Tetons and in the hills about Gros Vantre, and rolled into the valley.”<br />
12/12/1923 Fremont County, 3 miles northwest of<br />
V<br />
No significant damage was reported.<br />
Atlantic City<br />
6/21/1925 Teton County, Jackson area Earthquakes may have contributed to the destabilization of the lower Gros<br />
Ventre landslide on June 23, 1925. River was dammed.<br />
11/17/1925 Big Horn County, 12 miles north-northeast<br />
of Hyattville<br />
2/13/1928 Hot Springs County, 10 miles south of<br />
Thermopolis<br />
V<br />
IV<br />
The tremors shook cabins, pictures, and furniture. A “distinct roar” at Dome<br />
Lake was attributed to a possible earthquake-induced landslide. Felt in<br />
Sheridan, Fort McKenzie, and at Dome Lake Resort.<br />
Reports indicate that two men entered their mine near Bonneville when<br />
aftershocks were occurring and found that many of the mine props were so<br />
loose that they could be moved by hand.<br />
6/12/1930 Lincoln County, 9 miles southwest of Afton 5.8 VI Plaster walls, a brick building, and a swimming pool in the Grover area cracked.<br />
This event also stopped clocks on the west walls of buildings.<br />
Wyoming Multi-Hazard Mitigation Plan 6.14 June 2011
Table 6.2—History Of Damaging Or Potentially Damaging Earthquakes In Wyoming.<br />
Start Date Location Magnitude Intensity Info<br />
7/28/1930 Sweetwater County, near Rock Springs IV The earthquake awakened many residents, and merchandise on store shelves<br />
was disrupted. A portion of a coal mine near Reliance caved in during the<br />
disturbance. Whether the earthquake was due to the cave-in or to movement on<br />
a fault is not known.<br />
3/26/1932 Teton County, 4 miles northeast of Jackson VI The earthquake cracked plaster walls and foundations in several Jackson<br />
homes and businesses.<br />
8/25/1930 Central YNP V Threw dishes from shelves and obviously disturbed the water in Lewis Lake.<br />
11/23/1934 Fremont County, 20 miles northwest of<br />
Lander<br />
V<br />
In a 10-mile radius around Lander, there were reports that dishes were thrown<br />
from cupboards and pictures fell from walls. Buildings in two business blocks<br />
were cracked. The brick chimney of the Fremont County Courthouse moved two<br />
inches away from the building.<br />
5.0 VI Cracked plaster and chimneys at the Lake Hotel and rocked beds at Moran. Not<br />
felt in Jackson.<br />
V<br />
No significant damage was reported.<br />
1/14/1936 Teton County, 19 miles southwest of YNP<br />
south entrance<br />
2/25/1942 Goshen County, 3 miles north-northwest of<br />
Jay Em<br />
2/25/1942 Niobrara County, 18 miles south of Lusk V No significant damage was reported.<br />
8/5/1942 YNP – West Thumb Area V Dishes and windows were rattled.<br />
12/11/1942 Natrona County, 14 miles south of Midwest IV-V Felt in Casper, Salt Creek, and Glenrock.<br />
10/11/1944 Hot Springs County, 3 miles south of<br />
Thermopolis<br />
IV<br />
Rocks fell onto the highway in Wind River Canyon. At Hot Springs State Park,<br />
the south rim of the largest hot spring partially caved.<br />
4/21/1945 Yellowstone Lake Area V Shook bushes and trees and overturned vases and small objects.<br />
2/26/1946 Hot Springs County, 3 miles south of<br />
Thermopolis<br />
IV Rattled windows and dishes and clouded the water in Hot Springs State Park for<br />
days.<br />
4/14/1947 Converse County, LaPrelle Creek<br />
southwest of Douglas<br />
V<br />
Felt near LaPrelle Creek. Windows were rattled, chairs were moved, and<br />
buildings shook at a ranch.<br />
2/23/1948 Teton County, 13 miles west of Jackson 5.0 VI Some residents in the area reported that their houses rocked and swayed in an<br />
east-to-west direction. People also reported that dishes and windows rattled and<br />
pictures fell from walls. Some buildings in Jackson sustained cracked and<br />
twisted logs.<br />
1/23/1950 Hot Springs County, 22 miles northwest of<br />
V<br />
Houses shook and dishes rattled in the Hamilton Dome area.<br />
Thermopolis<br />
6/27/1950 North-central part of YNP VI Tourists ran from buildings, and knickknacks and groceries fell from shelves in<br />
West Yellowstone.<br />
1/20/1954 Albany County, 12 miles north-northeast of<br />
Laramie<br />
V<br />
Felt over 2000 square miles. In Laramie, a roaring noise was heard, and<br />
buildings shook and dishes fell from tables. At Fox Park doors and dishes were<br />
rattled, and a post supporting the roof of one house was shifted.<br />
1/31/1954 Hot Springs County, 3 miles south of V No significant damage was reported.<br />
Wyoming Multi-Hazard Mitigation Plan 6.15 June 2011
Table 6.2—History Of Damaging Or Potentially Damaging Earthquakes In Wyoming.<br />
Start Date Location Magnitude Intensity Info<br />
Thermopolis<br />
7/4/1954 YNP - Mammoth Area V Windows, doors, and dishes rattled and small objects moved.<br />
5/22/1955 Albany County, near Jelm and Woods<br />
V<br />
Dishes, windows, and cupboards were rattled in many cabins in the Woods<br />
Landing<br />
Landing area.<br />
12/21/1956 YNP - near Lake Hotel V Small objects were shifted and tress and bushes were shaken.<br />
1/5/1957 Converse, Esterbrook About 7 p.m. of the 5th a slight earth tremor was felt at Esterbrook and over an<br />
area approximately 12 - 15 miles long by 3 miles wide. Rumbling was heard<br />
and light movement reported by more than a dozen people living in widely<br />
separated sections of the area. Loud reports like thunder or roaring sounds<br />
were heard but no damage resulted.<br />
4/28/1958 YNP - near Old Faithful V Windows, doors, and dishes rattled and small objects moved.<br />
8/17/1959 Few miles northwest of West Yellowstone,<br />
Montana<br />
7.5 X Initiated a major landslide, which dammed the Madison River. The landslide<br />
generated a great blast of air that blew people about like leaves. 28 people were<br />
killed by the event. New fault scarps were noted near Hebgen Lake and many<br />
geysers were adversely affected.<br />
12/25/1959 Albany County, near Fox Park and Jelm 4.3 V Felt in Fox Park, Jelm, and Laramie. In Fox Park, slight cracks formed in a<br />
concrete block building under construction.<br />
4/21/1960 Near Hebgen Lake, Montana V Caused dishes to fall at West Yellowstone, and water to slosh over the sides of<br />
a fish bowl.<br />
8/26/1962 North-central part of YNP V Stopped pendulum clocks at Canyon and frightened many people.<br />
2/25/1963 Sublette County, 15 miles north-northeast of<br />
Big Sandy<br />
4.3 V Felt in Atlantic City, Lander, and Hudson. Windows, doors, and dishes were<br />
rattled in Fort Washakie as a result of the earthquake.<br />
3/8/1963 Northeastern YNP 3.8 VI Caused plaster to crack and fall at Canyon Village. Large cracks separated<br />
walls and ceilings in several houses.<br />
12/17/1963 YNP - Mammoth V Pictures and mirrors shifted.<br />
3/8/1963 Goshen County, 16 miles northeast of Jay<br />
V<br />
No significant damage was reported.<br />
Em<br />
3/28/1964 Niobrara County, 21 miles southeast of<br />
V<br />
No significant damage was reported.<br />
Lusk<br />
8/22/1964 Niobrara County, 17 miles northwest of<br />
4.5 V Concert attendees thought a furnace had exploded.<br />
Lusk<br />
9/10/1964 Sweetwater County, 30 miles west of<br />
Rawlins<br />
4.1 One Rawlins resident reported that the earthquake caused a crack in the<br />
basement of his home in Happy Hollow.<br />
10/21/1964 Hebgen Lake, Montana area 5.8 No significant damage was reported.<br />
Wyoming Multi-Hazard Mitigation Plan 6.16 June 2011
Table 6.2—History Of Damaging Or Potentially Damaging Earthquakes In Wyoming.<br />
Start Date Location Magnitude Intensity Info<br />
9/21/1970 Lincoln County, near the Elbow<br />
Campground in the Snake River Canyon<br />
12/8/1972 Hot Springs County, 8 miles west of<br />
Thermopolis<br />
4.4 At Camp Davis, a resident reported a figurine knocked off a television set and a<br />
“vibrating” staircase. Eleven miles south of Jackson, a resident reported rattling<br />
windows and a shaking bed. Near Bondurant, a resident reported that windows<br />
rattled and her whole house shook.<br />
4.1 V Caused two cracks in the ceiling of a new addition to a Thermopolis rest home,<br />
and the floor in a local lumberyard sank a few inches.<br />
4/22/1973 Fremont County, 12 miles north of Jeffrey 4.8 V Rattled dishes and disturbed pictures on walls in Jeffrey City.<br />
City<br />
7/16/1974 Hebgen Lake, Montana area 4.4 V Felt as intensity V at Norris Geyser Basin.<br />
8/30/1974 Central YNP 4.5 V Items fell of store shelves in West Yellowstone, and power lines behind the Old<br />
Faithful Inn bounced up and down.<br />
9/19/1974 Washakie County, 6 miles north-northwest 4.4 V Felt in Ten Sleep Canyon.<br />
of Ten Sleep<br />
3/25/1975 Fremont County, 18 miles northwest of<br />
Jeffrey City<br />
4.8 II A mobile home located 35 miles southeast of Riverton was moved an inch off its<br />
foundation by this earthquake.<br />
6/30/1975 Central YNP 6.4 VII Landslides closed 12 miles of road between Norris Junction and Madison<br />
Junction for almost a day. 3 to 4 foot deep cracks, 15-20 feet long were found in<br />
the Virginia Cascades area.<br />
1/27/1976 Carbon County, 12 miles north of Rawlins 2.2 V Reports from the Park Drive area in Rawlins indicated that dishes were rattled,<br />
pictures fell from walls, lamps were knocked off tables, and one wall in a<br />
residence was reportedly cracked.<br />
9/2/1976 Johnson County, 33 miles northeast of<br />
4.8 IV-V No significant damage was reported.<br />
Kaycee<br />
12/9/1976 Northwestern YNP 5.1 V Caused small objects to fall at Canyon Village and caused turbidity in the<br />
Gibbon River.<br />
12/19/1976 Northwestern YNP 4.9 VI Christmas decorations and household items were knocked to the floor and<br />
cracked windows at Mammoth.<br />
3/3/1977 Carbon County, 18.5 miles west-northwest 4.2 V Doors and dishes were rattled in southern Carbon County homes.<br />
of Encampment<br />
3/1/1982 West of Freedom in eastern Idaho 3.6 V Felt as intensity IV in Freedom, Etna, and Thayne.<br />
2/6/1983 Central YNP 4.7 V Intensity V at Old Faithful. Overturned small objects. Water level in Gention Pool<br />
dropped 30 inches.<br />
2/8/1983 12 miles northwest of Alpine in Idaho 4.4 V Snow avalanches in some areas were initiated. Felt as intensity IV in Etna and<br />
Teton Village.<br />
12/20/1983 Teton County, 10 miles south of Jackson 4.5 IV In Jackson, there were reports of Christmas trees falling over and dishes<br />
breaking. Felt from Jackson to Palisades Reservoir.<br />
5/29/1984 Campbell County, 24 miles west-southwest<br />
of Gillette<br />
5.0 V Felt in Gillette, Sheridan, Buffalo, Casper, Douglas, Thermopolis, and<br />
Sundance. Pictures were shaken from the walls of a ranch house 35 miles west<br />
Wyoming Multi-Hazard Mitigation Plan 6.17 June 2011
Table 6.2—History Of Damaging Or Potentially Damaging Earthquakes In Wyoming.<br />
Start Date Location Magnitude Intensity Info<br />
9/7/1984 Johnson County, 33 miles east-southeast of<br />
Buffalo<br />
10/18/1984 4 miles west-northwest of Toltec in northern<br />
Albany County<br />
11/3/1984 Fremont County, 10 miles northwest of<br />
Atlantic City<br />
of Gillette.<br />
5.1 V Felt throughout northeastern Wyoming.<br />
5.5 VI Felt in Wyoming, South Dakota, Nebraska, Colorado, and Utah. Cracks were<br />
found in the exterior brick walls of the Douglas City Hall and a public school in<br />
Medicine Bow. Chimneys were cracked at Casper, Douglas, Guernsey, Lusk,<br />
and Rock River.<br />
5.1 VI Felt in Lander, Dubois, Altantic City, and Casper. Residents in Lander and<br />
Atlantic City reported cracked walls, foundations, and windows.<br />
8/21/1985 Lincoln County, 10 miles east of Alpine 4.8 V Felt as intensity V in Alpine. The Teton County Sheriff’s Department reported<br />
that the earthquake caused a motorist to drive off the highway in the Snake<br />
River Canyon.<br />
8/30/1985 Lincoln County, 7 miles east of Alpine 4.3 V Felt as intensity V in Alpine.<br />
9/6/1985 Lincoln County, 15 miles east-southeast of<br />
Alpine<br />
4.6 V Felt as intensity V in Alpine and as intensity IV in Wilson. An earthquakeinduced<br />
landslide temporarily closed a portion of U.S. Highway 89 in the Snake<br />
River Canyon.<br />
11/13/1988 Lincoln County, near Smoot, south of Afton 4.0 V Felt as intensity V in Smoot and as intensity IV in Afton and Fairview.<br />
7/20/1992 YNP - Near Lake Hotel 3.9 V Many guests were awakened and some packed up and left the area.<br />
11/1/1992 Niobrara County, southeast of Lusk 3.0 V No significant damage was reported.<br />
11/10/1992 Eastern Idaho 4.8 V Felt as intensity V at Alpine and Grover.<br />
11/10/1992 Eastern Idaho 4.7 V Felt as intensity V in Grover.<br />
12/28/1993 Teton County, 34 miles east of Jackson 4.7 V Most reports indicated that the earthquake felt like a heavy truck passing by. A<br />
ranch near the epicenter reported swinging lights, but no damage.<br />
2/2/1994 Draney Peak, ID area 4.0 V Felt as intensity V at Afton and Freedom.<br />
2/3/1994 Draney Peak, ID 5.9 VII At the Auburn Fish Hatchery, located just into Idaho, near Auburn, Wyoming,<br />
one wall separated from the roof of the facility. In addition, one home near<br />
Auburn had cracks in both the foundation and ceiling. The earthquake also<br />
shook dishes off shelves and clocks off walls in Afton and surrounding<br />
communities. Felt in Rock Springs and Salt Lake City. Thousands of aftershocks<br />
followed.<br />
2/11/1994 Draney Peak area, ID 5.3 In Grover, a resident reported that his house had been damaged to the point<br />
where a front door would not close. There was also a report from Grover that a<br />
set of concrete steps had pulled away from a house. In Afton, cracks appeared<br />
in the walls of some homes. In Fairview, there were reports of lamps tipped<br />
over.<br />
4/7/1994 Draney Peak area, ID 5.2 No significant damage was reported.<br />
Wyoming Multi-Hazard Mitigation Plan 6.18 June 2011
Table 6.2—History Of Damaging Or Potentially Damaging Earthquakes In Wyoming.<br />
Start Date Location Magnitude Intensity Info<br />
2/3/1995 Sweetwater County, near Little America 5.3 V Collapse of a 3,000-foot wide by 7,000-foot long portion of a trona mine<br />
operated by the Solvay Minerals, Inc. One miner lost his life as a result of the<br />
collapse. Minor damage was reported at a school administration building in<br />
Green River and at a motel near Little America.<br />
2/28/1995 Lincoln County, 17 miles south- southwest<br />
of Afton<br />
4.0 V Felt as intensity V in Afton and intensity IV in Smoot.<br />
8/27/1995 Teton County, vicinity of Joy Park and Enos<br />
Lake<br />
4.5 At Flagg Ranch, there were reports of buildings vibrating and dishes rattling. At<br />
Grant Village, the event was felt for 10-15 seconds, and a few items fell off the<br />
shelves at the Hamilton Store.<br />
5/16/1996 Eastern Idaho, 20 miles southwest of Afton 4.3 V Felt as intensity IV in Afton.<br />
4/25/1997 Fremont County, 10 miles south of Lander 3.1 Lander city officials reported that the earthquake may have caused a crack in<br />
the city’s water tank, releasing 600,000 gallons of water.<br />
4/5/1999 Carbon County, 29 miles north-northwest of<br />
Baggs<br />
4.3 Residents of Rawlins reported that pictures fell off walls, and a ranch house 30<br />
miles north of Baggs, reported that cinder block walls in the basement of the<br />
home cracked and separated. A motel and associated residence in Wamsutter<br />
also suffered cracks in the cinderblock walls in the basement.<br />
1/7/2004 Teton County, east of Kelley 5.0 IV The non-damaging earthquake occurred east of Kelly, about 3 miles southeast<br />
of lower Slide Lake. The earthquake was felt for 6 seconds. The earthquake<br />
was followed by magnitude 3.7, 4.1, and 4.0 events.<br />
Wyoming Multi-Hazard Mitigation Plan 6.19 June 2011
Earthquake Potential<br />
The earthquake history above does not give a complete picture of the earthquake potential in<br />
Wyoming. As mentioned previously, the history is only 130 years, and cannot reflect all possible<br />
earthquakes or earthquake sources in Wyoming. The exposed active faults mentioned above have<br />
all been modeled to determine what effects they may have on the areas around them if they<br />
activate. A detailed analysis of the potential effects of the faults can be obtained at<br />
http://www.wrds.uwyo.edu/wrds/wsgs/hazards/quakes/seischar/seischar.html.<br />
One of the primary tools used in modeling the effects of earthquakes on regions or states are<br />
probabilistic acceleration maps generated by the U.S. Geological Survey (USGS). The USGS<br />
publishes probabilistic acceleration maps for 500-, 1000-, and 2500-year time frames. The maps<br />
show what accelerations may be met or exceeded in those time frames by expressing the<br />
probability that the accelerations will be met or exceeded in a shorter time frame. For example, a<br />
10% probability that acceleration may be met or exceeded in 50 years is roughly equivalent to a<br />
100% probability of exceedance in 500 years.<br />
The USGS recently generated new probabilistic acceleration maps for Wyoming. The maps are<br />
for 500-year (10% probability of exceedance in 50 years), 1000-year (5% probability of<br />
exceedance in 50 years), and 2500-year (2% probability of exceedance in 50 years) periods.<br />
Until recently, the 500-year map was often used for planning purposes for average structures,<br />
and was the basis of the most current Uniform Building Code. The new International Building<br />
Code, however, uses a 2500-year map as the basis for building design. The 2500-year map was<br />
updated in 2008 and is shown in Figure 6.3. The maps reflect current perceptions on seismicity<br />
in Wyoming. In many areas of Wyoming, ground accelerations shown on the USGS maps can be<br />
increased due to local soil conditions. For example, if fairly soft, saturated sediments are present<br />
at the surface, and seismic waves are passed through them, surface ground accelerations will<br />
usually be greater than would be experienced if only bedrock was present. In this case, the<br />
ground accelerations shown on the USGS maps would underestimate the local hazard, as they<br />
are based upon accelerations that would be expected if firm soil or rock were present at the<br />
surface. Intensity values can be found in Table 6.4.<br />
A comparison between the 2500-year probabilistic acceleration map and the above intensity<br />
chart indicates that the largest intensity earthquake expected in Wyoming could be Intensity IX.<br />
The Jackson area could have an Intensity VIII to IX earthquake, as could Star Valley, or parts of<br />
Uinta County. Parts of central Wyoming could have earthquakes with intensities as large as VII.<br />
Wyoming Multi-Hazard Mitigation Plan 6.20 June 2011
http://earthquake.usgs.gov/earthquakes/states/wyoming/hazards.php Accessed 1/26/2011<br />
Figure 6.3—2500-Year Probabilistic Acceleration Map of Wyoming.<br />
Table 6.4—Modified Mercalli Intensity and Peak Ground Acceleration (PGA).<br />
Modified Mercalli Acceleration (%g) Perceived<br />
Intensity<br />
(PGA)<br />
Shaking<br />
Potential Damage<br />
I 124 Extreme Very Heavy<br />
XI >124 Extreme Very Heavy<br />
XII >124 Extreme Very Heavy<br />
Reference: Wald, et al 1999.<br />
Wyoming Multi-Hazard Mitigation Plan 6.21 June 2011
Assessments of Potential Earthquake Damage<br />
Hazards U.S. (HAZUS) is nationally standardized, geographic information systems (GIS)-based,<br />
risk assessment and loss estimation computer program originally designed in 1997 to provide the<br />
user with an estimate of the type, extent, and cost of damages and losses that may occur during<br />
and following an earthquake. HAZUS was developed for the Federal Emergency Management<br />
Agency (FEMA) by the National Institute of Building Sciences (NIBS). There have been a<br />
number of versions of HAZUS generated by FEMA, with HAZUS Multi-Hazard (HAZUS-MH)<br />
being the most recent release. HAZUS-MH incorporates a flood and wind module with the<br />
previously existing earthquake module.<br />
HAZUS was originally designed to generate damage assessments and associated ground motions<br />
based largely upon analysis at the census-tract level. Census tracts average 4000 inhabitants,<br />
with the tract boundaries usually representing visible features. HAZUS-99 calculated a ground<br />
motion value for the centroid of a census tract and applied that value to the entire tract. The<br />
calculations are based on USGS National Seismic Hazard Maps. In many of the western states,<br />
census tracts are very large, and parts of the tracts may be subjected to ground shaking that is<br />
considerably different than the value at the centroid. In 2003 and 2004, FEMA Region VIII and<br />
their subcontractor on HAZUS, PBS&J from Atlanta, have worked closely with the State of<br />
Wyoming to develop a census-block-based analysis for HAZUS-MH in Wyoming. Census<br />
blocks are a subdivision of census tracts. Many blocks correspond to individual city blocks<br />
bounded by streets, but blocks—especially in rural areas—may include many square miles and<br />
may have some boundaries that are not streets. Ground motion values for Wyoming can now be<br />
calculated at the centroid of census blocks.<br />
The results of the HAZUS-MH analysis for each county are presented in Table 6.5. There are<br />
two methods of ranking counties to determine where earthquake impacts may be the greatest.<br />
Either the loss ratios (Table 6.6) or total damage (Table 6.7) figures can be used. The loss ratio<br />
is determined by dividing the sum of the structural and non-structural damage by the total<br />
building value for the county. The loss ratio is a better measure of impact for a county as it gives<br />
an indication of the percent of damage to buildings. The total damage figure by itself does not<br />
reflect the percentage of building damage. If a county has a number of valuable buildings, such a<br />
Laramie County, small damage to a number of valuable buildings may result in a higher total<br />
damage figure that may be found in a county with fewer, less expensive buildings with a higher<br />
percentage of damage.<br />
Local mitigation plans utilize information provided by the State Multi-Hazard Mitigation Plan,<br />
and reflect little-to-no additional information regarding estimated potential losses. Statewide,<br />
HAZUS-MH analyses have been generated using both a census-tract and a census block method<br />
of analysis. The statewide results of both methods of analysis for building damage (structural<br />
and non-structural) are presented below:<br />
Statewide Building Damage - Census Block Analysis: $2,436,291,000<br />
Statewide Building Damage - Census Tract Analysis: $2,054,470,000<br />
Wyoming Multi-Hazard Mitigation Plan 6.22 June 2011
County<br />
Capital Stock Losses<br />
(Thousands of Dollars)<br />
Table 6.5—HAZUS-MH Summaries for Wyoming Counties.<br />
Loss<br />
Ratio<br />
(%)<br />
Income Losses<br />
(Thousands of Dollars)<br />
Total Loss<br />
(Thousands<br />
of Dollars)<br />
Nonstructurarelated<br />
Capital-<br />
Structural<br />
Contents Inventory Relocation<br />
Wages Rental Loss<br />
Albany 9,714 36,865 13,946 151 2.32 276 2,717 3,198 4,210 71,078<br />
Big Horn 3,470 12,203 4,647 65 2.43 84 533 694 963 22,660<br />
Campbell 5,116 20,093 9,419 282 1.37 144 1,484 2,013 1,592 40,144<br />
Carbon 7,140 26,320 10,480 170 3.08 190 2,120 2,700 1,810 50,920<br />
Converse 6,054 24,172 9,787 185 4.15 152 984 1,303 1,845 44,482<br />
Crook 836 2,640 896 17 1.04 21 107 139 211 4,867<br />
Fremont 14,890 61,030 24,640 460 3.75 380 2,920 3,940 3,190 111,450<br />
Goshen 2,168 6,982 2,543 69 1.13 57 392 528 623 13,364<br />
Hot Springs 3,038 10,871 4,176 52 4.20 82 799 1,149 969 21,136<br />
Johnson 3,293 13,062 5,514 94 3.40 86 557 648 1,066 24,320<br />
Laramie 13,605 47,839 17,577 233 1.25 406 3,926 4,402 4,976 92,963<br />
Lincoln 65,670 225,594 64,429 2,538 31.08 1,211 8,579 10,359 15,347 391,727<br />
Natrona 36,764 137,379 57,269 1,149 3.99 981 9,890 13,033 12,245 268,911<br />
Niobrara 423 1,585 617 12 1.20 12 72 83 132 2,935<br />
Park 11,430 42,694 15,289 429 2.98 285 5,173 6,217 4,487 86,004<br />
Platte 1,875 6,894 2,697 36 1.60 51 326 418 554 12,850<br />
Sheridan 7,830 29,154 12,057 233 2.09 213 1,898 2,402 2,636 56,423<br />
Sublette 9,654 30,667 9,436 222 8.24 206 2,438 3,052 2,665 58,340<br />
Sweetwater 12,782 50,213 20,753 542 2.84 313 2,180 2,514 3,719 93,017<br />
Teton 92,477 359,169 110,323 2,402 24.72 1,821 37,784 43,975 34,030 681,981<br />
Uinta 39,912 135,111 38,841 1,007 15.84 782 5,888 8,741 11,004 241,284<br />
Washakie 4,115 13,761 5,656 134 3.54 99 904 1,019 1,236 26,925<br />
Weston 897 3,016 1,085 21 0.96 26 147 266 302 5,760<br />
Wyoming Multi-Hazard Mitigation Plan 6.23 June 2011
Table 6.6—County Impacts Rated by<br />
Loss Ratio.<br />
County<br />
Loss<br />
ratio<br />
Total loss<br />
(thousands of dollars)<br />
Lincoln 31.08 391,727<br />
Teton 24.72 681,981<br />
Uinta 15.84 241,284<br />
Sublette 8.24 58,340<br />
Hot Springs 4.20 21,136<br />
Converse 4.15 44,482<br />
Natrona 3.99 268,911<br />
Fremont 3.75 111,450<br />
Washakie 3.54 26,925<br />
Johnson 3.40 24,320<br />
Carbon 3.08 50,920<br />
Park 2.98 86,004<br />
Sweetwater 2.84 93,017<br />
Big Horn 2.43 22,660<br />
Albany 2.32 71,078<br />
Sheridan 2.09 56,423<br />
Platte 1.60 12,850<br />
Campbell 1.37 40,144<br />
Laramie 1.25 92,963<br />
Niobrara 1.20 2,935<br />
Goshen 1.13 13,364<br />
Crook 1.04 4,867<br />
Weston 0.96 5,760<br />
Table 6.7—County Impacts Rated by<br />
Dollar Loss.<br />
County<br />
Total loss<br />
Loss<br />
(thousands of<br />
ratio<br />
dollars)<br />
Teton 681,981 24.72<br />
Lincoln 391,727 31.08<br />
Natrona 268,911 3.99<br />
Uinta 241,284 15.84<br />
Fremont 111,450 3.75<br />
Sweetwater 93,017 2.84<br />
Laramie 92,963 1.25<br />
Park 86,004 2.98<br />
Albany 71,078 2.32<br />
Sublette 58,340 8.24<br />
Sheridan 56,423 2.09<br />
Carbon 50,920 3.08<br />
Converse 44,482 4.15<br />
Campbell 40,144 1.37<br />
Washakie 26,925 3.54<br />
Johnson 24,320 3.4<br />
Big Horn 22,660 2.43<br />
Hot Springs 21,136 4.2<br />
Goshen 13,364 1.13<br />
Platte 12,850 1.6<br />
Weston 5,760 0.96<br />
Crook 4,867 1.04<br />
Niobrara 2,935 1.2<br />
Regional Impacts of Earthquakes<br />
Using the loss ratios in Table 6.6, Lincoln, Teton, Uinta, and Sublette counties would have the<br />
most significant impact from earthquakes. This is consistent with probabilistic acceleration<br />
maps, and projected damage potential from exposed active fault models. Total dollar loss in<br />
those counties is projected to be nearly $1.4 billion.<br />
The second most impacted areas would be Hot Springs, Converse, Natrona, Fremont, Washakie,<br />
Johnson, Carbon, Park, and Sweetwater counties. Total dollar loss in those counties is projected<br />
to be just over $657.4 million.<br />
The third most impacted areas would be Big Horn, Albany, Sheridan, Platte, and Campbell<br />
counties. Total dollar loss in those counties is projected to be about $203.2 million.<br />
Wyoming Multi-Hazard Mitigation Plan 6.24 Draft Plan 2011
The counties with the least impact would be Laramie, Niobrara, Goshen, Crook, and Weston<br />
counties. Total dollar loss in those counties is projected to be almost $119.9 million. This is<br />
consistent with probabilistic acceleration maps, and projected damage potential from exposed<br />
active fault models.<br />
Local Mitigation Plan Risk Assessments<br />
A review of the local plans reflects they have utilized the most accurate earthquake data<br />
available at the time their plan was written, provided through HAZUS in 2004. Most also utilize<br />
maps contained within the Wyoming State Multi-Hazard Mitigation Plan. In February, 2011<br />
each county was offered information in draft form. The information provided utilized HAZUS<br />
estimates in scenario-based calculations. It is anticipated the HAZUS data will be finalized soon.<br />
It is assumed those counties impacted by potential earthquake hazards in Wyoming (most<br />
counties) will utilize, in their next local plan, this best available data.<br />
Below is a table outlining information mined from the local plans’ earthquake hazard<br />
information. The table outlines the local perspective on earthquake risk within the county,<br />
ranking it from high to low, based on three areas of concern in the local plan: population<br />
impacted, probability of occurrence within their borders, and property impacted.<br />
When compared to the percentage of population increase in the state it is noted those counties in<br />
zones where earthquakes are most prevalent, the western part of the state, are experiencing some<br />
of the most significant growth. This would indicate earthquake hazards do not appear to<br />
significantly modify growth patterns within Wyoming. It would also lead one to draw the<br />
conclusion that in the event of a significant earthquake, those counties experiencing greater<br />
growth within their boundaries will have greater need of critical infrastructure like hospitals,<br />
police and fire departments, which are likely to be operating at a decreased capacity. The draw<br />
on critical infrastructure from surrounding areas may also be taxed.<br />
However, when compared to the overall risk table, found in Chapter 3, which is based on<br />
population composition and density, the areas in the west tend to be populated by those better<br />
able to address the demands of an emergency because of the low density and greater resilience of<br />
the population (see p.6.28 and 6.29).<br />
Wyoming Multi-Hazard Mitigation Plan 6.25 Draft Plan 2011
Proposed State Mitigation Projects<br />
The following mitigation projects have been proposed by state, federal, and local entities in the<br />
process of generating the Wyoming Multi-Hazard Mitigation Plan. Chapter 22 has all proposed<br />
mitigation projects.<br />
• Conduct HAZUS analyses to determine effects building code adoption may have<br />
on reducing loss estimates.<br />
• Conduct study on phasing in of earthquake provisions of code for state funded<br />
and/or inspected buildings.<br />
• Development of enhanced soil layer for use in HAZUS.<br />
• Study on retrofit feasibility of government owned buildings, essential facilities,<br />
culverts, and bridges.<br />
• Retrofit government owned buildings, essential facilities, culverts, and bridges.<br />
• Analysis of pipeline crossings with active faults.<br />
• Education on earthquakes and on seismic provisions of the building code.<br />
• Analysis of effects of earthquakes on public buildings and shelters.<br />
• Retrofit State Capitol and Herschler Building.<br />
• Provide all-hazards weather radios to all residences in Wyoming.<br />
• Identify and inspect shelters in hazard prone areas.<br />
• Research feasibility and costs of adding new frontage roads /detour routes to I-<br />
80, I-90, and I-25 to prevent significant delay in traffic flow and resultant<br />
Wyoming Multi-Hazard Mitigation Plan 6.26 Draft Plan 2011
economic loss and possible loss of life.<br />
• Provide hazards information to shelters, emergency facilities in public buildings,<br />
campgrounds, and phone books.<br />
• Provide emergency phones at strategic locations with direct lines to emergency<br />
dispatch services.<br />
• Develop reseeding plans for losses due to all hazard events.<br />
• GIS training for local jurisdictions with emphasis on hazards recognition and<br />
analysis for application to mitigation planning.<br />
• Investigate opportunities for developing or improving warning systems as a<br />
means to reduce loss of life, damage to property, and economic losses.<br />
• Education programs encompassing multi-hazard insurance for business, resident<br />
and government application.<br />
• Education programs encompassing multi-hazard mitigation for business, resident<br />
and government application.<br />
• Planning studies regarding transportation of essential and/or key personnel<br />
during all hazard events<br />
• Continue outreach to counties on identifying cost effective and feasible<br />
mitigation projects.<br />
• Promote Continuity of Operations and Continuity of Government, statewide.<br />
• Maintain and continue to expand hazards databases that were generated for the<br />
State Hazard Mitigation Plan. Seek new sources of information.<br />
• Identify, document, and advertise all volunteer agency’s locations and contact<br />
information.<br />
Reference Cited<br />
Wald, D.J., Quitoriano, V., Heaton, T., Kanamori, H., 1999, Relationships between peak ground<br />
acceleration, peak ground velocity, and modified Mercalli intensity in California:<br />
Earthquake Spectra, v. 15, no. 3, p. 557-564.<br />
Wyoming Multi-Hazard Mitigation Plan 6.27 Draft Plan 2011