Supercapacitors - PIRG
Supercapacitors - PIRG
Supercapacitors - PIRG

You also want an ePaper? Increase the reach of your titles
YUMPU automatically turns print PDFs into web optimized ePapers that Google loves.
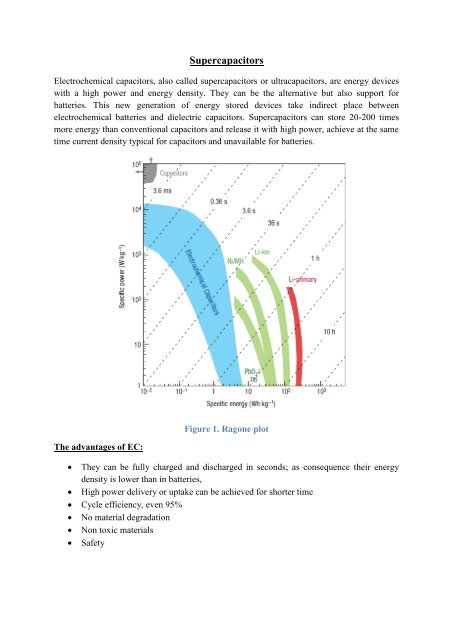
<strong>Supercapacitors</strong><br />
Electrochemical capacitors, also called supercapacitors or ultracapacitors, are energy devices<br />
with a high power and energy density. They can be the alternative but also support for<br />
batteries. This new generation of energy stored devices take indirect place between<br />
electrochemical batteries and dielectric capacitors. <strong>Supercapacitors</strong> can store 20-200 times<br />
more energy than conventional capacitors and release it with high power, achieve at the same<br />
time current density typical for capacitors and unavailable for batteries.<br />
Figure 1. Ragone plot<br />
The advantages of EC:<br />
They can be fully charged and discharged in seconds; as consequence their energy<br />
density is lower than in batteries,<br />
High power delivery or uptake can be achieved for shorter time<br />
Cycle efficiency, even 95%<br />
No material degradation<br />
Non toxic materials<br />
Safety
Application of electrochemical capacitors:<br />
EC are used when high power demands are needed, i.e. car starting, acceleration or hills<br />
overcoming, but also in elements co-working with solar or fuel cells, and in many devices<br />
used every day, like: memory back-up in toys, cameras, video recorders, mobile phones and<br />
so forth. The main market for next few years is transportation market, including hybrid<br />
electric vehicles, as well as subways and tramways.<br />
<strong>Supercapacitors</strong>:<br />
Figure 2. Scheme of Electrochemical Capacitor.<br />
Fig. 2 shows the scheme of ECs construction. The cell is built from two electrodes made from<br />
the active material, separated with membrane (allow free ions exchange and protect against<br />
short-circuit) and solid or liquid electrolyte. Several types of ECs can be distinguished,<br />
depend on the charge storage mechanism as well as the active material type. They store<br />
energy using either ion adsorption (electrochemical double layer capacitors) or fast surface<br />
redox reactions (pseudo-capacitors). EDLCs ,the most common, use carbon-based active<br />
materials with high surface area. Pseudo-capacitors or redox supercapacitors use transition<br />
metal oxides as well as electrically conducting polymers as pseudo-capacitive active<br />
materials. A third group of ECs are hybrid capacitors. They are combining a capacitive or<br />
pseudo-capacitive electrode with a battery electrode. They benefit from both the capacitors<br />
and the battery properties.
Electrochemical Double Layer Capacitors:<br />
EDLC are electrochemical capacitors that store charge electrostatically using reversible<br />
adsorption of the electrolyte ions onto active materials that are electrochemically stable and<br />
have high accessible SSA. Charge separation occurs on polarization at the electrodeelectrolyte<br />
interface, producing what Helmholtz described as double layer capacitance C:<br />
where is the electrolyte constant, is the dielectric constant of the vacuum, is the<br />
effective thickness of the double layer (charge separation distance) and A is the electrode<br />
surface area.<br />
The phenomenon of electric double layer formation takes place almost on each material,<br />
which have the ability to charge conduction. EDL is created after insertion electrode in an<br />
appropriate electrolyte material and applying the external potential. The classical electrode<br />
has limited specific surface area(SSA), the interface electrode-electrolyte is limited, and this<br />
determines the efficiency of double layer formation. The good conducting and porous carbon<br />
materials provoke that electrical charge is accumulated at electrode-electrolyte interface,<br />
using the whole area of electrode pores and electrolyte. The structure of EDL shows Fig. 3.<br />
or<br />
Figure3. Scheme on double layer on electrode: 1. IHP Inner Helmholtz Layer, 2. OHP<br />
Outer Helmholtz Layer, 3. Diffuse layer, 4. Solvated ions, 5. Peculiar adsorptive ions,<br />
6. Solvent molecule.<br />
During the charging process the migration and separation of ions is observed. On the<br />
electrode surface with the correct sign, the solvated ions form the thin layer. The EDL
structure is built from two parts: first one is created between electrode surface and inert<br />
Helmholtz layer (IHL)-it contains the solvent particles and specific adsorbed ions; the seconddiffuse<br />
layer starts from outer Helmholtz layer(OHL).<br />
The value of electrical capacitance of carbon materials strongly depends on its microstructure.<br />
Fig. 4 shows the structure and arrangement of pores in carbon.<br />
Macropore<br />
Micropore<br />
Mesopore<br />
Figure 4. Structure and arrangement of pores in carbon material.<br />
It is important to notice that in EDL creation and in adsorption processes take part pores with<br />
diameter close to diameter of adsorbed ions, mainly micropores (d
Determination of EC capacitance:<br />
1. Assembling the capacitor cell:<br />
a) Au current collector, thickness ~60µm<br />
b) carbon electrode-measure mass, thickness and diameter of each electrode<br />
c) separator: glass fiber, thickness<br />
d) 3 different, already prepared, electrolyte: 1M H 2 SO 4 , 6M KOH, Ionic liquid<br />
2. Electrochemical testing:<br />
a) Impedance spectroscopy from 100 kHz to 1mHz<br />
b) Cyclic voltammetry at the scan rate 10 or 20 mVs -1 .<br />
c) Galvanostatic Charge and Discharge characteristic in the correct voltage range.<br />
3. Capacitance calculation<br />
Carbon electrodes<br />
The composite carbon electrodes were prepared by mixing 95% (w/w) of AC (CECA<br />
Acticarbone AB, from CECA company) with 5%(w/w) polytetrafluoroethylene binder<br />
(PTFE). The physical characteristic of AC material is given in the table below.<br />
Table 1 Physical properties of CECA "Acticarbone AB" Activated carbon
Electrochemical Impedance Spectroscopy<br />
The capacitive behavior can be easily observed by using EIS measurements presented in<br />
the form of Nyquist plot.<br />
Figure 5 The impedance plot for an electrochemical system.<br />
To determine capacity based on impedance measurement use equation:<br />
where is the specific capacitance (Fcm -2 ), is equal 1mHz and Z” is the imaginary<br />
component.<br />
Cyclic Voltammetry<br />
For the ideal capacitor based only on electrostatic effect on the electrode-electrolyte phases,<br />
the capacitance current should not be dependent on applied external potential. Thus the<br />
typical CV curve for EC has rectangular shape. In practice changes in ideal shape depends on<br />
many factors, i.e. resistance and redox reaction influence.
Q discharge/mA.h<br />
/mA<br />
27012012_CV_GCPL_Au_CECA_glass_fiber_01_CV_09.mpr<br />
vs. Ew e, cycle 2<br />
15<br />
10<br />
5<br />
0<br />
-5<br />
-10<br />
-15<br />
-20<br />
0<br />
0,1<br />
0,2<br />
0,3<br />
0,4<br />
0,5<br />
0,6<br />
0,7<br />
0,8<br />
Ew e /V vs . NHE<br />
Figure 6 Typical CV curve.<br />
27012012_CV_GCPL_Au_CECA_glass_fiber_01_CV_09_Qd.mpp<br />
Q discharge vs. Ew e, cycle 2<br />
0,22<br />
0,2<br />
0,18<br />
0,16<br />
0,14<br />
p slope [mAh/V]<br />
0,12<br />
0,1<br />
0,08<br />
0,06<br />
0,04<br />
0,02<br />
0<br />
0<br />
0,1<br />
0,2<br />
0,3<br />
0,4<br />
0,5<br />
0,6<br />
0,7<br />
0,8<br />
Ew e /V vs . NHE<br />
Figure 7 Qdischarge vs. Ewe plot, which is used to calculate p slope from equation<br />
below.<br />
To determine cell capacitance from CV curve use the equation:<br />
where is cell capacity given in Fg -1 , is slope calculated from the Q discharge vs. Ewe<br />
plot and given in mAhV -1 and is mass of active material.
Galvanostatic Charge and Discharge characteristic<br />
This evaluation is critical to the analysis and prediction of the active materials performance<br />
under practical operating conditions. The working electrode is submitted to a constant current<br />
I (charge or discharge), and voltage versus time is recorded between minimal and maximal<br />
values.<br />
Figure 7 The typical curve of galvanostatic charge-discharge process. 1. The cell<br />
behavior during charging; 2. The cell behavior during discharging; 3. The initial<br />
process; 4. This section is responsible for the negative resistive ohmic lost associated<br />
with the resistance of the cell.<br />
To determine the gravimetric capacitance use the equation:<br />
Where is the applied current (A),<br />
is the active material mass.<br />
is the discharge slope calculated from GCPL plot and<br />
References:<br />
1. Conway BE. Electrochemical supercapacitors: scientific, fundamentals and<br />
technological applications. New York: Plenum; 1999.<br />
2. Beguin F., Frąckowiak E. Carbons for electrochemical energy storage and conversion<br />
systems. CRC Press; 2010.<br />
3. Simon P., Gogotsi Y., Nature mater.,7, 845 (2008)