The structure and dynamics of a water beetle community in a ...
The structure and dynamics of a water beetle community in a ...
The structure and dynamics of a water beetle community in a ...

You also want an ePaper? Increase the reach of your titles
YUMPU automatically turns print PDFs into web optimized ePapers that Google loves.
Table 5 – Relative abundance <strong>of</strong> the three dom<strong>in</strong>ant groups <strong>and</strong> the most abundant species <strong>of</strong> <strong>water</strong> <strong>beetle</strong>s <strong>in</strong><br />
the light trap samples <strong>in</strong> 2002–2006.<br />
2002 (n=1,006) 2003 (n=7,578) 2004 (n=8,713) 2005 (n=3,283) 2006 (n=8,670)<br />
Dytiscidae 53.42% 15.74% 8.52% 23.03% 6.58%<br />
Ilybius fulig<strong>in</strong>osus 33.02% 5.52% 2.10% 1.81% 1.07%<br />
Ilybius ater 8.74% 5.02% 0.47% 1.07% 1.37%<br />
Rhantus suturalis 4.63% 3.77% 0.87% 0.27% 2.32%<br />
Ilybius subtilis 3.18% 0.03% 1.50% 18.98% 0.34%<br />
Hydrophiloidea 18.97% 76.56% 80.71% 62.94% 75.99%<br />
Hydrobius fuscipes 10.61% 68.40% 66.08% 44.53% 62.16%<br />
Enochrus coarctatus 6.37% 5.04% 7.78% 14.14% 6.81%<br />
Anacaena lutescens 0.41% 2.35% 5.64% 3.51% 1.61%<br />
Enochrus quadripunctatus 0.00% 0.13% 0.35% 0.30% 3.91%<br />
Scirtidae 27.50% 7.70% 10.52% 13.76% 17.23%<br />
Cyphon variabilis 12.36% 1.32% 5.06% 0.73% 4.42%<br />
Cyphon coarctatus 7.85% 2.33% 0.47% 0.27% 0.49%<br />
Cyphon ochraceus 2.89% 0.46% 0.46% 8.41% 9.95%<br />
Cyphon padi 1.81% 3.42% 4.42% 2.89% 1.49%<br />
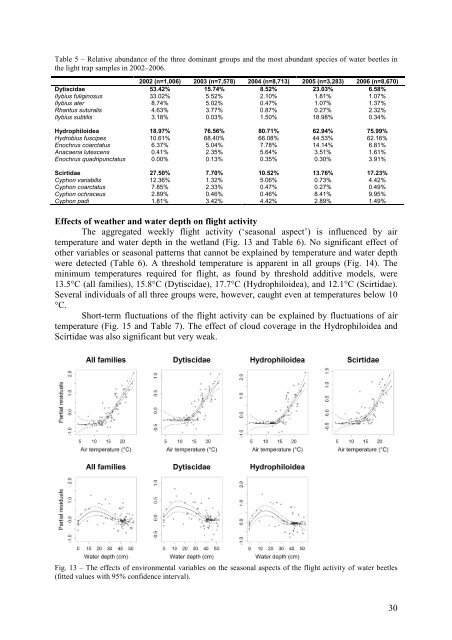
Effects <strong>of</strong> weather <strong>and</strong> <strong>water</strong> depth on flight activity<br />
<strong>The</strong> aggregated weekly flight activity (‘seasonal aspect’) is <strong>in</strong>fluenced by air<br />
temperature <strong>and</strong> <strong>water</strong> depth <strong>in</strong> the wetl<strong>and</strong> (Fig. 13 <strong>and</strong> Table 6). No significant effect <strong>of</strong><br />
other variables or seasonal patterns that cannot be expla<strong>in</strong>ed by temperature <strong>and</strong> <strong>water</strong> depth<br />
were detected (Table 6). A threshold temperature is apparent <strong>in</strong> all groups (Fig. 14). <strong>The</strong><br />
m<strong>in</strong>imum temperatures required for flight, as found by threshold additive models, were<br />
13.5°C (all families), 15.8°C (Dytiscidae), 17.7°C (Hydrophiloidea), <strong>and</strong> 12.1°C (Scirtidae).<br />
Several <strong>in</strong>dividuals <strong>of</strong> all three groups were, however, caught even at temperatures below 10<br />
°C.<br />
Short-term fluctuations <strong>of</strong> the flight activity can be expla<strong>in</strong>ed by fluctuations <strong>of</strong> air<br />
temperature (Fig. 15 <strong>and</strong> Table 7). <strong>The</strong> effect <strong>of</strong> cloud coverage <strong>in</strong> the Hydrophiloidea <strong>and</strong><br />
Scirtidae was also significant but very weak.<br />
Fig. 13 – <strong>The</strong> effects <strong>of</strong> environmental variables on the seasonal aspects <strong>of</strong> the flight activity <strong>of</strong> <strong>water</strong> <strong>beetle</strong>s<br />
(fitted values with 95% confidence <strong>in</strong>terval).<br />
30