Yuba County - 2012-13 California County Scorecard
Yuba County - 2012-13 California County Scorecard
Yuba County - 2012-13 California County Scorecard

You also want an ePaper? Increase the reach of your titles
YUMPU automatically turns print PDFs into web optimized ePapers that Google loves.
<strong>2012</strong>-<strong>13</strong> <strong>California</strong> <strong>County</strong> <strong>Scorecard</strong><br />
<strong>Yuba</strong> <strong>County</strong><br />
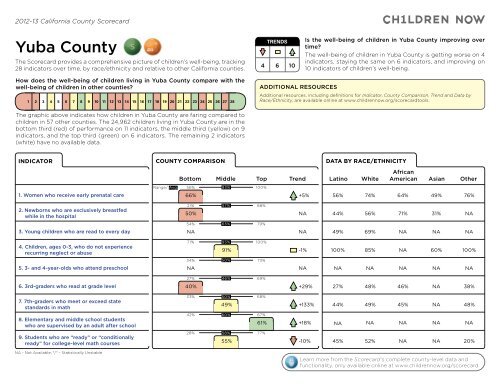
The <strong>Scorecard</strong> provides a comprehensive picture of children’s well-being, tracking<br />
28 indicators over time, by race/ethnicity and relative to other <strong>California</strong> counties.<br />
TRENDS<br />
4 6 10<br />
Is the well-being of children in <strong>Yuba</strong> <strong>County</strong> improving over<br />
time<br />
The well-being of children in <strong>Yuba</strong> <strong>County</strong> is getting worse on 4<br />
indicators, staying the same on 6 indicators, and improving on<br />
10 indicators of children’s well-being.<br />
How does the well-being of children living in <strong>Yuba</strong> <strong>County</strong> compare with the<br />
well-being of children in other counties<br />
1 2 3 4 5 6 7 8 9 10 11 12 <strong>13</strong> 14 15 16 17 18 19 20 21 22 23 24 25 26 27 28<br />
ADDITIONAL RESOURCES<br />
Additional resources, including definitions for Indicator, <strong>County</strong> Comparison, Trend and Data by<br />
Race/Ethnicity, are available online at www.childrennow.org/scorecardtools.<br />
The graphic above indicates how children in <strong>Yuba</strong> <strong>County</strong> are faring compared to<br />
children in 57 other counties. The 24,962 children living in <strong>Yuba</strong> <strong>County</strong> are in the<br />
bottom third (red) of performance on 11 indicators, the middle third (yellow) on 9<br />
indicators, and the top third (green) on 6 indicators. The remaining 2 indicators<br />
(white) have no available data.<br />
INDICATOR<br />
1. Women who receive early prenatal care<br />
COUNTY COMPARISON<br />
DATA BY RACE/ETHNICITY<br />
African<br />
Bottom Middle Top Trend Latino White American Asian Other<br />
Range/ Avg 56% 83%<br />
100%<br />
66%<br />
+5%<br />
56%<br />
74%<br />
64%<br />
49%<br />
76%<br />
2. Newborns who are exclusively breastfed<br />
while in the hospital<br />
21% 57%<br />
88%<br />
50%<br />
NA<br />
44%<br />
56%<br />
71%<br />
31%<br />
NA<br />
54% 48% 65%<br />
79%<br />
3. Young children who are read to every day<br />
NA<br />
NA<br />
49%<br />
69%<br />
NA<br />
NA<br />
NA<br />
4. Children, ages 0-3, who do not experience<br />
recurring neglect or abuse<br />
71% 93%<br />
100%<br />
91%<br />
-1%<br />
100%<br />
85%<br />
NA<br />
60%<br />
100%<br />
34% 50%<br />
73%<br />
5. 3- and 4-year-olds who attend preschool<br />
NA<br />
NA<br />
NA<br />
NA<br />
NA<br />
NA<br />
NA<br />
27% 46%<br />
69%<br />
6. 3rd-graders who read at grade level<br />
40%<br />
+29%<br />
27%<br />
48%<br />
46%<br />
NA<br />
38%<br />
7. 7th-graders who meet or exceed state<br />
standards in math<br />
33% 50%<br />
68%<br />
49%<br />
+<strong>13</strong>3%<br />
44%<br />
49%<br />
45%<br />
NA<br />
48%<br />
8. Elementary and middle school students<br />
who are supervised by an adult after school<br />
42% 60%<br />
67%<br />
61%<br />
+18%<br />
NA<br />
NA<br />
NA<br />
NA<br />
NA<br />
9. Students who are “ready” or “conditionally<br />
ready” for college-level math courses<br />
28% 58%<br />
77%<br />
55%<br />
-10%<br />
45%<br />
52%<br />
NA<br />
NA<br />
20%<br />
NA - Not Available; †/* - Statistically Unstable<br />
Learn more from the <strong>Scorecard</strong>’s complete county-level data and<br />
functionality, only available online at www.childrennow.org/scorecard.
<strong>Yuba</strong> <strong>County</strong><br />
Page 2 of 3<br />
<strong>2012</strong>-<strong>13</strong> <strong>California</strong> <strong>County</strong> <strong>Scorecard</strong><br />
INDICATOR<br />
COUNTY COMPARISON<br />
DATA BY RACE/ETHNICITY<br />
10. 12th-graders who graduate on time<br />
Range/ Avg<br />
Bottom Middle Top Trend Latino White<br />
38% 76%<br />
93%<br />
73%<br />
+20%<br />
67%<br />
72%<br />
African<br />
American Asian Other<br />
64%<br />
NA<br />
NA<br />
31% 92%<br />
100%<br />
11. Classrooms with high-speed Internet access<br />
99%<br />
NA<br />
NA<br />
NA<br />
NA<br />
NA<br />
NA<br />
12. High school science classes that are taught<br />
by a “highly qualified teacher”<br />
67% 92%<br />
100%<br />
90%<br />
-2%<br />
NA<br />
NA<br />
NA<br />
NA<br />
NA<br />
32% 44%<br />
58%<br />
<strong>13</strong>. Children who feel connected to their school<br />
34%<br />
+10%<br />
32%<br />
36%<br />
NA<br />
38%<br />
33%<br />
14. Suspensions that are limited to serious<br />
offenses, not “willful defiance”<br />
32% 58%<br />
84%<br />
53%<br />
-47%<br />
NA<br />
NA<br />
NA<br />
NA<br />
NA<br />
15. Expulsions that are limited to serious<br />
offenses, not “willful defiance”<br />
71% 92%<br />
100%<br />
95%<br />
-4%<br />
NA<br />
NA<br />
NA<br />
NA<br />
NA<br />
57% 69%<br />
82%<br />
16. Children who are in a healthy weight zone<br />
68%<br />
+19%<br />
64%<br />
71%<br />
61%<br />
70%<br />
71%<br />
17. Eligible students who eat free or reducedprice<br />
breakfasts during the school year<br />
18. Children who live near grocery stores,<br />
produce stands or farmers markets<br />
10% 30%<br />
51%<br />
51%<br />
0% 79%<br />
100%<br />
42%<br />
+6%<br />
0%<br />
NA<br />
NA<br />
NA<br />
NA<br />
NA<br />
NA<br />
NA<br />
NA<br />
NA<br />
NA<br />
19. Eligible students who eat free or reducedprice<br />
meals during the summer<br />
0% 16%<br />
48%<br />
6%<br />
0% 2%<br />
14%<br />
-45%<br />
NA<br />
NA<br />
NA<br />
NA<br />
NA<br />
20. Schools that have a health center<br />
0%<br />
0%<br />
NA<br />
NA<br />
NA<br />
NA<br />
NA<br />
21. Children who have health insurance for the<br />
entire year<br />
86% 92%<br />
97%<br />
93%<br />
NA<br />
NA<br />
NA<br />
NA<br />
NA<br />
NA<br />
22. Children who have a usual source<br />
of health care<br />
87% 92%<br />
95%<br />
92%<br />
NA<br />
NA<br />
NA<br />
NA<br />
NA<br />
97%*<br />
23. Asthmatic children who have been given<br />
an asthma management plan<br />
23% 36%<br />
55%<br />
44%<br />
NA<br />
NA<br />
NA<br />
NA<br />
NA<br />
NA<br />
24. Adolescents who are not at risk<br />
for depression<br />
64% 70%<br />
79%<br />
66%<br />
+2%<br />
67%<br />
66%<br />
75%<br />
68%<br />
59%<br />
25. Children who have visited a dentist in the<br />
last year<br />
82% 87%<br />
93%<br />
88%<br />
NA<br />
NA<br />
NA<br />
NA<br />
NA<br />
NA<br />
26. Children in the child welfare system who have<br />
visited a dentist in the last year<br />
0% 71%<br />
100%<br />
91%<br />
+198%<br />
100%<br />
93%<br />
33%<br />
100%<br />
NA
<strong>2012</strong>-<strong>13</strong> <strong>California</strong> <strong>County</strong> <strong>Scorecard</strong><br />
Page 3 of 3<br />
INDICATOR<br />
COUNTY COMPARISON<br />
DATA BY RACE/ETHNICITY<br />
27. Children in the child welfare system who<br />
have stability in their placement<br />
28. Children in the child welfare system who exit<br />
to permanency within three years<br />
NA - Not Available; †/* - Statistically Unstable<br />
Bottom Middle Top Trend Latino White<br />
Range/ Avg 69% 85%<br />
100%<br />
76%<br />
-6% 77% 71%<br />
50% 88%<br />
97%<br />
96%<br />
+11% NA 89%<br />
African<br />
American Asian Other<br />
100%<br />
NA<br />
100%<br />
NA<br />
100%<br />
NA<br />
Learn more from the <strong>Scorecard</strong>’s complete county-level data and<br />
functionality, only available online at www.childrennow.org/scorecard.