CBRE - Ukraine Property Market - Office 2012
CBRE - Ukraine Property Market - Office 2012
CBRE - Ukraine Property Market - Office 2012

Create successful ePaper yourself
Turn your PDF publications into a flip-book with our unique Google optimized e-Paper software.
<strong>CBRE</strong><br />
<strong>Market</strong>View<br />
Kyiv <strong>Office</strong>s<br />
H1 <strong>2012</strong><br />
FUNDAMENTALS<br />
Quick Stats<br />
Change from<br />
H2 ‘11 H1 ‘11<br />
New Supply <br />
Rent <br />
Vacancy <br />
Hot Topics<br />
• Fall in leasing activity: gross absorption more<br />
than halved in H1 <strong>2012</strong> to just over 30,000<br />
sq m<br />
Because of unfavorable<br />
external conditions, Ukrainian economy was driven primary<br />
by domestic consumption in Q1 <strong>2012</strong>. In the first three months of the year, GDP<br />
grew only 2% y-o-y. Despite expectations ti for a faster pace in Q2, weak external<br />
demand hinders the expansion and the latest forecasts for economic growth in<br />
<strong>2012</strong> now vary between<br />
1.3 and 2.5% 1 .<br />
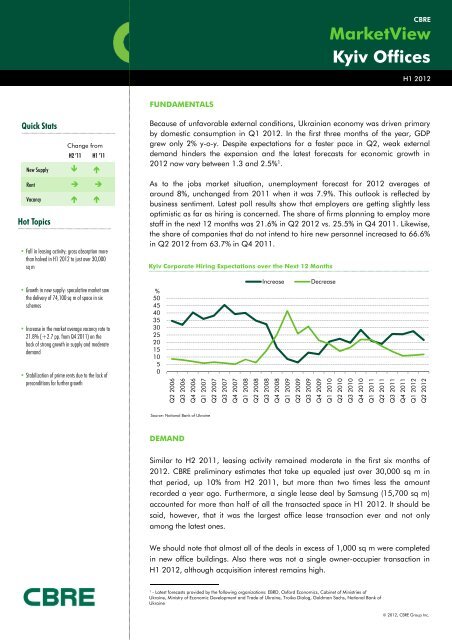
As to the jobs market situation, unemployment forecast for <strong>2012</strong> averages at<br />
around 8%, unchanged<br />
from 2011 when it was 7.9%. This outlook is reflected by<br />
business sentiment. Latest poll results show that employers are getting slightly less<br />
optimistic as far as hirin<br />
ng is concerned. The share of firms planning to employ more<br />
staff in the next 12 months was 21.6% in Q2 <strong>2012</strong> vs. 25.5% in Q4 2011. Likewise,<br />
the share of companies<br />
that do not intend to hire new personnel increased to 66.6%<br />
in Q2 <strong>2012</strong> from 63.7%<br />
in Q4 2011.<br />
Kyiv Corporate Hiring Expectations over the Next 12 Months<br />
• Growth in new supply: speculative market saw<br />
the delivery of 74,100 sq m of space in six<br />
schemes<br />
• Increase in the market average vacancy rate to<br />
21.8% (+2.7 pp. from Q4 2011) on the<br />
back of strong growth in supply and moderate<br />
demand<br />
• Stabilization of prime rents due to the lack of<br />
preconditions for further growth<br />
%<br />
50<br />
45<br />
40<br />
35<br />
30<br />
25<br />
20<br />
15<br />
10<br />
5<br />
0<br />
Q2 2006<br />
Q3 2006<br />
Q4 2006<br />
Q1 2007<br />
Q2 2007<br />
Increase Decrease<br />
Q3 2007<br />
Q4 2007<br />
Q1 2008<br />
Q2 2008<br />
Q3 2008<br />
Q4 2008<br />
Q1 2009<br />
Q2 2009<br />
Q3 2009<br />
Q4 2009<br />
Q1 2010<br />
Q2 2010<br />
Q3 2010<br />
Q4 2010<br />
Q1 2011<br />
Q2 2011<br />
Q3 2011<br />
Q4 2011<br />
Q1 <strong>2012</strong><br />
Q2 <strong>2012</strong><br />
Source: National Bank of <strong>Ukraine</strong><br />
DEMAND<br />
Similar to H2 2011, leasing activity remained moderate in the first six months of<br />
<strong>2012</strong>. <strong>CBRE</strong> preliminary estimates that take up equaled just over 30,000 sq m in<br />
that period, up 10% from H2 2011, but more than two times less the amount<br />
recorded a year ago. Furthermore, a single lease deal by Samsung (15,700 sq m)<br />
accounted for more than half of all the transacted space in H1 <strong>2012</strong>. It should be<br />
said, however, that it was the largest office lease transaction ever and not only<br />
among the latest ones.<br />
We should note that almost all of the deals in excess of 1,000 sq m were completed<br />
in new office buildings. Also there was not a single owner-occupier transaction in<br />
H1 <strong>2012</strong>, although h acquisition iiti interest t remains high. h<br />
1 - Latest forecasts provided by the following organizations: EBRD, Oxford Economics, Cabinet of Ministries of<br />
<strong>Ukraine</strong>, Ministry of Economic Development and Trade of <strong>Ukraine</strong>, Troika Dialog, Goldman Sachs, National Bank of<br />
<strong>Ukraine</strong><br />
© <strong>2012</strong>, <strong>CBRE</strong> Group Inc.
Key <strong>Office</strong> Lease Transactions in H1 <strong>2012</strong><br />
Occupier<br />
Industry<br />
<strong>Property</strong> Submarket GLA*, sq m<br />
<strong>Market</strong>View Ky yiv offices<br />
Samsung Electronics<br />
Diplomatic mission<br />
Mary Kay<br />
Software Outsourcing Team<br />
System Integration Service<br />
ENI<br />
IT & High Tech, telecommunications 101 Tower South-West 15,700<br />
Extraterritorial organizations and bodies Confidential Olimpijskyi 4,500<br />
Wholesale and Retail Trade<br />
IT & High Tech, telecommunications BC at 50, Gaydara St. South-West 1,200<br />
IT & High Tech, telecommunications BC at 50, Gaydara St. South-West 1,200<br />
Manufacturing, Industrial and Energy Podol Plaza Podil 800<br />
*- gross leasable area<br />
Note: submarkets defined according to the new central business district (CBD) delineation introduced by <strong>CBRE</strong> in September 2011<br />
Prime, Pechersk, Podil, Olimpijskyi, Shevchenkivskyi – CBD; South, South West, West, North – CBD fringe; NC-SW – non-central location, south west (right bank), NC-NW – non-central location, north west (right bank),<br />
NC-NE NE – non-central location, north east (left bank), NC-SE – non-central location, south east (left bank)<br />
Source: <strong>CBRE</strong><br />
Companies within the IT & High Tech and<br />
Telecommunications sector still make up the lion’s<br />
share of the overall take-up, accounting for 62% of all<br />
transactions. The demand from banking, finance and<br />
business services companies, which used to be the<br />
main users of space in the past, remains weak as they<br />
make up only 5% of all deals. Most of the transactions<br />
are still largely driven by consolidation plans of the<br />
companies or their intentions to move to premises of<br />
better quality in terms of class or location.<br />
SUPPLY<br />
In H1 <strong>2012</strong> total competitive stock grew by 74,000 sq<br />
m of space. Almost half of that space was delivered in<br />
just one scheme – class A offices as part of Toronto-<br />
Kyiv mixeduse(GLA–35,000sqm).Asoftheendof<br />
Q2 <strong>2012</strong> total competitive office stock in Kyiv equaled<br />
1.304 million sq m.<br />
BC at 2A Novovokzalna St. South-West 1,348<br />
We expect another 100,000 sq m of space to be<br />
delivered before the end of the year. Should all that<br />
space gets delivered as planned, annual completions<br />
will amount to 170,000 sq m (+23% y-o-y), of which<br />
87,200 sq m are class A properties within CBD.<br />
Moreover, almost all new office schemes are located<br />
on the West (Right) bank. The only exception is Crystal<br />
office building (GLA – 9,000 sq m), delivered in Q2<br />
<strong>2012</strong>. The geographical imbalance within the office<br />
stock will, therefore, continue to grow even further.<br />
In <strong>2012</strong> Olympijskyi submarket is expected to grow<br />
significantly in terms of new class A supply, while in<br />
2013 large office schemes are scheduled d for delivery<br />
in Podil and Pechersk. No significant increase in new<br />
supply is expected in Prime and Shevchenkiskyi<br />
submarkets over <strong>2012</strong>-2013.<br />
Another 150,000 sq m of office space currently under<br />
construction may enter the market in 2013. It should<br />
be noted that this amount also includes schemes which<br />
were initially planned for the delivery in <strong>2012</strong>.<br />
New Supply in <strong>2012</strong> (major schemes)*<br />
Name Class Submarket<br />
Toronto-Kyiv AА Olimpijskyi<br />
Kanyon CВ North<br />
Forum Victoria Park (Phase I) BС NC-SW<br />
Domosfera BС NC-SW<br />
Crystal BС NC-NE<br />
Gulliver (Esplanada/Continetal) AА Olimpijskyi<br />
BC at Sahaydachnogo St. BA Podil<br />
BC at 98 Chervonoarmijska St. AА Olimpijskyiij i<br />
Developer GLA, sq m Delivery<br />
Toronto-Kyiv 32,500 H1 <strong>2012</strong><br />
Kanyon 5,500 H1 <strong>2012</strong><br />
Forum Management Group 7,200 H1 <strong>2012</strong><br />
DeVision 17,100 H1 <strong>2012</strong><br />
First Dnepr Investment<br />
Company<br />
9,000 H1 <strong>2012</strong><br />
Mandarin Plaza 47,200 H2 <strong>2012</strong><br />
Local developer 2,800 H2 <strong>2012</strong><br />
VS Energy International <strong>Ukraine</strong> 7,500 H2 <strong>2012</strong>2<br />
H1 201 12<br />
BC at 40/85 Saksaganskogo St. ВА Olimpijskyi<br />
Forum B7 BВ South-West<br />
BC at 36 Shorsa St. ВВ South<br />
Eleven II BB South-West<br />
BC at 69 Frunze St. (Phase I and II) BB North<br />
* according to developers’ announcements<br />
Source: <strong>CBRE</strong><br />
Page 2<br />
Local developer 2,500 H2 <strong>2012</strong><br />
Forum Management Group 2,200 H2 <strong>2012</strong><br />
Zhytlobud 24,800 H2 <strong>2012</strong><br />
Center-Invest 3,900 H2 <strong>2012</strong><br />
UBK 6,000 H2 <strong>2012</strong><br />
© <strong>2012</strong>, <strong>CBRE</strong> Group Inc.
New Supply in 2013 (major schemes)*<br />
Name Class Submarket<br />
BC at 25B Khmelnytsyi St. BA Prime<br />
Merx Center 2 AB South<br />
Metropol (Maria) AA Pechersk<br />
Silver Breeze BC NC-NE<br />
Horizon Podol II AА Podil<br />
BC at 28A Moskovskyi Ave. АВ North<br />
Podol Prestige BA Podil<br />
BC at 69, Frunze St. (Phase III and IV) BB North<br />
Developer GLA, sq m Delivery<br />
Vector 5,100 H1 2013<br />
Merx Group 21,800 H1 2013<br />
K.A.N. Development 40,000 H1 2013<br />
Svitland <strong>Ukraine</strong> 26,000 H1 2013<br />
ISA Prime Development 16,000 H1 2013<br />
Local developer 20,000 H1 2013<br />
Local developer 12,000 H2 2013<br />
UBK 6,000 H2 2013<br />
Mark ketView Kyiv Offi ces<br />
* according to developers’ announcements<br />
Source: <strong>CBRE</strong><br />
Kyiv Annual Development Completions and<br />
Total Competitive Stock<br />
1 800<br />
1 600<br />
1 400<br />
1 200<br />
1 000<br />
800<br />
600<br />
400<br />
200<br />
0<br />
F – forecast<br />
Source: <strong>CBRE</strong><br />
Stock at the beginning of the year<br />
Annual Supply<br />
2000<br />
01<br />
02<br />
03<br />
04<br />
05<br />
06<br />
07<br />
08<br />
09<br />
10<br />
11<br />
12F<br />
13F<br />
New Supply, Net Absorption and Vacancy Rate<br />
'000 sq m<br />
300<br />
250<br />
200<br />
150<br />
100<br />
50<br />
0<br />
-50<br />
-100<br />
Completions (lhs)<br />
Net absorption (lhs)<br />
Vacancy (rhs)<br />
2000 2002 2004 2006 2008 2010 <strong>2012</strong>F<br />
30%<br />
25%<br />
20%<br />
15%<br />
10%<br />
5%<br />
0%<br />
Vacancy and Rates<br />
Analysis of net absorption dynamics indicates that<br />
relocations from grey stock (non-classified office<br />
buildings) to competitive stock are fading away. At the<br />
same time, expansions are progressing only slowly<br />
given the unfavorable trends in the broader economy.<br />
The combination of modest demand and large new<br />
supply has brought about an increase in vacancy rate<br />
to<br />
21.8% (+2.7 pp from Q4 2011; +8.8 pp y-o-y).<br />
Due to the delivery of the office scheme Toronto-Kyiv,<br />
vacancy rate on Olympijskyi submarket doubled to<br />
31.4%, driving the overall CBD vacancy to 16.1% from<br />
10% in Q4 2011. Still, the biggest share of vacant<br />
space (38.2%) is concentrated outside of the city<br />
center. Vacancy rate within the area bordering CBD<br />
fell to 17.0% from 32.7%, but that shift was entirely<br />
attributed to a single lease deal: Samsung taking up<br />
15,700 sq m in 101 Tower.<br />
There were no significant changes in rental rates in H1<br />
<strong>2012</strong>. As of the end of Q2 <strong>2012</strong>, average base rental<br />
rates for Class A properties in CBD stayed in the range<br />
of $25-42/sq m/month. Average rental rate for Class<br />
B properties was around $23/sq m/month (net of VAT<br />
and OPEX).<br />
lhs – left hand side<br />
rhs – right hand side<br />
F - forecast<br />
Source: <strong>CBRE</strong><br />
Page 3<br />
H1 <strong>2012</strong><br />
© <strong>2012</strong>, <strong>CBRE</strong> Group Inc.
Kyiv <strong>Office</strong> Base Rental Range and Vacancy, by Location as of Q2 <strong>2012</strong><br />
Class A location<br />
Quality A Quality B Vacancy<br />
Prime $35-42 $25-30 5.4%<br />
Pechersk $35-42 $25-30 9.0%<br />
Podil $28-35 $23-25 10.0%<br />
Shevchenkivskyi<br />
- $22-30 11.5%<br />
Olimpijskyi $25-32 $23-27 31.4%<br />
Class B location<br />
Quality A Quality B Vacancy<br />
CBD fringe $20-25 $14-20 17.0%<br />
Class C location<br />
Quality A Quality B Vacancy<br />
Non-central area<br />
- $12-15 38.2%<br />
Source: <strong>CBRE</strong><br />
Map of <strong>Office</strong> Submarkets in Kyiv<br />
Source: <strong>CBRE</strong><br />
H1 201 12<br />
Page 4<br />
© <strong>2012</strong>, <strong>CBRE</strong> Group Inc.
YIELDS<br />
Not a single investment transaction 2 took place in the office market during the first six months of the year. The<br />
economic uncertainty holds back the development of commercial real estate market and we do not expect to see<br />
any improvements before the year end. Until political and financial risks start to decline, prime yields should stay<br />
where they are now – at 13% – provided the economic situa<br />
ation does not deteriorate further.<br />
OUTLOOK<br />
H1 <strong>2012</strong> was characterized by a rather moderate dynamics in office real estate market. Should the absorption<br />
rate remain stable and the schemes under construction get delivered as planned (+100,000 sq m) average<br />
market vacancy rate will rise to 24.5%.<br />
High vacancy rate will spur competition among the properties. Since the delivery of several schemes was<br />
postponed until 2013, the share of class A properties in <strong>2012</strong> new stock has declined from 67% (forecast made<br />
in Q4 2011) to 52%. This figure, however, is still large enough to put a downward pressure on rental rates.<br />
Against the backdrop of moderate demand, landlords will have to offer better terms and start making concession<br />
to tenants. We expect the upper limit of rental rates to decline gradually in H2 <strong>2012</strong>. Already top rents on Class<br />
B properties in Prime submarket decreased by $5 in anticipation of new class A deliveries, which have lower rents<br />
compared to the existing schemes.<br />
Mark ketView Kyiv Offi ces<br />
10<br />
Full Year 20<br />
2 - <strong>Property</strong> investment transactions exclude corporate transactions, in which real estate is only a (necessary) part of business transaction, land/development deals and owner-occupier<br />
deals, where a buyer has no intention to receive income from the property<br />
Page 5<br />
© <strong>2012</strong>, <strong>CBRE</strong> Group Inc.<br />
H H1<br />
1<br />
<strong>2012</strong><br />
2011
KYIV BUSINESS CENTERS<br />
Source: <strong>CBRE</strong><br />
Key Existing<br />
<strong>Office</strong> Schemes<br />
№ NAME<br />
ADDRESS GLA, sq m COMPLETION<br />
1 Makulan 9/2 V.Vasylkivska St. 8,000 1993<br />
2 Europa 4 Muzeinyi lane 5,600 1995<br />
3 Horizon <strong>Office</strong> Towers 42-44 44 Shovkovychna St. 12,000 1998<br />
4 Artem 4 Glubochytska St. 10,200 1998<br />
5 Khreschatyk Plaza 19A Khreschatyk St. 6,500 1999<br />
6 Merx Center 1 15 Leiptsygska St. 5,100 1999<br />
7 Podil Plaza 30 Spaska St. 19,800 2000<br />
8 Silver Center 4 I.Lepse blvd. 6,500 2001<br />
9 Forum Business City 13 Pymonenka St. 28,000 2002<br />
10 Forum Satelite 4 Geroiv Kosmosa St. 12,000 2003<br />
11 Cubic Center 3 Sholudenka St. 11,600 2003<br />
12 Panorama 20 V. Zhytomyrska St. 8,900 2003<br />
13 Poligrafist 33 Vorovskoho St. 8,000 2003<br />
H1 201 12<br />
Page 6<br />
© <strong>2012</strong>, <strong>CBRE</strong> Group Inc.
10<br />
Full Year 20<br />
Key Existing <strong>Office</strong> Schemes<br />
№ NAME ADDRESS GLA, sq m COMPLETION<br />
14 Aquamarin 29 Zhylyanska St. 5,300 2003<br />
15 Stend 14 Vasylkivska St. 11,500 2004<br />
16 Olympiyskyi 72 V.Vasylkivskaa St. 7,000 2004<br />
17 Igorivskyi 13/5 Igorivska St. 6,700 2004<br />
18 Forum Park Plaza 9 Moskovskyi ave. 27,200 2005<br />
19 Irva (Phase I,II) II) 10/14 Radischev<br />
va St. 26,000 2005-2009<br />
2009<br />
20 Illinskyi (Phase I,II,III) 8 Illinska St.<br />
25,500 2005-2008<br />
21 Botanic Towers 119-121 Saksahanskoho St. 7,000 2005<br />
22 FIM Center 1 17 Liniyna St.<br />
6,500 2005<br />
23 Olimp 3 Sportyvna Sq.<br />
6,500 2005<br />
24 Fermmash 62 Dehtyarivska St. 5,700 2005<br />
25 Meganom 1 Dniprovskyiuzviz 5,500 2005<br />
26 Capital 77A V.Vasylkivska St. 3,800 2005<br />
27 Europa Plaza (Phase I,II) 120 Saksahanskoho St. 26,700 2006-2007<br />
28 Horizon Park 1 4B Grynchenka St. 16,000 2006<br />
29 Komod 4 Lunacharskohoo St. 15,000 2006<br />
30 Renaissance 24 Vorovskogo St. 14,500 2006<br />
31 Leonardo (Phase I) 17/52 Khmelnytskogo B. St. 11,300 2006<br />
32 Senator 101 Volodymyrska St. 6,000 2006<br />
33 Seven Hills 49A Volodymyrska St. 6,000 2006<br />
34 Parus 2 Mechnykova St. 52,700 2007<br />
35 Eurasia 73-79 Zhylyanska St. 23,400 2007<br />
36 BC at Fizkultury St. 28 Fizkultury St.<br />
11,700 2007<br />
37 Farenheit 30 Fizkultury St.<br />
10,000000 2007<br />
38 Staryi Grad 6 Rylskoho lane<br />
5,200 2007<br />
39 Palladium 172 Antonovycha St. 20,000 2008<br />
40 Leonardo (Phase II) 19-21A B. Khmelnytskogo St. 15,200 2008<br />
41 Watergate 8B Okipnoy R. St. 11,000 2008<br />
42 Mikom Palace 27 Dehtyarivska St. 10,900 2008<br />
43 Prime 48, 50A Zhylyanska St. 8,400 2008<br />
44 Vremena Goda 16 Kudryashova St. 7,100 2008<br />
45 Podil Kyiv 25B Sahaidachnoho St. 6,000 2008<br />
46 Capital Hall 31-33 33 Zhylyansk<br />
ka St. 5,000 2008<br />
47 Horizon Park 2 (Phase I,II) 12A Amosova St. 30,400 2009-2010<br />
48 Protasov Business Park 2/1 Hrynchenka St. 21,300 2009<br />
49 Vector 10G Starokyivska St. 9,600 2009<br />
50 Forum Kinetic 12 Kurenivskyi lane 9,000 2009<br />
51 Flora Park 8 Tankova St.<br />
8,300 2009<br />
52 FIM Center 2 1 Magnitogorskaa St. 7,400 2009<br />
53 Prague 6 Sosyury St.<br />
7,000 2009<br />
54 Livoberezhnyi 2A M. Raskovoi St. 5,700 2009<br />
55 Horizon Podil (Phase I) 9 N.Khreschatyts<br />
ska St. 1,200 2009<br />
56 Eleven 11 Solominska St. 8,000 2010<br />
57 Lucky.net Telecom <strong>Office</strong> 13A Moskovskyi ave. 5,500 2010<br />
58 Premium Business Center 6Z I.Lepse blvd.<br />
38,000 2011<br />
59 Rialto 18 Novokonstantynivska St. 15,200 2011<br />
60 BC at Kozatska St. 120/4 Kozatska St. 7,000 2011<br />
61 Pankivskyi 70/16B Saksahanskoho St. 9,600 2011<br />
62 101 Tower 57 L'va Tolstogo St. 46,000 2011<br />
63 BC at Druzhby Narodiv 19 Dryzhby Narodiv Blvd. 7,000 2011<br />
64 Toronto-Kyiv Ki 79 Antonovycha<br />
St. 32,500 H1 <strong>2012</strong><br />
65 Kanyon 56A Yaroslavskaa St. 5,500 H1 <strong>2012</strong><br />
66 Forum Victoria Park (Phase I) 7A Akhtyrskyi lane 7,200 H1 <strong>2012</strong><br />
67 Domosfera 101 Stolychne shose 17,100 H1 <strong>2012</strong><br />
68 Crystal 175-177 Kharkivske highway 9,000 H1 <strong>2012</strong><br />
Key Future <strong>Office</strong><br />
Schemes<br />
№ NAME ADDRESS GLA, sq m COMPLETION<br />
1 Gulliver (Esplanada/Continental) 1 Sportyvna Sq.<br />
47,200 H2 <strong>2012</strong><br />
2 BC at Chervonoarmijska St. 98 Chervonoarm<br />
mijska St. 7,500 H2 <strong>2012</strong><br />
3 BC at Schorsa St. 36 Schorsa St.<br />
24,800 H2 <strong>2012</strong><br />
4 Eleven II 11 Solomenska St. 3,900 H2 <strong>2012</strong><br />
5 BC at Frunze (Phase I,II) 69 Frunze St.<br />
6,000 H2 <strong>2012</strong><br />
6 BC at B. Khmelnytskogo St. 52B B. Khmelnytskogo St. 5,120 H1 2013<br />
7 BC at Moskovskyi Ave. 28A Moskovskyi Ave. 20,000 H1 2013<br />
8 Horizon Podil (Phase II) 9 N. Khreschatytska St. 15,400 H1 2013<br />
9 Silver Breeze Serafimovycha/Tychyny St. 26,000 H1 2013<br />
10 Merx Center II 15A Leiptsigska St. 21,800 H1 2013<br />
11 Metropol (Maria) 2/32-34 Moskovskaya St. 40,000 H2 2013<br />
12 BC at Frunze (Phase III,IV) 69 Frunze St.<br />
6,000 H2 2013<br />
Source: <strong>CBRE</strong><br />
Page 7<br />
© <strong>2012</strong>, <strong>CBRE</strong> Group Inc.<br />
Mark ketView Kyiv Offi ces<br />
H H1<br />
1<br />
<strong>2012</strong><br />
2011
DEFINITIONS<br />
CBD – central business district<br />
Leasing Activity – represents the total floorspace known to have been let or pre-let, sold or<br />
pre-sold to tenants or owner-occupiers during the survey period. Unlike take-up (see<br />
definition below) it includes sales and leasebacks, renewals, regears, as well as subleases.<br />
Net Absorption (occupancy growth) – represents the change in occupied stock within a<br />
market during the survey period<br />
Prime Rent – represents the top open-market tier of rent that could be expected for a unit of<br />
standard size commensurate with demand, of highest quality and specification and in the<br />
best location in a market at the survey date. Prime Rent reflects the level at which relevant<br />
transactions are being completed in the market at the time but need not be exactly identical<br />
to any of them, particularly l if deal flow is verylimited i or mad<br />
de upof unusual one-off deals. If<br />
there are no relevant transactions during the survey period, the quoted figure is more<br />
hypothetical, based on expert opinion of market conditions, but the same criteria on building<br />
size and specification will still apply. For offices, the prime rent should represent the typical<br />
“achievable” open market headline rent which a blue chip<br />
occupierwouldbeexpectedto<br />
pay for:<br />
• an office unit of standard size commensurate with demand in each location, typically<br />
500 sq m<br />
• an office unit of highest quality and specification within the local market<br />
• an office unit within the prime location (CBD, for example) of a market<br />
Take-up(grossabsorption)– represents the total floorspace<br />
known to have been let or prethe<br />
survey period. A property is<br />
let, sold or pre-sold to tenants or owner-occupiers during<br />
deemed to be taken-up only when contracts are signed or a binding agreement exists. Pre-<br />
let refers to take-up that was signed either in the planning<br />
or construction stage. All deals<br />
(including pre-lets and pre-sales) are recorded in the<br />
period that they were signed.<br />
Exclusions include space that is under offer, sales and leasebacks (as there has been no<br />
change in occupation), contract renewals (unless the occupier took additional space, when<br />
only the additional space is included).<br />
Total Competitive Stock – represents the total completed space (occupied and vacant) in the<br />
private sector at the survey date, recorded as gross leasable area. Includes purpose-built,<br />
space converted from other uses and independent space forming part of a mixed-use<br />
development. Total Competitive Stock excludes any buildings thatarenotconsideredtobe<br />
‘competitive’ or active in the marketplace. Exclusions include; government and public<br />
buildings, where the public sector space is purpose built and owner occupied and the public<br />
sector does not engage in the open market; singly occupied properties, occupied by a tenant<br />
as the owner or on a long-term lease agreement; properties that are not considered to be<br />
actively competitive due to a size threshold, age, use or class.<br />
For More information regarding<br />
the <strong>Market</strong>View, please contact:<br />
<strong>CBRE</strong> <strong>Ukraine</strong> <strong>Office</strong><br />
4 M. Hrinchenka St.,<br />
Kyiv 03680<br />
t: +38-044-390-00-00<br />
Sergiy Sergiyenko<br />
Managing Partner<br />
e: sergiy.sergiyenko@cbre.ua<br />
Radomyr Tsurkan<br />
Managing Partner<br />
e: radomyr.tsurkan@cbre.ua<br />
Marina Krestinina<br />
Director of Strategic Consulting&Research<br />
e: marina.krestinina@cbre.ua<br />
Maryna Gavrylenko<br />
Senior Research Analyst<br />
e: maryna.gavrylenko@cbre.ua<br />
Vacant Space – represents the total gross lettable (or rentable) floor space in existing<br />
properties, which is physically vacant and being actively marketed at the survey date. Space<br />
that is physically vacant, but not being marketed or is not available for occupation is<br />
excluded from vacancy. Spacethatisunder construction is also excluded from vacant space.<br />
Vacant Space Rate – represents the percentage ratio of total vacant space to competitive<br />
stock<br />
Disclaimer <strong>2012</strong> <strong>CBRE</strong><br />
Information herein has been obtained from sources believed to be reliable. While we do not doubt its accuracy, we<br />
have not verified it and make no guarantee, warranty or representat<br />
tion about it. It is your responsibility to<br />
independently confirm its accuracy and completeness. Any projections, opinions, assumptions or estimates used are<br />
for example only and do not represent the current or future performance of the market. This information is designed<br />
exclusively for use by <strong>CBRE</strong> clients, and cannot be reproduced without prior written permission of <strong>CBRE</strong>.<br />
© Copyright <strong>2012</strong> <strong>CBRE</strong><br />
H1 201 12<br />
<strong>CBRE</strong> is the market leading commercial real estate adviser worldwide<br />
- an adviser strategically dedicated to<br />
providing cross-border advice to corporate and investment clients immediately and at the highest level. The<br />
Company has approximately 34,000 employees (excluding affiliates), and serves real estate owners, investors and<br />
occupiers through more than 300 offices (excluding affiliates) worldwide. Our network of local expertise, combined<br />
with our international perspective, ensures that we are able to offer aconsistently high standard of service across the<br />
world. For full list of <strong>CBRE</strong> offices and details of services, visit www.cbre.com<br />
Page 8<br />
© <strong>2012</strong>, <strong>CBRE</strong> Group Inc.