Figure 1: Brain Scans Over 12 Energy Treatment Sessions
Figure 1: Brain Scans Over 12 Energy Treatment Sessions
Figure 1: Brain Scans Over 12 Energy Treatment Sessions

Create successful ePaper yourself
Turn your PDF publications into a flip-book with our unique Google optimized e-Paper software.
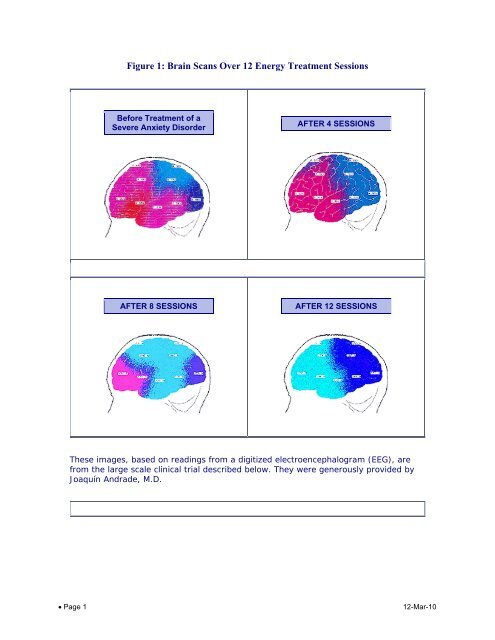
<strong>Figure</strong> 1: <strong>Brain</strong> <strong>Scans</strong> <strong>Over</strong> <strong>12</strong> <strong>Energy</strong> <strong>Treatment</strong> <strong>Sessions</strong><br />
Before <strong>Treatment</strong> of a<br />
Severe Anxiety Disorder<br />
AFTER 4 SESSIONS<br />
AFTER 8 SESSIONS<br />
AFTER <strong>12</strong> SESSIONS<br />
These images, based on readings from a digitized electroencephalogram (EEG), are<br />
from the large scale clinical trial described below. They were generously provided by<br />
Joaquín Andrade, M.D.<br />
• Page 1<br />
<strong>12</strong>-Mar-10
Blue = normal ratio of wave frequencies<br />
(according to data bases)<br />
Turquoise = slightly dysfunctional ratio of<br />
wave frequencies<br />
Pink = moderately dysfunctional ratio<br />
Red = highly dysfunctional ratio<br />
Normal (Ideal) Profile<br />
(according to data bases)<br />
An EEG provides a visual record of electrical activity of the brain, showing variations in<br />
the frequency, amplitude, and voltage of the impulses, known as "alpha," "beta,"<br />
"theta," and "delta" rhythms. The colors represent the ratio of brain frequencies<br />
(specifically, alpha, beta, and theta waves) and sub-frequencies within given areas of<br />
the brain. At any given moment, different parts of the brain are operating at different<br />
frequencies, and different mental states can be distinguished by specific brain<br />
frequency patterns (Amen, 2003). Anxiety has one such electronic "signature" (top left<br />
image). Depression has another.<br />
• Page 2<br />
<strong>12</strong>-Mar-10