Army Working Capital Fund (AWCF) - Army Financial Management ...
Army Working Capital Fund (AWCF) - Army Financial Management ...
Army Working Capital Fund (AWCF) - Army Financial Management ...

Create successful ePaper yourself
Turn your PDF publications into a flip-book with our unique Google optimized e-Paper software.
ARMY WORKING CAPITAL FUND<br />
FISCAL YEAR (FY) 2014<br />
BUDGET ESTIMATES<br />
SUBMITTED TO CONGRESS APRIL 2013
This Page Intentionally Left Blank
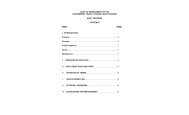
Table of Contents<br />
ARMY OVERVIEW<br />
Background 1<br />
<strong>AWCF</strong> Activity Groups 5<br />
Budget Highlights 6<br />
<strong>Fund</strong> Balance with Treasury 10<br />
<strong>Capital</strong> Budget 15<br />
SUPPLY MANAGEMENT<br />
OPERATING BUDGET<br />
Introduction 17<br />
Budget Highlights 23<br />
Appropriations 31<br />
Exhibits 32<br />
INDUSTRIAL OPERATIONS<br />
OPERATING BUDGET<br />
Introduction 43<br />
Budget Highlights 55<br />
Appropriations 60<br />
Minimum <strong>Capital</strong> Investment<br />
for Certain Depots and Arsenals 61<br />
Exhibits 62<br />
CAPITAL BUDGET<br />
EXHIBITS<br />
Introduction 73<br />
Supply <strong>Management</strong> Exhibits 75<br />
Industrial Operations Exhibits 78<br />
Supplies air-dropped to U.S.<br />
Soldiers deployed to Afghanistan.<br />
The estimated cost of this<br />
report or study for the<br />
Department of Defense is<br />
approximately $82,000 for<br />
Fiscal Year 2013<br />
All photographs in this<br />
document were obtained<br />
from official U.S. Department<br />
of Defense web sites
<strong>Army</strong> Civilian Corps Creed<br />
I am an <strong>Army</strong> civilian – a member of the <strong>Army</strong> team.<br />
I am dedicated to our <strong>Army</strong>, our Soldiers and civilians.<br />
I will always support the mission.<br />
I provide stability and continuity during war and peace.<br />
I support and defend the Constitution of the United States<br />
and consider it an honor to serve our nation and our <strong>Army</strong>.<br />
I live the <strong>Army</strong> values of loyalty, duty, respect, selfless<br />
service, honor, integrity, and personal courage.<br />
I am an <strong>Army</strong> civilian.
<strong>Army</strong> <strong>Working</strong> <strong>Capital</strong> <strong>Fund</strong> (<strong>AWCF</strong>)<br />
Fiscal Year (FY) 2014 Budget Estimates<br />
<strong>Army</strong> Overview<br />
Background<br />
<strong>Working</strong> capital funds were<br />
established by Congress to more<br />
effectively control and account for<br />
the cost of programs and work performed in<br />
the Department of Defense. Under the<br />
provisions of Title 10 United States Code,<br />
§ 2208, the Secretary of Defense may<br />
establish working capital funds to finance<br />
inventories of supplies and industrial-type<br />
activities that provide common services such<br />
as repair, manufacturing, or remanufacturing.<br />
Unlike profit-oriented commercial<br />
businesses, the revolving fund’s goal is to<br />
break even by returning any monetary gains<br />
to appropriated fund customers through<br />
lower rates or collecting any monetary losses<br />
from customers through higher rates.<br />
Revolving fund prices are generally stabilized<br />
Paratroopers fired a M777 howitzer<br />
or fixed during the year of execution to protect<br />
during a demonstration.<br />
customers from unforeseen fluctuations that<br />
would impact their ability to execute the programs approved by Congress.<br />
The basic tenet of the revolving fund structure is to create a customer-provider<br />
relationship between military operating units and support organizations. This<br />
relationship is designed to make managers of the <strong>Army</strong> <strong>Working</strong> <strong>Capital</strong> <strong>Fund</strong><br />
(<strong>AWCF</strong>) and decision-makers at all levels more aware of costs for goods and<br />
services.<br />
The <strong>Army</strong>’s revolving fund activities evolved from two separate types of funds.<br />
The first type, known as the Stock <strong>Fund</strong>, procured spare parts in volume to either<br />
sell to customers or hold in inventory. The second type, known as the Industrial<br />
<strong>Fund</strong>, provided industrial services to customers, such as depot maintenance,<br />
munitions and weapon systems component manufacturing, and ammunition<br />
storage. Both types of revolving funds were financed primarily by<br />
reimbursements from customer appropriated accounts.<br />
Figure 1 on the next page shows the interaction between customers’<br />
appropriated funds, <strong>AWCF</strong> business operations, and cash. Customer<br />
1
<strong>Army</strong> <strong>Working</strong> <strong>Capital</strong> <strong>Fund</strong> (<strong>AWCF</strong>)<br />
Fiscal Year (FY) 2014 Budget Estimates<br />
appropriated funding is synchronized with <strong>AWCF</strong> workload forecasts during<br />
budget development. During the year of execution, appropriated fund customers<br />
submit funded orders (1) to <strong>AWCF</strong> providers requesting services (repair,<br />
overhaul, or manufacturing) or supplies (spare or repair parts). This obligates<br />
appropriated funds. In step 2, <strong>AWCF</strong> Supply <strong>Management</strong> purchases inventory<br />
for resale to customers. Also in step 2, Industrial Operations orders materiel and<br />
hires labor, supporting the projected workload (CASH OUT). In step 3, the<br />
customer receives the completed product or service and a bill (4) for payment.<br />
The customer pays the <strong>AWCF</strong> (5) for the materiel or services (CASH IN). Proper<br />
pricing of inventory and services, and accurately forecasting workload allows a<br />
balance between CASH OUT and CASH IN. Variance between these actions<br />
results in either a gain or loss of <strong>AWCF</strong> cash. Gains are returned to customers<br />
through lower future prices while losses are recouped through higher future<br />
prices.<br />
Figure 1<br />
2
Introduction<br />
<strong>Army</strong> <strong>Working</strong> <strong>Capital</strong> <strong>Fund</strong> (<strong>AWCF</strong>)<br />
Fiscal Year (FY) 2014 Budget Estimates<br />
The FY 2014 <strong>AWCF</strong> budget request supports the <strong>Army</strong>’s vision to sustain and<br />
maintain a scalable and tailored force, recapitalize combat equipment, and reset<br />
assets to equip a robust, ready, regionally-engaged and responsive force<br />
structure. The <strong>AWCF</strong> directly supports the materiel readiness of operating units.<br />
The revolving fund structure encourages cost-effectiveness, flexibility, and<br />
adaptability to meet changing workload requirements in the year of execution. It<br />
also supports full cost visibility and full cost recovery while protecting<br />
appropriated fund customer accounts from year of execution price changes. The<br />
<strong>AWCF</strong> consists of the Supply <strong>Management</strong> and Industrial Operations activity<br />
groups, with operations spanning across seventeen cities and local areas within<br />
fourteen states. The exact locations are shown in each business activity's<br />
portion of the budget. The <strong>AWCF</strong> activities disbursed approximately $12.5 billion<br />
in FY 2012 to maintain the readiness and sustainability of military equipment.<br />
Performance Measures<br />
Key financial measures are net operating result, accumulated operating result,<br />
and unit cost.<br />
The net operating result (NOR) represents<br />
the difference between revenue and<br />
expenses within a fiscal year. Accumulated<br />
operating result (AOR) represents the<br />
summation of all operating gains or losses<br />
since activity group inception along with any<br />
prior period adjustments. Prices and rates<br />
are set at a level that brings the accumulated<br />
gains and losses to zero over the budget<br />
cycle. The unit cost is a metric primarily<br />
used in the Supply <strong>Management</strong> activity<br />
group to relate operating costs to each dollar<br />
of sales. It is measured by dividing gross<br />
operating cost (the sum of total obligations,<br />
depreciation expense, and credit) by gross<br />
sales. Adjusting the unit cost determines how<br />
much obligation authority may be distributed based on gross sales.<br />
A CH-47 Chinook takes off with a HMMWV<br />
sling-load.<br />
In addition to financial measures (NOR, AOR, and unit cost), operational<br />
measures assess how well the financial inputs reflected in the <strong>AWCF</strong> budget<br />
support <strong>Army</strong> strategic goals and operational readiness. Operational measures<br />
include productive yield (an indicator of whether direct labor employees can<br />
support projected workload) and stock availability (a measure of the ability of<br />
3
Welding on Letterkenny <strong>Army</strong> Depot’s<br />
equipment repair line.<br />
<strong>Army</strong> <strong>Working</strong> <strong>Capital</strong> <strong>Fund</strong> (<strong>AWCF</strong>)<br />
Fiscal Year (FY) 2014 Budget Estimates<br />
<strong>AWCF</strong> inventory to fill a customer’s requisition). These are identified within each<br />
activity group's narrative.<br />
Logistics Modernization Program<br />
The <strong>Army</strong>'s Logistics Modernization Program (LMP) provides a modernized<br />
logistics and finance solution that allows the U.S. <strong>Army</strong> Materiel Command<br />
(AMC) to provide world-class logistics readiness to Soldiers. LMP delivers a fully<br />
integrated suite of software and business processes, providing streamlined data<br />
on maintenance, repair and overhaul, finance, acquisition, spare parts, and<br />
materiel. It is the <strong>Army</strong>'s core logistics information technology (IT) initiative,<br />
replacing two logistics systems: the<br />
inventory management Commodity<br />
Command Standard System; and the depot<br />
and arsenal operations Standard Depot<br />
System. Additionally, LMP meets the <strong>Army</strong>'s<br />
IT logistics vision of transformation from<br />
legacy applications to a modernized logistics<br />
enterprise solution across AMC.<br />
LMP manages approximately four million<br />
transactions daily and is integrated with more<br />
than 70 DOD systems including interfaces<br />
with <strong>Army</strong>'s other enterprise resource<br />
planning systems currently under<br />
development: <strong>Army</strong> Enterprise Systems<br />
Integration Program; Global Combat Support<br />
System-<strong>Army</strong>; and General <strong>Fund</strong> Enterprise<br />
Business Systems. LMP is currently used by<br />
more than 21,000 users at more than 50<br />
<strong>Army</strong> and DOD locations. Starting in<br />
FY 2014, non-<strong>Army</strong> managed items inventory<br />
will migrate to LMP. Enhancements and<br />
system changes continue to be applied to LMP to ensure compliance with<br />
statutory and regulatory requirements.<br />
4
Activity Groups<br />
Supply <strong>Management</strong><br />
<strong>Army</strong> <strong>Working</strong> <strong>Capital</strong> <strong>Fund</strong> (<strong>AWCF</strong>)<br />
Fiscal Year (FY) 2014 Budget Estimates<br />
The Supply <strong>Management</strong> activity group buys and manages spare and repair<br />
parts for sale to its customers, primarily <strong>Army</strong> operating units. This activity group<br />
supports and builds readiness for today’s and tomorrow’s challenges. The<br />
<strong>Army</strong>’s equipment and operational readiness, and the strength to win the<br />
Nation’s wars, are directly linked to the availability of materiel. The activity group<br />
is managed by the Life Cycle <strong>Management</strong> Commands of the U.S. <strong>Army</strong> Materiel<br />
Command. Supply <strong>Management</strong> administers spare parts inventory for <strong>Army</strong><br />
managed items, non-<strong>Army</strong> managed items (NAMI) and war reserve secondary<br />
items. Supply <strong>Management</strong> consists of four major commodity groups: aviation<br />
and missile; communications-electronics; tank-automotive and armament; and<br />
NAMI. Pre-positioned war reserve materiel is retained in protected inventory and<br />
released to support deploying combat units. The war reserve stocks contain<br />
materiel from all commodity groups. As new equipment is added to the <strong>Army</strong>'s<br />
operational and training forces, new spare parts are also scheduled for inclusion<br />
in the Supply <strong>Management</strong> inventory.<br />
Industrial Operations<br />
The Industrial Operations activity group<br />
provides the <strong>Army</strong> an organic industrial<br />
capability to: conduct depot level<br />
maintenance, repair and upgrade; produce<br />
munitions and large caliber weapons; and<br />
store, maintain, and demilitarize materiel for<br />
all branches of DOD. Industrial Operations<br />
is comprised of thirteen government owned<br />
and operated installation activities, each<br />
with unique core competencies. These<br />
include five hard-iron maintenance depots,<br />
three arsenals, two munitions production<br />
facilities, and three storage sites. Although<br />
comprised of diverse organic industrial<br />
capabilities, the preponderance of workload<br />
and associated estimates in the Industrial<br />
Operations budget submission relate to<br />
depot level maintenance, repair, and<br />
100-ton gantry crane nears completion at<br />
Sierra <strong>Army</strong> Depot.<br />
upgrade. The complex operational<br />
environment continues to place tremendous<br />
demands on equipment, resulting in much higher usage rates than in routine<br />
5
<strong>Army</strong> <strong>Working</strong> <strong>Capital</strong> <strong>Fund</strong> (<strong>AWCF</strong>)<br />
Fiscal Year (FY) 2014 Budget Estimates<br />
peacetime operations. For example, in Afghanistan, usage rates are projected at<br />
approximately 2.5 times higher than comparable peacetime operations. These<br />
factors increase the maintenance requirements beyond what is typically<br />
budgeted. The Industrial Operations activities play an integral role in resetting<br />
equipment as it retrogrades from combat operations.<br />
The <strong>Army</strong>’s equipment Reset program is defined as a set of actions restoring<br />
equipment to a level of combat capability commensurate with a unit’s future<br />
mission. The Reset program ensures <strong>Army</strong> equipment employed in the war is<br />
replaced or restored for future missions. There are three components of Reset:<br />
replacement 1 , recapitalization 2 , and repair 3 . The Industrial Operations activity<br />
group is involved with both the recapitalization and repair efforts. The budget<br />
incorporates depot workload assumptions associated with the Reset program<br />
(Overseas Contingency Operations funding) and peacetime training operations.<br />
Budget Highlights<br />
Overview<br />
The FY 2014 <strong>AWCF</strong> budget request supports the <strong>Army</strong>’s plans to maintain and<br />
strengthen its war fighting readiness. This submission supports ongoing global<br />
efforts, as well as home-based training requirements. The <strong>AWCF</strong> has<br />
experienced record levels of sales and revenue due to wartime operations;<br />
however, this submission reflects reduced OPTEMPO.<br />
The budget assumes an overall reduced troop strength and a lower OPTEMPO<br />
level for the Nation’s continued engagement in combat operations in Afghanistan,<br />
resulting in reduced demands and sales forecasts. Based on the reduced troop<br />
strength and OPTEMPO for FY 2014, the Supply <strong>Management</strong> activity group<br />
projects Operation Enduring Freedom sales and demands at approximately<br />
40 percent of FY 2012 levels. For FY 2014 the Industrial Operations activity<br />
projects that new orders will approximate 71 percent of the FY 2012 level.<br />
1 The purchase of new equipment to replace battle losses, worn-out or obsolete equipment, and<br />
critical equipment deployed and left in theater, but needed for homeland defense, homeland<br />
security, and other critical missions.<br />
2 A rebuild effort that extends the equipment’s useful life by returning it to a near zero-mile/zerohour<br />
condition with either the original performance specifications or with upgraded performance<br />
specifications.<br />
3 A repair or overhaul effort that returns the equipment’s condition to the <strong>Army</strong> standard. It<br />
includes the Special Technical Inspection and Repair (STIR) program for aircraft.<br />
6
<strong>Army</strong> <strong>Working</strong> <strong>Capital</strong> <strong>Fund</strong> (<strong>AWCF</strong>)<br />
Fiscal Year (FY) 2014 Budget Estimates<br />
The sufficiency and predictability of resources is critical for accurately forecasting<br />
and executing workload. OPTEMPO assumptions assist in the development of<br />
the budget request, but as changes to these assumptions materialize, the<br />
projections for the <strong>AWCF</strong> can change significantly. To offset this risk, both<br />
activity groups will be able to adapt to changing workload forecasts, constraining<br />
or expanding costs as necessary. The Supply <strong>Management</strong> budget request<br />
includes variability target to support spares replacement for any surge in<br />
customer demands above projected levels. The Industrial Operations activity<br />
group budget request includes a mix of permanent, temporary, and termappointment<br />
employees, in addition to contract labor, to better respond to<br />
unanticipated increases or decreases in new orders.<br />
Personnel<br />
The <strong>AWCF</strong> civilian personnel posture reflects an overall decrease through<br />
FY 2014. Changes to personnel levels are discussed within the narrative of each<br />
activity group. Civilian and military end strength and civilian full time equivalents<br />
are shown in Table 1, below.<br />
Table 1 – Personnel<br />
FY 2012 FY 2013 FY 2014<br />
Supply <strong>Management</strong><br />
Civilian End Strength 2,019 2,025 2,035<br />
Full Time Equivalents 1,926 2,025 2,035<br />
Military End Strength 4 3 3<br />
Industrial Operations<br />
Civilian End Strength 24,460 23,111 22,367<br />
Full Time Equivalents 25,006 24,151 22,501<br />
Military End Strength 26 26 26<br />
Total<br />
Civilian End Strength 26,479 25,136 24,402<br />
Full Time Equivalents 26,932 26,176 24,536<br />
Military End Strength 30 29 29<br />
7
Revenue and Expenses<br />
<strong>Army</strong> <strong>Working</strong> <strong>Capital</strong> <strong>Fund</strong> (<strong>AWCF</strong>)<br />
Fiscal Year (FY) 2014 Budget Estimates<br />
Revenue is an indicator of the combined volume of work completed by the <strong>AWCF</strong><br />
activity groups. Expenses identify the cost of goods and services produced or sold.<br />
Both revenue and expenses are expected to decline in the budget year based on<br />
workload. Major expense drivers include cost of goods sold for Supply <strong>Management</strong><br />
and the cost of labor and materiel consumed in Industrial Operations. Table 2 and<br />
Chart 1 below show revenue and expenses for Supply <strong>Management</strong> and Industrial<br />
Operations.<br />
Table 2 - Revenue and Expenses<br />
($ Millions) FY 2012 FY 2013 FY 2014<br />
Revenue<br />
Supply <strong>Management</strong><br />
Gross Sales 8,895.5 7,700.4 7,053.5<br />
Less Credit 521.3 508.5 504.0<br />
Net Supply <strong>Management</strong> 8,374.1 7,191.9 6,549.5<br />
Industrial Operations 6,351.9 6,403.6 6,023.5<br />
Total Revenue 14,726.0 13,595.5 12,573.0<br />
Expenses<br />
Supply <strong>Management</strong> 8,581.7 7,316.5 6,937.1<br />
Industrial Operations 6,366.4 6,592.8 6,278.8<br />
Total Expenses 14,948.1 13,909.3 13,215.9<br />
Note: Total revenue above does not include appropriated funds for war reserve secondary items as<br />
shown on the Supply <strong>Management</strong> exhibit <strong>Fund</strong> 14, Revenue and Expense. Numbers may not add<br />
due to rounding.<br />
Chart 1 - Revenue and Expenses<br />
16,000<br />
$ Millions<br />
12,000<br />
8,000<br />
4,000<br />
0<br />
FY 2012 FY 2013 FY 2014<br />
Revenue 14,726.0 13,595.5 12,573.0<br />
Expenses 14,948.1 13,909.3 13,215.9<br />
8
<strong>Army</strong> <strong>Working</strong> <strong>Capital</strong> <strong>Fund</strong> (<strong>AWCF</strong>)<br />
Fiscal Year (FY) 2014 Budget Estimates<br />
Net and Accumulated Operating Results<br />
<strong>Financial</strong> performance is measured by comparing actual results to goals. The<br />
goal of the <strong>AWCF</strong> is to break even over time. <strong>Army</strong> considers several factors<br />
when determining the accumulated operating result (AOR) amount to return in<br />
the rates. Returning a large positive AOR balance in one year may cause the<br />
rates to drop significantly in that year and increase significantly in the following<br />
year. In addition, the <strong>Army</strong> reviews the cash balance and the projected balance<br />
for the budget year to determine if sufficient cash exists to return the gain to the<br />
customers. The Industrial Operations activity received approval to defer the<br />
return of $344.0 million of AOR pending resolution of potential prior year<br />
accounting issues related to inventory valuation. To prevent a significant rate<br />
increase to our customers, Supply <strong>Management</strong> is using projected excess cash<br />
to minimize rate increases in FY 2014. The Supply <strong>Management</strong> activity will not<br />
recover $487.8 million of FY 2014 AOR. Table 3 below shows the net and<br />
accumulated operating results for both Supply <strong>Management</strong> and Industrial<br />
Operations. Details can be found under the NOR and AOR section for each<br />
business area.<br />
Table 3 - Operating Results<br />
($ Millions) FY 2012 FY 2013 FY 2014<br />
Supply <strong>Management</strong><br />
Net Operating Result (207.5) (124.6) (387.6)<br />
Non-Recoverable AOR<br />
Accumulated Operating Result<br />
0.0<br />
24.4<br />
0.0<br />
(100.2)<br />
487.8<br />
0.0<br />
Industrial Operations<br />
Net Operating Result 42.0 (135.2) (202.3)<br />
Deferred AOR 0.0 0.0 (344.0)<br />
Accumulated Operating Result 681.5 546.2 0.0<br />
Note: Numbers may not add due to rounding.<br />
Customer Rates<br />
Each activity group has a unique rate structure. The Supply <strong>Management</strong> activity<br />
group adds a cost recovery rate (CRR) to the price of inventory items sold to<br />
recoup operating costs. Typical cost categories within the CRR include civilian<br />
pay, distribution depot costs, transportation costs, other Defense bills associated<br />
with supply operations, and costs of replacing inventory losses. The Industrial<br />
Operations activity group sets customer rates on a direct labor hour basis. The<br />
hourly composite rate recovers all costs, both direct and overhead. Activity<br />
group rates are stabilized so that the customer’s buying power is protected from<br />
price swings during the year of execution. Table 4 shows the Supply<br />
9
<strong>Army</strong> <strong>Working</strong> <strong>Capital</strong> <strong>Fund</strong> (<strong>AWCF</strong>)<br />
Fiscal Year (FY) 2014 Budget Estimates<br />
<strong>Management</strong> composite cost recovery rates and the Industrial Operations<br />
composite direct labor hour rates.<br />
Table 4 - Customer Rates<br />
FY 2012 FY 2013 FY 2014<br />
Supply <strong>Management</strong> 14.1% 12.8% 16.2%<br />
Industrial Operations $129.56 $136.01 $141.46<br />
Customer Rate Change<br />
The Supply <strong>Management</strong> customer rate change is expressed as the change in<br />
overhead costs weighted by sales revenue. Table 5 shows the customer rate<br />
change for both business areas.<br />
Table 5 - Price Change to Customer<br />
FY 2012 FY 2013 FY 2014<br />
Supply <strong>Management</strong> 1.3% (1.1%) (2.8%)<br />
Industrial Operations (11.6%) 5.0% 4.0%<br />
<strong>Fund</strong> Balance with Treasury<br />
The Defense <strong>Working</strong> <strong>Capital</strong> <strong>Fund</strong> (DWCF) <strong>Fund</strong> Balance with Treasury,<br />
account symbol 97X4930, is subdivided at the Treasury into five sub-numbered<br />
Treasury accounts. The <strong>Army</strong>’s account is 97X4930.001. The current balance of<br />
funds with Treasury is equal to the amount at the beginning of the fiscal year plus<br />
the cumulative fiscal-year-to-date amounts of collections, appropriations, and<br />
transfers-in minus the cumulative fiscal-year-to-date amounts of disbursements,<br />
withdrawals, and transfers-out. The <strong>AWCF</strong> is required to maintain a positive<br />
cash balance to prevent an Antideficiency Act violation under Title 31, United<br />
States Code, § 1517(a), Prohibited obligations and expenditures. Unlike<br />
appropriated funds, the <strong>AWCF</strong> cash balance is not equal to outstanding<br />
obligations. Cash on hand at Treasury must be sufficient to pay bills when due<br />
and should remain sufficient to support operational requirements plus six months<br />
of capital investment program disbursements. The operational requirement may<br />
include any positive accumulative operating result returned to customers, cash<br />
equal to undisbursed direct appropriations, and a commodity/market adjustment.<br />
The <strong>Army</strong> has included these adjustments, as well as a further adjustment that<br />
allows cash retention for large balances in undelivered orders (spare parts due-in<br />
from vendors) associated with high OPTEMPO that will be delivered after the<br />
budget year. Comparing the projected undelivered orders with pre-war<br />
undelivered orders provides a factor to increase the balance requirement.<br />
10
<strong>Army</strong> <strong>Working</strong> <strong>Capital</strong> <strong>Fund</strong> (<strong>AWCF</strong>)<br />
Fiscal Year (FY) 2014 Budget Estimates<br />
The cash balance is primarily affected by cash generated from operations but the<br />
balance is also impacted by appropriations, transfers, and withdrawals.<br />
Maintaining a proper cash balance is dependent on setting rates to recover full<br />
costs, including prior year losses, and accurately projecting workload.<br />
Cash from Operations<br />
The day-to-day operations of the fund consume and replenish cash. The<br />
FY 2014 cash plan includes all expected collections and disbursements from the<br />
operations of both the Supply <strong>Management</strong> and Industrial Operations activity<br />
groups, including appropriations and transfers. Chart 2 below displays<br />
collections and disbursements from operations and does not include<br />
appropriations and transfers. The change in collections from FY 2013 to<br />
FY 2014 is due to lower projected Supply <strong>Management</strong> sales to operating forces<br />
in Southwest Asia.<br />
Chart 2 - Cash from Operations<br />
18,000.0<br />
16,000.0<br />
14,000.0<br />
12,000.0<br />
$ Millions<br />
10,000.0<br />
8,000.0<br />
6,000.0<br />
4,000.0<br />
2,000.0<br />
0.0<br />
FY 2004 FY 2005 FY 2006 FY 2007 FY 2008 FY 2009 FY 2010 FY 2011 FY 2012 FY 2013 FY 2014<br />
Collections 12,248.6 14,199.6 14,053.0 14,628.9 16,360.0 16,188.8 16,084.0 13,743.0 12,897.2 11,138.9 10,601.8<br />
Disbursements 11,619.4 14,008.7 14,260.8 14,189.6 15,942.0 16,933.1 15,395.0 13,005.0 12,478.2 11,446.1 10,833.3<br />
11
Cash Transfers<br />
<strong>Army</strong> <strong>Working</strong> <strong>Capital</strong> <strong>Fund</strong> (<strong>AWCF</strong>)<br />
Fiscal Year (FY) 2014 Budget Estimates<br />
Since FY 2004 approximately $6.9 billion transferred from the <strong>AWCF</strong>. Table 6<br />
below provides the amount and the details of each transfer.<br />
Table 6 - Cash Transfers<br />
Year<br />
FY 2004<br />
Transfer<br />
To<br />
OMA<br />
DECA<br />
OMA<br />
Amount<br />
($ Millions)<br />
1,300.0<br />
41.6<br />
107.0<br />
Reason<br />
OIF/OEF 4<br />
DOD Decision<br />
Congressionally Directed<br />
FY 2005 OMA 700.0 OIF/OEF<br />
FY 2007<br />
WTCV<br />
RDTE<br />
107.0<br />
38.7<br />
MRAP 5 procurement<br />
GFEBS 6<br />
FY 2008<br />
OMA<br />
MPA<br />
OMA<br />
OMA<br />
MPA<br />
NGPA<br />
420.0<br />
30.0<br />
141.4<br />
658.7<br />
45.5<br />
154.3<br />
Congressionally Directed<br />
MPA FY 2005 PCS 7<br />
OIF/OEF<br />
OIF<br />
MPA FY 2008 Payroll<br />
NGPA 8 over-strength<br />
FY 2009<br />
FY 2010<br />
MPA<br />
OMA<br />
OMA<br />
MPA<br />
200.0<br />
823.0<br />
150.0<br />
130.3<br />
MPA FY 2008 PCS/Payroll<br />
Congressionally Directed<br />
Congressionally Directed<br />
MPA FY 2005 MERHCF 9<br />
FY 2011 OMA 700.0 Congressionally Directed<br />
FY 2012<br />
OMA<br />
OMA<br />
OMA<br />
600.0<br />
515.0<br />
25.2<br />
Total Transfers $6,887.7<br />
OEF<br />
Congressionally Directed<br />
MEDCOM 10<br />
4 (OIF/OEF) Operation Iraqi Freedom/Operation Enduring Freedom<br />
5 (MRAP) Mine Resistant Ambush Protected vehicle<br />
6 (GFEBS) General <strong>Fund</strong> Enterprise Business System<br />
7 (MPA PCS) Military Personnel, <strong>Army</strong> Appropriation Permanent Change of Station<br />
8 (NGPA) National Guard Military Personnel, <strong>Army</strong> Appropriation<br />
9 (MERHCF) Medicare-Eligible Retiree Health Care <strong>Fund</strong><br />
10 (MEDCOM) United States <strong>Army</strong> Medical Command war reserve secondary items<br />
12
<strong>Army</strong> <strong>Working</strong> <strong>Capital</strong> <strong>Fund</strong> (<strong>AWCF</strong>)<br />
Fiscal Year (FY) 2014 Budget Estimates<br />
The amounts transferred were used to assist other <strong>Army</strong> programs and were<br />
excess to <strong>AWCF</strong> requirements at the time of transfer. Through FY 2014 and the<br />
near future, no transferred cash must be returned; however, as future budgets<br />
are developed, some of this transferred cash may require reimbursement to<br />
support payments to commercial vendors when undelivered orders are received.<br />
The <strong>Army</strong> has helped mitigate the effect of these cash transfers by not allowing<br />
credit for carcasses returned by operating units in Afghanistan and by holding the<br />
Supply <strong>Management</strong> unit cost below 1.0 for an extended period.<br />
Base Realignment and Closure 2005 directed transfer of consumable item<br />
management to Defense Logistics Agency (DLA). DLA is reimbursing <strong>Army</strong> for<br />
consumable item on order and delivered after the transfer date. The <strong>AWCF</strong><br />
expects to receive cash transfers of $154.0 million and $118.0 million from DLA<br />
in FY 2013 and FY 2014, respectively.<br />
Chart 3 below displays the potential risk to the <strong>AWCF</strong> cash balance. Based on<br />
the projected cash balance and undelivered orders there is a low risk in<br />
FY 2014.<br />
Chart 3 - Risk to Cash<br />
10,000.0<br />
8,000.0<br />
$ Millions<br />
6,000.0<br />
4,000.0<br />
2,000.0<br />
0.0<br />
FY 2006 FY 2007 FY 2008 FY 2009 FY 2010 FY 2011 FY 2012 FY 2013 FY 2014<br />
Dues‐In 7,545.0 7,781.0 9,602.0 8,171.0 6,051.0 5,846.5 4,121.7 3,614.8 3,454.7<br />
Cash & Backorders 2,533.0 3,797.0 4,335.9 2,960.0 3,692.2 4,073.9 2,860.9 2,885.3 2,665.6<br />
Risk to Cash 5,012.0 3,984.0 5,266.1 5,211.0 2,358.8 1,772.6 1,260.8 729.4 789.1<br />
Note: FY 2013 and FY 2014 are projected<br />
13
Appropriations<br />
<strong>Army</strong> <strong>Working</strong> <strong>Capital</strong> <strong>Fund</strong> (<strong>AWCF</strong>)<br />
Fiscal Year (FY) 2014 Budget Estimates<br />
The <strong>AWCF</strong> has received or requested direct appropriations to purchase<br />
secondary items for <strong>Army</strong> Prepositioned Stocks (APS). War reserve secondary<br />
items support combat weapon systems prepositioned in the five APS locations.<br />
Overseas Contingency Operations funds are requested for secondary items to<br />
accompany the placement of Mine Resistant Ambush Protected vehicles into war<br />
reserve stocks. Table 7 below shows the appropriations received or requested<br />
by <strong>AWCF</strong>.<br />
Table 7 - Appropriations<br />
($ Millions) FY 2012 FY 2013 FY 2014<br />
War Reserve Secondary Items<br />
Base <strong>Fund</strong>ing 101.2 60.0 25.2<br />
Overseas Contingency Operations 54.0 42.6 44.7<br />
Total Appropriated <strong>Fund</strong>s 155.2 102.6 69.9<br />
End of Year Cash Balance<br />
Table 8 below shows total collections, disbursements, appropriations, transfers,<br />
and ending cash balances. The <strong>Army</strong>’s operating cash target is 7 to 10 days.<br />
The FY 2014 cash balance is projected to be within the target. Although no<br />
advance billings are included in the budget submission, the Supply <strong>Management</strong><br />
rate includes a negative cash surcharge of $244.4 million in FY 2014.<br />
Table 8 - Cash Balance<br />
($ Millions) FY 2012 FY 2013 FY 2014<br />
Disbursements 12,478.2 11,446.1 10,833.3<br />
Collections 12,897.2 11,138.9 10,601.8<br />
Net Outlays from Operations (419.0) 307.3 231.5<br />
Direct Appropriations 155.2 102.6 69.9<br />
Transfers In 0.0 154.0 118.0<br />
Transfers Out 1,140.2 0.0 0.0<br />
Total Net Outlays 566.0 50.6 43.6<br />
Ending Cash Balance 1,334.5 1,283.8 1,240.2<br />
10 days Cash Level 1,563.9 1,991.4 1,433.7<br />
7 days Cash Level 1,360.6 1,266.9 951.0<br />
Note: Positive net outlays decrease cash. Numbers may not add due to rounding.<br />
14
<strong>Army</strong> <strong>Working</strong> <strong>Capital</strong> <strong>Fund</strong> (<strong>AWCF</strong>)<br />
Fiscal Year (FY) 2014 Budget Estimates<br />
<strong>Capital</strong> Budget<br />
The <strong>AWCF</strong> activities develop and maintain operational capabilities by acquiring<br />
or replacing production equipment, executing minor construction projects, and<br />
developing software. New equipment is acquired to replace obsolete and<br />
unserviceable equipment, modernize production and maintenance processes,<br />
and eliminate environmental hazards. The cost of capital projects is recouped<br />
through depreciation expenses included in customer rates. Unlike the operating<br />
budget which contains the annual operating costs of each activity, the capital<br />
budget justifies the purchase of assets that equal or exceed a unit cost of<br />
$250,000 and have a useful life of two or more years.<br />
A more in-depth discussion and detailed exhibits are provided in the <strong>Capital</strong><br />
Budget section. Table 9 summarizes the <strong>AWCF</strong> capital investment program<br />
request.<br />
Table 9 - <strong>Capital</strong> Budget<br />
($ Millions) FY 2012 FY 2013 FY 2014<br />
Supply <strong>Management</strong> 32.6 59.2 71.8<br />
Industrial Operations 201.3 200.0 178.1<br />
Total <strong>Capital</strong> Budget 233.9 259.2 249.9<br />
Total Cash Outlays 208.5 232.0 248.6<br />
15
The <strong>Army</strong> Values<br />
Loyalty<br />
Duty<br />
Respect<br />
Selfless Service<br />
Honor<br />
Integrity<br />
Personal Courage<br />
16
Supply <strong>Management</strong><br />
Introduction<br />
T<br />
procure and repair spare parts. As suppliers deliver<br />
equipment components, the <strong>Army</strong> <strong>Working</strong> <strong>Capital</strong><br />
<strong>Fund</strong> expends cash and places spare parts in inventory<br />
to await customer demands. Filled customer demands<br />
result in the collection of sales revenue, which<br />
replenishes cash. The bulk of demands originate from<br />
Operation and Maintenance, <strong>Army</strong> customers, primarily<br />
<strong>Army</strong> operating forces, who request spare parts to<br />
maintain combat equipment readiness. The Supply<br />
<strong>Management</strong> enterprise synchronizes rates and budget<br />
assumptions with <strong>Army</strong> appropriated funding requests<br />
in support of Soldier and weapon systems readiness.<br />
<strong>Army</strong> <strong>Working</strong> <strong>Capital</strong> <strong>Fund</strong> (<strong>AWCF</strong>)<br />
Fiscal Year (FY) 2014 Budget Estimates<br />
he Supply <strong>Management</strong> activity group operates in a business-like<br />
environment by relying on sales revenue rather than appropriations to<br />
finance continuing operations. This enterprise uses contract authority to<br />
Mission:<br />
Provide the <strong>Army</strong> with<br />
inventory management<br />
of spare and repair<br />
parts in support of<br />
equipment sustainment,<br />
operational readiness,<br />
and combat capability.<br />
The <strong>Army</strong> prices spare parts based on the most recent acquisition cost from a<br />
commercial vendor or the most recent repair cost from a contract or organic<br />
source of repair. The price of each item includes a surcharge, known as the cost<br />
recovery rate (CRR), to recover the cost of <strong>AWCF</strong> operations. The CRR is set<br />
to:<br />
Recover the activity’s overhead costs such as payroll, supplies, contracts,<br />
storage, transportation, and depreciation<br />
Maintain a sufficient cash corpus to cover operating disbursements and<br />
six months of capital disbursements<br />
Break even over time<br />
The core financial measures for Supply <strong>Management</strong> are the net operating result<br />
(NOR) and accumulated operating result (AOR). The NOR measures the<br />
activity’s gain or loss within a single fiscal year and is used to monitor how<br />
closely the activity performs compared to its budget. The AOR measures the<br />
activity’s accumulated gains and losses since the fund’s inception. Rates are set<br />
during budget development to break even by bringing the AOR to zero over a<br />
budget cycle. This method returns accumulated gains through reduced rates and<br />
recovers accumulated losses through increased rates. Another core financial<br />
measure, the unit cost relates operating costs to each dollar of sales. The unit<br />
cost can be set at, above, or below 1.0 depending on projected sales volume.<br />
This metric is discussed in detail in the Unit Cost section.<br />
17
<strong>Army</strong> <strong>Working</strong> <strong>Capital</strong> <strong>Fund</strong> (<strong>AWCF</strong>)<br />
Fiscal Year (FY) 2014 Budget Estimates<br />
Efficiencies and Business Process<br />
Improvements<br />
Cost efficiency is an inherent attribute of the <strong>Army</strong> <strong>Working</strong> <strong>Capital</strong> <strong>Fund</strong>. The<br />
revolving fund construct promotes total cost visibility, full cost recovery, and<br />
fosters a business-like, competitive atmosphere. In the same way that<br />
commercial businesses focus on their bottom line profit, Supply <strong>Management</strong><br />
activities focus on their net operating result and other indicators to gauge the<br />
efficiency of their operations. Supply <strong>Management</strong> customers have benefited<br />
from direct efficiency goals and initiatives conducted in FY 2012 such as<br />
quarterly Senior Executive led due diligence reviews of inventory, and a<br />
continued emphasis on controlling overhead costs. In accordance with the DOD<br />
and the Office of <strong>Management</strong> and Budget emphasis on efficiencies, Supply<br />
<strong>Management</strong> has incorporated reductions for specific overhead elements, such<br />
as travel.<br />
Supply <strong>Management</strong> is also engaged in a Lean Six Sigma (LSS) project that<br />
focuses on aligning the inventory requirement forecasting process with inventory<br />
execution. The LSS partnership with the <strong>Army</strong> logistics community will improve<br />
the forecasting process and the accuracy of budgetary exhibits.<br />
Inventory <strong>Management</strong><br />
The <strong>Army</strong> calculates inventory requirements monthly based on projected<br />
demands and inventory levels. The quarterly stratification of inventory report<br />
(STRAT) is a point-in-time logistical view of inventory requirements and assets.<br />
The STRAT aligns inventory to fourteen requirements levels that are<br />
consolidated into four inventory segments: approved acquisition objective<br />
(AAO); economic retention stock; contingency retention stock; and potential<br />
reutilization stock. The AAO segment includes all inventory, both serviceable<br />
and unserviceable, and war reserve stocks needed for up to three years of<br />
demand from all customers. Inventory for essential items not meeting demand<br />
stockage criteria and inventory for end-of-item-life procurements is also included<br />
in the AAO. The economic retention segment includes inventory that is beyond<br />
the AAO level, but is determined by a mathematical model to be more<br />
18
<strong>Army</strong> <strong>Working</strong> <strong>Capital</strong> <strong>Fund</strong> (<strong>AWCF</strong>)<br />
Fiscal Year (FY) 2014 Budget Estimates<br />
economical to retain vice dispose. The contingency retention segment includes<br />
inventory that <strong>Army</strong> item managers retain for weapon system programs, foreign<br />
military sales, and diminishing manufacturing sources. Assets on-hand that do<br />
not stratify to the approved acquisition objective, economic retention stock or<br />
contingency retention stock segments will be stratified to potential reutilization<br />
stock for disposal review and validation by item managers.<br />
The stratification of inventory report (STRAT) values all <strong>Army</strong>-managed items<br />
(AMI) inventory at full standard price, regardless of repair condition. It does not<br />
reflect non-<strong>Army</strong> managed items (NAMI) inventory included on exhibit SM 4,<br />
Inventory Status. The SM 4 reflects the financial value of inventory using the<br />
accounting principle of moving average cost for AMI and latest acquisition cost<br />
for NAMI. Chart SM 1 – Total Inventory displays the segmentation of AMI<br />
inventory at standard price from the September STRAT for each fiscal year.<br />
Chart SM 1 – Total Inventory<br />
25,000<br />
20,000<br />
15,000<br />
$ Millions<br />
10,000<br />
5,000<br />
0<br />
FY 2006 FY 2007 FY 2008 FY 2009 FY 2010 FY 2011 FY 2012<br />
Total Inventory 20,700 22,180 21,535 21,821 20,717 20,645 20,470<br />
Potential Reutilization 1,570 1,320 1,431 2,131 1,641 1,706 2,072<br />
Contingency Retention 1,520 2,340 1,537 1,265 1,171 722 739<br />
Economic Retention 1,190 1,560 1,881 1,565 1,541 1,340 1,300<br />
Approved Acquisition Objective 16,420 16,960 16,686 16,860 16,364 16,877 16,359<br />
The <strong>Army</strong> continuously takes proactive measures to ensure that future inventory<br />
levels are accurately forecasted to meet future demands. The <strong>Army</strong> will continue<br />
to review and validate its requirements versus inventory levels to ensure it is<br />
buying and repairing items that are needed by its customers, and not retaining<br />
excess inventory.<br />
19
<strong>Army</strong> <strong>Working</strong> <strong>Capital</strong> <strong>Fund</strong> (<strong>AWCF</strong>)<br />
Fiscal Year (FY) 2014 Budget Estimates<br />
Functional Description<br />
Supply <strong>Management</strong> buys and manages an operating inventory of <strong>Army</strong>-Managed<br />
and non-<strong>Army</strong> managed spare and repair parts for sale to customers. It also<br />
maintains a protected inventory of spares in <strong>Army</strong> Prepositioned Stocks (APS). The<br />
<strong>AWCF</strong> operating inventory is stored and maintained primarily at three types of<br />
locations:<br />
<br />
<br />
<br />
Tactical – at more than 200 battalion supply support activities (SSA) under the<br />
control of Sustainment Brigade Commanders. These Soldier-manned SSA<br />
provide spares supporting the immediate needs of combat and combat<br />
support battalions and companies. The quantity of inventory items is limited<br />
to an amount capable of transport by unit organic vehicles or aircraft.<br />
Installation – at more than 150 <strong>Army</strong> installation SSA under the control of the<br />
installation Director of Logistics. These activities provide a means to<br />
retrograde unneeded materiel from tactical SSA to meet other <strong>Army</strong><br />
requirements. They also stock back-up inventory to meet tactical units'<br />
requirements that exceed storage capacity. When deployed to a contingency<br />
theater of operations, tactical activities receive back-up support from a theater<br />
distribution center established by the deployed force command to centrally<br />
receive, redistribute, and retrograde spares as required.<br />
National – at Defense Logistics Agency distribution depots and <strong>Army</strong><br />
maintenance depots. This inventory provides a source of rapid replenishment<br />
to lower level stockage locations and for the immediate needs of the <strong>Army</strong>’s<br />
maintenance depots.<br />
The <strong>AWCF</strong> protected inventory is contained in the APS located in the United States,<br />
Europe, South Korea, Kuwait, and stored aboard ships afloat off Guam and Diego<br />
Garcia. Prepositioned war reserve materiel is retained in protected inventory and<br />
released to outfit combat and combat support units deploying to perform combat,<br />
peacekeeping, or other contingency operations.<br />
20
<strong>Army</strong> <strong>Working</strong> <strong>Capital</strong> <strong>Fund</strong> (<strong>AWCF</strong>)<br />
Fiscal Year (FY) 2014 Budget Estimates<br />
Activity Group Composition<br />
Figure SM 1 below displays the locations of Headquarters, U.S. <strong>Army</strong> Materiel<br />
Command (AMC), each Life Cycle <strong>Management</strong> Command (LCMC) Headquarters,<br />
and the U.S. <strong>Army</strong> Sustainment Command (ASC). Each LCMC acquires and<br />
manages consumable supplies and spare parts for distinct categories of weapon<br />
systems. ASC acquires and maintains the <strong>Army</strong> Prepositioned Stocks, which contain<br />
materiel from each LCMC.<br />
Figure SM 1 - Supply <strong>Management</strong> locations<br />
U.S. <strong>Army</strong> Sustainment<br />
Command<br />
Rock Island, IL<br />
TACOM LCMC<br />
Warren, MI<br />
TACOM LCMC<br />
Natick, MA<br />
CECOM LCMC<br />
Aberdeen Proving<br />
Ground, MD<br />
AMCOM LCMC<br />
Huntsville, AL<br />
<strong>Army</strong> Materiel Command<br />
Headquarters,<br />
Huntsville, AL<br />
The AMC mission is complex and ranges from developing sophisticated weapon<br />
systems, to advanced research, to maintaining and distributing spare parts. AMC’s<br />
mission is best summarized by three core competencies: acquisition excellence,<br />
logistics power projection, and technology generation and application. To develop,<br />
buy, and maintain state-of-the-art materiel for the <strong>Army</strong>, AMC works closely with<br />
industry, colleges and universities, the other Services, and other government<br />
agencies.<br />
The TACOM LCMC (Tank-automotive and Armaments LCMC) primary mission is to<br />
develop, acquire, field, and sustain Soldier and ground systems through the<br />
integration of effective and timely acquisition, logistics, and cutting-edge technology.<br />
The TACOM LCMC item managers support a diverse set of product lines through<br />
their life cycles, ranging from tracked combat and wheeled tactical vehicles,<br />
armaments, and watercraft, to Soldier-specific gear and biological/chemical<br />
equipment. Major weapon systems supported include the M1 Abrams Tank,<br />
21
<strong>Army</strong> <strong>Working</strong> <strong>Capital</strong> <strong>Fund</strong> (<strong>AWCF</strong>)<br />
Fiscal Year (FY) 2014 Budget Estimates<br />
M2 Bradley Fighting Vehicle, Mine Resistant Ambush Protected (MRAP) Vehicle,<br />
HMMWV, and Stryker Armored Vehicle. TACOM Life Cycle <strong>Management</strong> Command<br />
(LCMC) has the clothing and heraldry mission that is responsible for providing<br />
clothing and heraldry products to Soldiers, units, and veterans. Included in the<br />
TACOM LCMC is a small retail business of high demand non-<strong>Army</strong> managed items<br />
(NAMI). NAMI overhead operations, including 10 civilian personnel, will fully<br />
transition to the <strong>AWCF</strong> in FY 2014. With an authorized level of 814 civilian personnel<br />
in FY 2014, TACOM LCMC Headquarters activities are located at Detroit Arsenal in<br />
Warren, Michigan and U.S. <strong>Army</strong> Soldier Systems Center in Natick, Massachusetts.<br />
The AMCOM LCMC (Aviation and Missile LCMC) mission is to develop, acquire,<br />
field, and sustain aviation, missile, and unmanned vehicle systems, and to ensure<br />
system readiness with seamless transition to<br />
combat operations. Major weapon systems<br />
supported include the AH-64 Apache, UH-60<br />
Black Hawk, CH-47 Chinook, OH-58 Kiowa<br />
Warrior, Multiple Launch Rocket System,<br />
and Patriot missile. With an authorized level<br />
of 535 civilian personnel in FY 2014,<br />
AMCOM LCMC Headquarters is located at<br />
Redstone Arsenal in Huntsville, Alabama.<br />
AMCOM has operational control of all<br />
aviation logistic management functions at<br />
Fort Rucker, Alabama, home of the <strong>Army</strong><br />
Aviation Center.<br />
Petroleum specialists fueled an OH-58<br />
Kiowa Warrior and manned the fire<br />
extinguisher.<br />
The CECOM LCMC (Communications-<br />
Electronics LCMC) Headquarters mission<br />
is to develop, acquire, field, and sustain<br />
Command, Control, Communications, Computers, and Intelligence, Surveillance,<br />
and Reconnaissance capabilities for the <strong>Army</strong>. With an authorized level of 686<br />
personnel in FY 2014, CECOM LCMC Headquarters is located at Aberdeen<br />
Proving Ground, Maryland.<br />
The U.S. <strong>Army</strong> Sustainment Command (ASC) mission is to synchronize<br />
distribution and sustainment of materiel to and from the field. <strong>Army</strong><br />
Prepositioned Stocks are acquired and maintained as a part of this mission.<br />
These stocks include combat equipment and supplies and humanitarian mission<br />
stocks at worldwide land and sea-based positions. The ASC is located at Rock<br />
Island Arsenal, Illinois.<br />
22
<strong>Army</strong> <strong>Working</strong> <strong>Capital</strong> <strong>Fund</strong> (<strong>AWCF</strong>)<br />
Fiscal Year (FY) 2014 Budget Estimates<br />
Budget Highlights<br />
Assumptions<br />
The budget represents a business plan that<br />
supports Soldier and weapon systems<br />
readiness for both peacetime training and<br />
wartime operating requirements. FY 2014<br />
estimates assume reduced troop strength and<br />
lower OPTEMPO level in Operation Enduring<br />
Freedom (OEF) of approximately 40 percent of<br />
FY 2012 OEF levels. This results in lower<br />
levels of supply demands and sales. If<br />
OPTEMPO levels during the year of execution<br />
exceed budget estimates, variability target is<br />
included in the budget to ensure supply<br />
contract authority is available to remain ready<br />
and responsive to changing operational<br />
requirements. Variability target is further<br />
discussed in the Operating Contract Authority<br />
section.<br />
A combat observation lasing team called in<br />
illumination rounds from nearby mortars during<br />
a training exercise at Fort Bragg, NC.<br />
Personnel<br />
Civilian end strength in FY 2014 reflects the transfer of 10 civilian spaces<br />
overseeing the non-<strong>Army</strong> managed items mission from appropriated funds to the<br />
<strong>AWCF</strong>. Manpower levels include secondary item managers, logistics<br />
management specialists, and general and administrative support positions.<br />
Military end strength is three in FY 2014.<br />
Chart SM 2 - Civilian Personnel<br />
2,500<br />
2,000<br />
1,500<br />
1,000<br />
500<br />
0<br />
FY 2012 FY 2013 FY 2014<br />
End Strength 2,019 2,025 2,035<br />
FTE 1,926 2,025 2,035<br />
23
<strong>Army</strong> <strong>Working</strong> <strong>Capital</strong> <strong>Fund</strong> (<strong>AWCF</strong>)<br />
Fiscal Year (FY) 2014 Budget Estimates<br />
Sales<br />
Sales and credit in this submission are impacted<br />
by reduced Overseas Contingency Operations<br />
(OCO) activity. Sales reflect income from<br />
operations and do not include direct<br />
appropriations for war reserve materiel and<br />
inventory augmentation. Currently, credit is not<br />
allowed for materiel returns in theater. Sales are<br />
displayed on several exhibits: <strong>Fund</strong> 14,<br />
Revenue and Costs, <strong>Fund</strong> 11, Source of New<br />
Orders and Revenue, and SM 1, Supply<br />
<strong>Management</strong> Summary (sales net of credit).<br />
Expenses<br />
Total expenses are projected to decrease in<br />
FY 2014 due to reductions in cost of goods<br />
sold. Variable operations costs, such as<br />
transportation and storage, are also<br />
anticipated to decrease in conjunction with<br />
reduced OCO sales. Continued emphasis on<br />
efficiencies and reduced rates for Defense<br />
Logistics Agency services will result in<br />
decreased fixed overhead expenses in<br />
FY 2014. Expenses are displayed on exhibit<br />
<strong>Fund</strong> 14, Revenue and Costs.<br />
Chart SM 3 - Gross Sales<br />
10,000<br />
8,000<br />
$ Millions<br />
6,000<br />
4,000<br />
2,000<br />
0<br />
FY 2012 FY 2013 FY 2014<br />
Gross Sales 8,895.5 7,700.4 7,053.5<br />
Credit 521.3 508.5 504.0<br />
Chart SM 4 - Expenses<br />
10,000<br />
$ Millions<br />
8,000<br />
6,000<br />
4,000<br />
2,000<br />
0<br />
FY 2012 FY 2013 FY 2014<br />
Total Expenses 8,581.7 7,316.5 6,937.1<br />
Operating Contract Authority (Hardware)<br />
This budget requests operating contract authority for the acquisition and repair of<br />
replenishment spare parts and for the cost of operating the Supply <strong>Management</strong><br />
enterprise. Contract authority requirements are projected to decrease in<br />
FY 2014 in anticipation of reduced customer demands due to lower OPTEMPO.<br />
Variability target is the projected amount of additional cost authority beyond<br />
budgeted levels reflected on exhibit SM 1 that would allow for rapid response to<br />
variances in costs or changes in customer demands during the execution year if<br />
needed. Operating contract authority is displayed on exhibits SM 1, Supply<br />
<strong>Management</strong> Summary and SM 3b, Operating Requirements by Weapon<br />
System.<br />
24
<strong>Army</strong> <strong>Working</strong> <strong>Capital</strong> <strong>Fund</strong> (<strong>AWCF</strong>)<br />
Fiscal Year (FY) 2014 Budget Estimates<br />
Chart SM 5 - Contract Authority<br />
8,000<br />
6,000<br />
$ Millions<br />
4,000<br />
2,000<br />
0<br />
FY 2012 FY 2013 FY 2014<br />
Variability Target 1,421.9 1,513.2<br />
Contract Authority 5,463.3 5,461.9 5,301.3<br />
Inventory<br />
Inventory values shown in chart SM 6, include Chart SM 6 - Inventory<br />
operational inventory, carcasses awaiting<br />
repair, inventory required beyond the budget<br />
25,000<br />
year, economic and contingency retention<br />
stock, and secondary items included in war<br />
20,000<br />
reserve. Spares inventory levels are sufficient<br />
15,000<br />
to ensure high stock availability for war efforts.<br />
Supply <strong>Management</strong> is continuing its effort to<br />
10,000<br />
decrease inventory by reducing inactive<br />
5,000<br />
inventory, disposing of dormant stock, and<br />
reducing replenishment below sales. <strong>Financial</strong><br />
0<br />
FY 2012 FY 2013 FY 2014<br />
values of inventory include non-<strong>Army</strong> managed<br />
items (NAMI) at latest acquisition cost and<br />
Inventory 20,682.0 19,689.4 19,558.8<br />
<strong>Army</strong>-managed items at moving average cost.<br />
Moving average cost is the valuation method used in the Logistics Modernization<br />
Program (LMP). NAMI inventory will migrate to LMP in FY 2014. Total inventory is<br />
understated by $1.2 billion due to an abnormal accounting value for NAMI inventory<br />
in FY 2012. This abnormal balance will be corrected in FY 2013. Supply<br />
<strong>Management</strong> will continue working to reduce on-order and on-hand excess<br />
inventory. Inventory is displayed on exhibit SM 4, Inventory Status.<br />
$ Millions<br />
25
<strong>Army</strong> <strong>Working</strong> <strong>Capital</strong> <strong>Fund</strong> (<strong>AWCF</strong>)<br />
Fiscal Year (FY) 2014 Budget Estimates<br />
Operating Results<br />
The net operating result (NOR) represents the difference between revenue and<br />
expenses within a fiscal year. The accumulated operating result (AOR)<br />
represents the summation of all operating gains and losses since activity group<br />
inception along with any prior period adjustments. The <strong>AWCF</strong> operates on a<br />
break-even basis during the budget cycle. To prevent a significant rate increase<br />
to our customers, Supply <strong>Management</strong> is using projected excess cash to<br />
minimize rate increases in FY 2014. The Supply <strong>Management</strong> activity will not<br />
recover $487.8 million of FY 2014 AOR. In the next budget cycle, Supply<br />
<strong>Management</strong> will evaluate its AOR projections, cash position, and impact on<br />
FY 2015 rates to determine the amount of AOR to recover. The NOR and AOR<br />
are displayed on exhibit <strong>Fund</strong> 14, Revenue and Costs.<br />
Table SM 1 - Operating Results<br />
($ Millions) FY 2012 FY 2013 FY 2014<br />
Net Operating Result (207.5) (124.6) (387.6)<br />
Non-Recoverable AOR 0.0 0.0 487.8<br />
Accumulated Operating Result 24.4 (100.2) 0.0<br />
Cost Recovery Rate<br />
The Supply <strong>Management</strong> cost recovery rate (CRR) is set to recover full costs.<br />
Typical costs recovered include civilian pay, distribution depot costs,<br />
transportation costs, other Defense bills associated with supply operations, and<br />
costs of replacing inventory washouts. The CRR calculation in FY 2014 has<br />
changed to reflect a DOD standardized rate-setting methodology. This new<br />
method changes the basis of overhead allocation from materiel costs to sales<br />
revenue. The FY 2014 CRR includes a negative cash surcharge of<br />
$244.4 million due to projected excess cash, as well as reduced rates for<br />
Defense Logistics Agency services. The DOD standardized rate-setting<br />
methodology also changed the price change to customer calculation. The price<br />
change to customer is now expressed as the change in overhead costs weighted<br />
by sales revenue and is not weighted by the change in sales volume.<br />
Table SM 2 – Cost Recovery Rate and Price Change<br />
FY 2012 FY 2013 FY 2014<br />
Cost Recovery Rate (Previous Method) 14.1% 12.8%<br />
Cost Recovery Rate (Standardized Method) 16.2%<br />
Price Change to Customer (Previous Method) 1.3% (1.1%)<br />
Price Change to Customer (Standardized Method) (2.8%)<br />
26
<strong>Army</strong> <strong>Working</strong> <strong>Capital</strong> <strong>Fund</strong> (<strong>AWCF</strong>)<br />
Fiscal Year (FY) 2014 Budget Estimates<br />
Unit Cost<br />
The unit cost is a metric to relate operating costs to each dollar of sales. As<br />
recommended in the Government Accountability Office (GAO) report 10-480, the<br />
<strong>Army</strong> continues to evaluate and adjust the unit cost as necessary to support<br />
contingency operations. A unit cost equal to 1.0 means there is a one-for-one<br />
replacement of inventory sold. A unit cost below 1.0 means that the enterprise is<br />
reducing inventory by selling and not replenishing. A unit cost above 1.0 means that<br />
Supply <strong>Management</strong> is growing inventory levels by buying above the current sales<br />
level. The unit cost of less than 1.0 from FY 2012 through FY 2014 indicates a<br />
consistent effort to constrain inventory based on projected declining sales volume.<br />
This submission reflects a budgeted unit cost that may not be fully executed. Chart<br />
SM 7 shows unit cost for FY 2012 through FY 2014.<br />
Chart SM 7 - Unit Cost<br />
1.00<br />
0.75<br />
Ratio<br />
0.50<br />
0.25<br />
0.00<br />
FY 2012 FY 2013 FY 2014<br />
Unit Cost 0.921 0.910 0.974<br />
Unit cost = Obligations + Credit + Depreciation expense<br />
Gross sales<br />
27
<strong>Army</strong> <strong>Working</strong> <strong>Capital</strong> <strong>Fund</strong> (<strong>AWCF</strong>)<br />
Fiscal Year (FY) 2014 Budget Estimates<br />
Collections, Disbursements, and Outlays<br />
Collections are projected based on Chart SM 8 - Cash <strong>Management</strong><br />
sales and changes in accounts<br />
receivable. Disbursements are<br />
8,000<br />
projected based on monthly<br />
operating expenses, changes in<br />
6,000<br />
accounts payable, and <strong>Capital</strong><br />
Investment Program obligations.<br />
4,000<br />
Under the internal work performed<br />
process in the Logistics<br />
2,000<br />
Modernization Program (LMP),<br />
there are no collections or<br />
0<br />
FY 2012 FY 2013 FY 2014<br />
disbursements between the Supply Collections 7,874.8 6,098.6 5,861.9<br />
<strong>Management</strong> and Industrial<br />
Disbursements 6,571.7 5,562.3 5,321.0<br />
Operations activity groups as LMP<br />
Net Outlays (1,303.2) (536.3) (540.8)<br />
treats both entities as one<br />
company. This business process happens to result in a decreased net outlay for<br />
the Supply <strong>Management</strong> activity, which is balanced by an increased net outlay<br />
for the Industrial Operations activity.<br />
Performance Measurement<br />
Stock Availability<br />
Supplying and maintaining the <strong>Army</strong>’s equipment remain key components of<br />
readiness. Stock availability is administered through adequate funding of<br />
hardware, proper management of the supply chain, and reliable oversight of<br />
materiel stockage requirements. Chart SM 9 displays stock availability at the end<br />
of each quarter in FY 2012 as at or above the 85 percent goal.<br />
Chart SM 9 – Stock Availability (SA)<br />
100.0%<br />
$ Millions<br />
75.0%<br />
Percent<br />
50.0%<br />
25.0%<br />
0.0%<br />
1st Qtr 2nd Qtr 3rd Qtr 4th Qtr<br />
SA 85.0% 86.5% 87.0% 85.3%<br />
28
<strong>Army</strong> <strong>Working</strong> <strong>Capital</strong> <strong>Fund</strong> (<strong>AWCF</strong>)<br />
Fiscal Year (FY) 2014 Budget Estimates<br />
Non-Mission Capable Rate, Supply<br />
The non-mission capable rate, supply<br />
(NMCRS) value represents the percent<br />
of time a weapon system is not mission<br />
capable due to lack of critical spare parts.<br />
The <strong>AWCF</strong> goal is to maintain NMCRS at<br />
or below five percent. Chart SM 10<br />
shows composite NMCRS rates achieved<br />
at the end of each quarter in FY 2012.<br />
NMCRS by weapon system is displayed<br />
on exhibit SM 3b, Operating<br />
Requirements by Weapon System.<br />
Customer Backorders<br />
Backorders are expected to decrease through FY 2014 with reductions due to both<br />
materiel deliveries and reduced demands from Overseas Contingency Operations<br />
customers. Customer backorders for the end of each fiscal year are displayed on<br />
exhibit <strong>Fund</strong> 11, Source of New Orders and Revenue.<br />
Chart SM 11 – Customer Backorders<br />
2,000<br />
Chart SM 10 - Non-Mission Capable Rate, Supply<br />
Percent<br />
4.0%<br />
3.0%<br />
2.0%<br />
1.0%<br />
0.0%<br />
1st Qtr 2nd Qtr 3rd Qtr 4th Qtr<br />
NMCS 2.8% 3.3% 2.5% 3.1%<br />
1,500<br />
$ Millions<br />
1,000<br />
500<br />
0<br />
FY 2012 FY 2013 FY 2014<br />
Backorders 1,526.4 1,601.5 1,425.4<br />
29
<strong>Army</strong> <strong>Working</strong> <strong>Capital</strong> <strong>Fund</strong> (<strong>AWCF</strong>)<br />
Fiscal Year (FY) 2014 Budget Estimates<br />
Supply <strong>Management</strong> Workload<br />
Table SM 3 below displays Supply <strong>Management</strong> workload drivers. The decreases in<br />
requisitions received and issues completed are based on deployed force activity<br />
assumptions. A standardized method to report workload drivers was developed after<br />
the deployment of the Logistics Modernization Program to the Life Cycle<br />
<strong>Management</strong> Commands and is reflected in this submission.<br />
Table SM 3 - Supply <strong>Management</strong> Workload<br />
Supply <strong>Management</strong> Workload FY 2012 FY 2013 FY 2014<br />
Types of Items Managed 103,800 110,386 108,506<br />
Requisitions Received 771,935 652,354 602,136<br />
Issues Completed 594,236 578,849 531,772<br />
Procurement Receipts 50,780 67,855 64,505<br />
Contracts Awarded 14,333 13,878 13,073<br />
Undelivered Orders<br />
Undelivered orders represent goods and services ordered, but not yet received<br />
by the <strong>AWCF</strong>. A sufficient cash balance is required to pay suppliers upon receipt<br />
of these orders. As shown in the chart below, undelivered orders are projected<br />
to decrease through FY 2014 due to continued materiel deliveries and decreased<br />
new materiel obligations based on lower deployed force assumptions.<br />
Chart SM 12 - Undelivered Orders<br />
5,000<br />
4,000<br />
$ Millions<br />
3,000<br />
2,000<br />
1,000<br />
0<br />
FY 2012 FY 2013 FY 2014<br />
Undelivered Orders 4,121.7 3,614.8 3,454.7<br />
30
Appropriations<br />
<strong>Army</strong> <strong>Working</strong> <strong>Capital</strong> <strong>Fund</strong> (<strong>AWCF</strong>)<br />
Fiscal Year (FY) 2014 Budget Estimates<br />
War reserve equipment positioned without secondary items would significantly<br />
jeopardize the <strong>Army</strong>’s ability to complete its combat missions successfully. The<br />
secondary items purchased for war reserves support important combat weapon<br />
systems such as M1 Abrams Tank, M2 Bradley Fighting Vehicle, artillery<br />
howitzers, rocket launchers, and HMMWV. FY 2012 through FY 2014 Overseas<br />
Contingency Operations (OCO) funds are requested to purchase secondary<br />
items to accompany the placement of Mine Resistant Ambush Protected<br />
Vehicles into war reserve stocks. The <strong>Army</strong> began transferring war reserve<br />
inventory for the U.S. <strong>Army</strong> Medical Command from <strong>AWCF</strong> to general funds in<br />
FY 2012. Starting in FY 2013, funding for this requirement is requested as part<br />
of the Operation and Maintenance, <strong>Army</strong> budget. Appropriations are displayed<br />
on exhibit <strong>Fund</strong> 14, Revenue and Costs. War reserve inventory is displayed on<br />
exhibits SM 4, Inventory Status and SM 6, War Reserve Materiel.<br />
Table SM 4 - Appropriations<br />
($ Millions) FY 2012 FY 2013 FY 2014<br />
War Reserve Secondary Items 101.2 60.0 25.2<br />
OCO <strong>Fund</strong>s 54.0 42.6 44.7<br />
Total Appropriated <strong>Fund</strong>s 155.2 102.6 69.9<br />
War reserve secondary items improve <strong>Army</strong>'s ability to meet<br />
global missions by sustaining the deployed combat force until<br />
CONUS-based re-supply commences.<br />
31
<strong>Army</strong> <strong>Working</strong> <strong>Capital</strong> <strong>Fund</strong><br />
Fiscal Year (FY) 2014 Budget Estimates<br />
Supply <strong>Management</strong><br />
Revenue and Costs<br />
($ in Millions)<br />
FY 2012 FY 2013 FY 2014<br />
Revenue<br />
AMI Sales 6,972.0 6,048.4 5,536.6<br />
NAMI Sales 1,910.0 1,650.0 1,514.8<br />
AMC MOB Sales 13.4 2.0 2.0<br />
Total Gross Sales 8,895.5 7,700.4 7,053.5<br />
Credit and Allowances 521.3 508.5 504.0<br />
Net Sales 8,374.1 7,191.9 6,549.5<br />
Other Income 155.2 102.6 69.9<br />
War Reserve-Secondary Items 155.2 102.6 69.9<br />
Total Income 8,529.3 7,294.6 6,619.3<br />
Costs<br />
Cost of Materiel Sold from Inventory<br />
AMI 5,741.8 4,778.6 4,494.3<br />
NAMI 1,645.6 1,407.4 1,288.8<br />
AMC MOB 13.4 2.0 2.0<br />
Total Cost of Materiel Sold from Inventory 7,400.9 6,188.0 5,785.1<br />
Inventory Losses/Obsolescence 87.5 90.4 84.8<br />
Salaries and Wages Total 193.8 194.7 198.4<br />
Military Personnel Compensation & Benefits 0.2 0.2 0.2<br />
Civilian Personnel Compensation & Benefits 193.6 194.6 198.3<br />
Travel & Transportation of Personnel 2.0 1.6 1.6<br />
Materiel & Supplies (For Internal Operations) 0.4 0.8 0.8<br />
Equipment 0.0 1.0 1.0<br />
Other Purchases from Revolving <strong>Fund</strong>s 305.4 281.8 258.7<br />
Transportation of Things 104.6 103.0 113.7<br />
Depreciation - <strong>Capital</strong> 84.2 86.9 86.9<br />
Printing and Reproduction 0.0 0.0 3.4<br />
Advisory and Assistance Services 17.6 6.8 7.5<br />
Rent, Communication, Utilities & Misc. Charges 1.3 5.7 5.7<br />
Other Purchased Services 384.0 355.9 389.4<br />
Total Costs 8,581.7 7,316.5 6,937.1<br />
Operating Result (52.3) (21.9) (317.7)<br />
Other Changes Affecting NOR:<br />
Less Direct <strong>Fund</strong>ing (155.2) (102.6) (69.9)<br />
Net Operating Result (207.5) (124.6) (387.6)<br />
Prior Year AOR 231.9 24.4 (100.2)<br />
Non-Recoverable AOR 0.0 0.0 487.8<br />
Accumulated Operating Result 24.4 (100.2) 0.0<br />
32<br />
EXHIBIT FUND 14<br />
REVENUE AND COSTS
<strong>Army</strong> <strong>Working</strong> <strong>Capital</strong> <strong>Fund</strong><br />
Fiscal Year (FY) 2014 Budget Estimates<br />
Supply <strong>Management</strong><br />
Source of New Orders and Revenue<br />
($ in Millions)<br />
FY 2012 FY 2013 FY 2014<br />
1. New Orders<br />
a. Orders from DOD Components:<br />
Department of <strong>Army</strong><br />
Operation & Maintenance, <strong>Army</strong> 5,838.3 5,792.2 5,013.0<br />
Operation & Maintenance, ARNG 621.8 486.2 536.8<br />
Operation & Maintenance, AR 75.7 84.1 70.0<br />
Subtotal, O&M: 6,535.8 6,362.4 5,619.8<br />
Industrial Operations Business 315.5 521.7 415.3<br />
Procurement Appropriations 247.7 135.7 119.3<br />
RDT&E 1.4 2.6 2.3<br />
All Other <strong>Army</strong> 52.5 108.5 100.7<br />
Subtotal, Department of the <strong>Army</strong>: 7,152.9 7,130.9 6,257.3<br />
Department of Navy 116.5 107.0 125.7<br />
Department of Air Force 222.7 197.7 193.9<br />
US Marine Corps 78.3 67.4 54.7<br />
Other Department of Defense 60.7 30.5 25.9<br />
Subtotal, Other DoD Services: 478.1 402.6 400.2<br />
b. Total DOD 7,631.0 7,533.5 6,657.6<br />
c. Other Orders:<br />
FMS 232.9 234.2 212.6<br />
Other Federal Agencies 5.6 6.7 4.1<br />
All Other 23.4 1.1 3.2<br />
Subtotal, Other Federal Agencies: 261.9 242.0 219.8<br />
Total New Orders 7,892.9 7,775.5 6,877.4<br />
2. Carry-In Orders (Back Orders From Prior Years) 2,173.4 1,526.4 1,601.5<br />
3. Total Gross Orders 10,066.3 9,301.9 8,478.9<br />
3a. Adjustment to Backorders 355.6 0.0 0.0<br />
4. Less Carry out 1,526.4 1,601.5 1,425.4<br />
5. Gross Sales 8,895.5 7,700.4 7,053.5<br />
6. Less Credit and Allowances 521.3 508.5 504.0<br />
7. Net Sales 8,374.1 7,191.9 6,549.5<br />
Narrative: FY 2012 carryout includes an adjustment to Backorders as a result of journal vouchers<br />
processed by DFAS to correct a system error which occurred in December FY 2012.<br />
EXHIBIT FUND 11<br />
SOURCE OF NEW ORDERS AND REVENUE 33
<strong>Army</strong> <strong>Working</strong> <strong>Capital</strong> <strong>Fund</strong><br />
Fiscal Year (FY) 2014 Budget Estimates<br />
Supply <strong>Management</strong><br />
Supply <strong>Management</strong> Summary<br />
($ in Millions)<br />
Net<br />
Customer<br />
Orders<br />
Net<br />
Sales<br />
Operating<br />
Contract<br />
Authority<br />
Direct Appn<br />
Total<br />
Authority<br />
Non-<strong>Army</strong> Managed Items (NAMI)<br />
FY 2012 1,808.0 1,909.7 1,533.5 0.0 1,533.5<br />
FY 2013 1,781.5 1,649.5 1,445.0 0.0 1,445.0<br />
FY 2014 1,633.3 1,514.3 1,324.0 0.0 1,324.0<br />
<strong>Army</strong> Managed Items (AMI)<br />
Aviation<br />
FY 2012 2,618.9 3,226.7 2,169.0 0.0 2,169.0<br />
FY 2013 2,553.5 2,611.3 2,160.5 6.2 2,166.7<br />
FY 2014 2,227.1 2,461.9 2,209.2 2.0 2,211.2<br />
Communications-Electronics<br />
FY 2012 989.7 1,036.4 551.3 16.2 567.5<br />
FY 2013 949.8 894.8 525.0 4.4 529.4<br />
FY 2014 803.8 796.9 540.6 5.9 546.5<br />
Missiles<br />
FY 2012 193.2 305.6 170.2 0.0 170.2<br />
FY 2013 267.5 280.6 170.0 3.3 173.3<br />
FY 2014 204.9 209.8 173.0 3.0 176.0<br />
Tank-automotive & Armaments<br />
FY 2012 1,752.2 1,882.3 1,039.4 0.0 1,039.4<br />
FY 2013 1,712.7 1,753.8 1,159.4 4.0 1,163.4<br />
FY 2014 1,502.3 1,564.5 1,052.5 0.0 1,052.5<br />
Total AMI<br />
FY 2012 5,553.9 6,451.0 3,929.8 16.2 3,946.0<br />
FY 2013 5,483.5 5,540.4 4,014.9 17.8 4,032.8<br />
FY 2014 4,738.1 5,033.1 3,975.3 10.9 3,986.2<br />
AMC Mobilization<br />
FY 2012 9.7 13.4 0.0 139.0 139.0<br />
FY 2013 2.0 2.0 2.0 84.8 86.8<br />
FY 2014 2.0 2.0 2.0 59.0 61.0<br />
Total Hardware<br />
FY 2012 7,371.6 8,374.1 5,463.3 155.2 5,618.5<br />
FY 2013 7,267.0 7,191.9 5,461.9 102.6 5,564.6<br />
FY 2014 6,373.4 6,549.5 5,301.3 69.9 5,371.2<br />
34<br />
EXHIBIT SM 1<br />
SUPPLY MANAGEMENT SUMMARY
<strong>Army</strong> <strong>Working</strong> <strong>Capital</strong> <strong>Fund</strong><br />
Fiscal Year (FY) 2014 Budget Estimates<br />
Supply <strong>Management</strong><br />
Supply <strong>Management</strong> Summary<br />
($ in Millions)<br />
Net<br />
Customer<br />
Net<br />
Operating<br />
Contract<br />
Total<br />
Orders Sales Authority Direct Appn Authority<br />
Cost of Operations (LOGOPS)<br />
FY 2012 1,009.1 0.0 1,009.1<br />
FY 2013 951.2 0.0 951.2<br />
FY 2014 980.3 0.0 980.3<br />
Variability Target<br />
FY 2012 0.0 0.0 0.0<br />
FY 2013 1,421.9 0.0 1,421.9<br />
FY 2014 1,513.2 0.0 1,513.2<br />
Enterprise Software Initiative<br />
FY 2012 45.0 0.0 45.0<br />
FY 2013 35.0 0.0 35.0<br />
FY 2014 35.0 0.0 35.0<br />
Total Authority<br />
FY 2012 7,371.6 8,374.1 6,517.4 155.2 6,672.6<br />
FY 2013 7,267.0 7,191.9 7,870.1 102.6 7,972.7<br />
FY 2014 6,373.4 6,549.5 7,829.7 69.9 7,899.6<br />
<strong>Capital</strong> Obligation Authority<br />
FY 2012 32.6 0.0 32.6<br />
FY 2013 59.2 0.0 59.2<br />
FY 2014 71.8 0.0 71.8<br />
Total Authority<br />
FY 2012 7,371.6 8,374.1 6,550.0 155.2 6,705.2<br />
FY 2013 7,267.0 7,191.9 7,929.3 102.6 8,031.9<br />
FY 2014 6,373.4 6,549.5 7,901.5 69.9 7,971.4<br />
Budget Authority<br />
Direct Appropriation-War Reserve<br />
FY 2012 0.0 155.2 155.2<br />
FY 2013 0.0 102.6 102.6<br />
FY 2014 0.0 69.9 69.9<br />
Total Budget Authority<br />
FY 2012 0.0 155.2 155.2<br />
FY 2013 0.0 102.6 102.6<br />
FY 2014 0.0 69.9 69.9<br />
EXHIBIT SM 1<br />
SUPPLY MANAGEMENT SUMMARY 35
<strong>Army</strong> <strong>Working</strong> <strong>Capital</strong> <strong>Fund</strong><br />
Fiscal Year (FY) 2014 Budget Estimates<br />
Supply <strong>Management</strong><br />
Operating Requirements by Weapon System<br />
($ in Millions)<br />
FY 2012 FY 2013 FY 2014<br />
Obligations NMCRS 1 Obligations NMCRS 1 Obligations NMCRS 1<br />
AH-64, Apache 404.9 3.6% 438.1 ≤ 25.0% 438.9 ≤ 25.0%<br />
CH-47D, Chinook 316.7 3.4% 409.7 ≤ 25.0% 349.5 ≤ 25.0%<br />
UH-60, Black Hawk 1,046.5 3.2% 1,016.8 ≤ 25.0% 1,116.6 ≤ 25.0%<br />
OH-58D, Kiowa Warrior 225.7 0.6% 165.9 ≤ 25.0% 180.0 ≤ 25.0%<br />
Other Aviation 175.2 0.0% 130.2 ≤ 25.0% 124.2 ≤ 25.0%<br />
MLRS 21.8 3.3% 7.1 ≤ 10.0% 4.9 ≤ 10.0%<br />
Patriot 144.4 4.5% 137.7 ≤ 10.0% 138.5 ≤ 10.0%<br />
Other Missile 3.9 0.0% 25.2 ≤ 10.0% 29.6 ≤ 10.0%<br />
Firefinder 17.9 1.5% 10.2 ≤ 10.0% 9.2 ≤ 10.0%<br />
Night Vision Goggles 39.7 2.0% 43.5 ≤ 10.0% 39.0 ≤ 10.0%<br />
SINCGARS 26.4 1.3% 26.2 ≤ 10.0% 26.6 ≤ 10.0%<br />
Other Communication-Electronics 467.2 0.0% 445.1 ≤ 10.0% 465.8 ≤ 10.0%<br />
FMTV 10.6 1.9% 17.2 ≤ 10.0% 21.9 ≤ 10.0%<br />
HEMTT 18.3 1.4% 26.8 ≤ 10.0% 25.6 ≤ 10.0%<br />
HMMWV 60.5 1.2% 67.4 ≤ 10.0% 68.1 ≤ 10.0%<br />
M109A6, Paladin 15.8 2.1% 18.6 ≤ 10.0% 13.8 ≤ 10.0%<br />
M198, Towed Howitzer 0.6 4.5% 0.8 ≤ 10.0% 0.9 ≤ 10.0%<br />
M1A1, Abrams Tank 197.5 4.6% 167.9 ≤ 10.0% 172.2 ≤ 10.0%<br />
M1A2, Abrams Tank (SEP) 17.6 3.7% 13.1 ≤ 10.0% 18.5 ≤ 10.0%<br />
M2/M3, Bradley Fighting Vehicle 37.7 2.7% 19.2 ≤ 10.0% 19.6 ≤ 10.0%<br />
Stryker 78.2 3.5% 94.7 ≤ 10.0% 74.0 ≤ 10.0%<br />
Other Tank-Automotive 602.6 0.0% 733.5 ≤ 10.0% 637.9 ≤ 10.0%<br />
Subtotal 3,929.8 4,014.9 3,975.3<br />
NAMI 1,533.5 1,445.0 1,324.0<br />
AMC-MOB 0.0 2.0 2.0<br />
TOTAL 5,463.3 5,461.9 5,301.3<br />
1/ NMCRS - Non Mission Capable Rate, Supply represents the percent of time a weapon system is not mission capable<br />
due to lack of critical spare parts. The <strong>AWCF</strong> goal for NMCRS is at or below 5%. FY 2012 is actual data. FY 2013 and<br />
FY 2014 are the <strong>Army</strong>'s goal for total weapon system readiness. Total weapon system readiness goals are 90% for<br />
ground and 75% for aircraft.<br />
36<br />
EXHIBIT SM 3b<br />
OPERATING REQUIREMENTS BY WEAPON SYSTEM
<strong>Army</strong> <strong>Working</strong> <strong>Capital</strong> <strong>Fund</strong><br />
Fiscal Year (FY) 2014 Budget Estimates<br />
Supply <strong>Management</strong><br />
Inventory Status<br />
($ in Millions)<br />
FY 2012<br />
TOTAL MOBILIZATION DEMAND BASED<br />
NON-DEMAND<br />
BASED<br />
1. INVENTORY BOP 23,829.5 2,916.1 12,460.5 8,453.0<br />
2. BOP INVENTORY ADJUSTMENTS<br />
A. RECLASSIFICATION (MEMO) (79.8) (60.0) 1,042.8 (1,062.6)<br />
B. PRICE CHANGE AMOUNT (MEMO) (434.9) (6.4) (216.9) (211.6)<br />
C. ADJ. INVENTORY BOP (1+2A+2B) 23,314.7 2,849.7 13,286.3 7,178.8<br />
3. PURCHASES 4,583.6 45.560 4,538.0 0.0<br />
4. GROSS SALES 8,895.5 0.000 8,895.5 0.0<br />
5. INVENTORY ADJUSTMENTS<br />
A. CAPITALIZATION (+ OR -) (142.5) (107.3) 3.3 (38.5)<br />
B. RETURNS FROM CUSTOMERS (+) 812.1 0.0 586.8 225.3<br />
C. RETURNS FROM CUSTOMERS WITHOUT CREDIT (+) 3,881.0 0.0 2,864.9 1,016.1<br />
D. RETURNS TO SUPPLIERS (-) 1.7 10.2 (6.7) (1.8)<br />
E. TRANSFERS TO DRMS (-) (3,267.5) (28.6) (1,715.1) (1,523.8)<br />
F. ISSUES/RECEIPT W/O ADJ (+ OR -) (146.1) (16.0) (21.2) (108.9)<br />
G. OTHER 540.6 29.2 1,645.4 (1,134.1)<br />
H. TOTAL ADJUSTMENTS (5A THRU 5G) 1,679.2 (112.5) 3,357.4 (1,565.7)<br />
6. INVENTORY EOP (2c + 3 - 4 + 5h) 20,682.0 2,782.7 12,286.3 5,613.1<br />
7. INVENTORY EOP 20,682.0 2,782.7 12,286.3 5,613.1<br />
A. ECONOMIC RETENTION (MEMO) 2,303.7<br />
B. CONTINGENCY RETENTION (MEMO) 1,706.1<br />
C. POTENTIAL DOD REUTILIZATION (MEMO) 1,603.3<br />
8. ON ORDER EOP @ COST 3,524.5 280.9 3,243.6 0.0<br />
9. NARRATIVE: The FY 2014 budget includes a blend of Inventory valued at Moving Average Cost (MAC) and Latest Acquisition Cost (LAC). The blend of inventory<br />
valuation is due to the conversion to LMP. Column "Non-Demand Based" includes inventory that stratifies beyond the budget year, economic and contingency<br />
retention stock, and inventory excess to the approved acquisition objective. The decapitalization of U.S. <strong>Army</strong> Medical Command war reserve secondary items<br />
inventory is included in the end of year projection. FY 2012 inventory is understated by $1.2 billion due to an abnormal accounting value for NAMI inventory.<br />
This abnormal balance will be corrected in FY 2013.<br />
EXHIBIT SM 4<br />
INVENTORY STATUS<br />
37
<strong>Army</strong> <strong>Working</strong> <strong>Capital</strong> <strong>Fund</strong><br />
Fiscal Year (FY) 2014 Budget Estimates<br />
Supply <strong>Management</strong><br />
Inventory Status<br />
($ in Millions)<br />
FY 2013<br />
TOTAL MOBILIZATION DEMAND BASED<br />
NON-DEMAND<br />
BASED<br />
1. INVENTORY BOP 20,682.0 2,782.7 12,286.3 5,613.1<br />
2. BOP INVENTORY ADJUSTMENTS<br />
A. RECLASSIFICATION (MEMO) 0.0 (1.8) 1,221.5 (1,219.8)<br />
B. PRICE CHANGE AMOUNT (MEMO) (4.0) (4.6) (42.8) 43.5<br />
C. ADJ. INVENTORY BOP (1+2A+2B) 20,678.0 2,776.3 13,465.0 4,436.8<br />
3. PURCHASES 5,263.6 155.8 5,107.9 0.0<br />
4. GROSS SALES 7,700.4 0.0 7,700.4 0.0<br />
5. INVENTORY ADJUSTMENTS<br />
A. CAPITALIZATION (+ OR -) (71.8) (43.4) (24.6) (3.8)<br />
B. RETURNS FROM CUSTOMERS (+) 1,357.7 0.0 923.5 434.2<br />
C. RETURNS FROM CUSTOMERS WITHOUT CREDIT (+) 3,868.2 1.9 2,312.6 1,553.7<br />
D. RETURNS TO SUPPLIERS (-) (2,095.8) (56.5) (800.9) (1,238.4)<br />
E. TRANSFERS TO DRMO (-) (2,437.9) (42.2) (471.7) (1,924.1)<br />
F. ISSUES/RECEIPT W/O ADJ (+ OR -) (90.7) (21.7) 0.0 (69.0)<br />
G. OTHER 918.5 6.7 97.9 813.9<br />
H. TOTAL ADJUSTMENTS (5A THRU 5G) 1,448.2 (155.1) 2,036.9 (433.6)<br />
6. INVENTORY EOP (2c + 3 - 4 + 5h) 19,689.4 2,776.9 12,909.3 4,003.2<br />
7. INVENTORY EOP 19,689.4 2,776.9 12,909.3 4,003.2<br />
A. ECONOMIC RETENTION (MEMO) 1,982.2<br />
B. CONTINGENCY RETENTION (MEMO) 1,415.8<br />
C. POTENTIAL DOD REUTILIZATION (MEMO) 605.2<br />
8. ON ORDER EOP @ COST 4,949.0 155.8 4,793.2 0.0<br />
9. NARRATIVE: The FY 2014 budget includes a blend of Inventory valued at Moving Average Cost (MAC) and Latest Acquisition Cost (LAC). The blend of inventory<br />
valuation is due to the conversion to LMP. Column "Non-Demand Based" includes inventory that stratifies beyond the budget year, economic and contingency<br />
retention stock, and inventory excess to the approved acquisition objective. The decapitalization of U.S. <strong>Army</strong> Medical Command war reserve secondary items<br />
inventory is included in the end of year projection.<br />
38<br />
EXHIBIT SM 4<br />
INVENTORY STATUS
<strong>Army</strong> <strong>Working</strong> <strong>Capital</strong> <strong>Fund</strong><br />
Fiscal Year (FY) 2014 Budget Estimates<br />
Supply <strong>Management</strong><br />
Inventory Status<br />
($ in Millions)<br />
FY 2014<br />
TOTAL MOBILIZATION DEMAND BASED<br />
NON-DEMAND<br />
BASED<br />
1. INVENTORY BOP 19,689.4 2,776.9 12,909.3 4,003.2<br />
2. BOP INVENTORY ADJUSTMENTS<br />
A. RECLASSIFICATION (MEMO) 0.0 (65.1) 647.0 (582.0)<br />
B. PRICE CHANGE AMOUNT (MEMO) 512.5 67.2 153.5 291.9<br />
C. ADJ. INVENTORY BOP (1+2A+2B) 20,202.0 2,779.0 13,709.8 3,713.1<br />
3. PURCHASES 4,871.6 77.4 4,794.2 0.0<br />
4. GROSS SALES 7,053.5 0.0 7,053.5 0.0<br />
5. INVENTORY ADJUSTMENTS<br />
A. CAPITALIZATION (+ OR -) (56.4) (30.0) (25.3) (1.0)<br />
B. RETURNS FROM CUSTOMERS (+) 1,210.1 0.0 726.5 483.7<br />
C. RETURNS FROM CUSTOMERS WITHOUT CREDIT (+) 3,906.4 1.7 1,658.7 2,246.0<br />
D. RETURNS TO SUPPLIERS (-) (2,156.9) (76.5) (700.0) (1,380.4)<br />
E. TRANSFERS TO DRMO (-) (2,519.2) (23.5) (240.1) (2,255.6)<br />
F. ISSUES/RECEIPT W/O ADJ (+ OR -) (69.7) 0.0 (34.1) (35.5)<br />
G. OTHER 1,224.4 6.0 179.5 1,038.9<br />
H. TOTAL ADJUSTMENTS (5A THRU 5G) 1,538.7 (122.3) 1,565.0 96.0<br />
6. INVENTORY EOP (2c + 3 - 4 + 5h) 19,558.8 2,734.1 13,015.6 3,809.1<br />
7. INVENTORY EOP 19,558.8 2,734.1 13,015.6 3,809.1<br />
A. ECONOMIC RETENTION (MEMO) 1,214.5<br />
B. CONTINGENCY RETENTION (MEMO) 1,260.7<br />
C. POTENTIAL DOD REUTILIZATION (MEMO) 1,333.9<br />
8. ON ORDER EOP @ COST 4,761.9 133.0 4,628.9 0.0<br />
9. NARRATIVE: The FY 2014 budget includes a blend of Inventory valued at Moving Average Cost (MAC) and Latest Acquisition Cost (LAC). The blend of inventory<br />
valuation is due to the conversion to LMP. Column "Non-Demand Based" includes inventory that stratifies beyond the budget year, economic and contingency<br />
retention stock, and inventory excess to the approved acquisition objective. The decapitalization of U.S. <strong>Army</strong> Medical Command war reserve secondary items<br />
inventory is included in the end of year projection.<br />
EXHIBIT SM 4<br />
INVENTORY STATUS<br />
39
<strong>Army</strong> <strong>Working</strong> <strong>Capital</strong> <strong>Fund</strong><br />
Fiscal Year (FY) 2014 Budget Estimates<br />
Supply <strong>Management</strong><br />
War Reserve Materiel<br />
($ in Millions)<br />
FY 2012<br />
Total WRM Protected WRM Other<br />
1. Inventory Beginning of Period (BOP)<br />
2,916.1 2,855.1 61.0<br />
2. Price Change (6.4) (6.5) 0.1<br />
3. Reclassification (60.0) (60.0) 0.0<br />
4. Inventory Changes<br />
a. Receipts 45.6 45.6 0.0<br />
(1) Purchases<br />
42.2 42.2 0.0<br />
(2) Returns from customers<br />
3.4 3.4 0.0<br />
b. Issues (18.4) (18.4) 0.0<br />
(1) Sales<br />
0.0 0.0 0.0<br />
(2) Returns to Suppliers<br />
10.2 10.2 0.0<br />
(3) Disposals<br />
(28.6) (28.6) 0.0<br />
c. Adjustments (94.1) (94.1) 0.0<br />
(1) <strong>Capital</strong>izations<br />
(107.3) (107.3) 0.0<br />
(2) Gains and losses<br />
(16.0) (16.0) 0.0<br />
(3) Other<br />
29.2 29.2 0.0<br />
5. Inventory End of Period (EOP) 2,782.7 2,721.6 61.1<br />
6. STOCKPILE COSTS<br />
a. Storage 0.0<br />
b. Manage 0.5<br />
c. Maintenance/Other 0.0<br />
Total Costs 0.5<br />
7. WRM Budget Request<br />
a. Additional WRM 155.2<br />
b. Replenishment/Repair WRM 0.2<br />
c. Stock Rotation/Obsolescence 0.0<br />
d. Assemble/Disassemble 0.0<br />
e. Other 0.0<br />
Total Request 155.4<br />
NARRATIVE: The decapitalization of U.S. <strong>Army</strong> Medical Command war reserve secondary items inventory began<br />
in FY 2012. The transfer will take several years; inventory on order must be received so complete medical kits can<br />
be transferred.<br />
40<br />
EXHIBIT SM 6<br />
WAR RESERVE MATERIEL
<strong>Army</strong> <strong>Working</strong> <strong>Capital</strong> <strong>Fund</strong><br />
Fiscal Year (FY) 2014 Budget Estimates<br />
Supply <strong>Management</strong><br />
War Reserve Materiel<br />
($ in Millions)<br />
FY 2013<br />
Total WRM Protected WRM Other<br />
1. Inventory Beginning of Period (BOP)<br />
2,782.7 2,721.6 61.1<br />
2. Price Change (4.6) (4.6) (0.0)<br />
3. Reclassification (1.8) (1.8)<br />
4. Inventory Changes<br />
a. Receipts 157.6 157.6 0.0<br />
(1) Purchases<br />
155.8 155.8 0.0<br />
(2) Returns from customers<br />
1.9 1.9 0.0<br />
b. Issues (98.7) (98.7) 0.0<br />
(1) Sales<br />
0.0 0.0 0.0<br />
(2) Returns to Suppliers<br />
(56.5) (56.5) 0.0<br />
(3) Disposals<br />
(42.2) (42.2) 0.0<br />
c. Adjustments (58.3) (58.3) 0.0<br />
(1) <strong>Capital</strong>izations<br />
(43.4) (43.4) 0.0<br />
(2) Gains and losses<br />
(21.7) (21.7) 0.0<br />
(3) Other<br />
6.7 6.7 0.0<br />
5. Inventory End of Period (EOP) 2,776.9 2,715.8 61.1<br />
6. STOCKPILE COSTS<br />
a. Storage 0.0<br />
b. Manage 0.5<br />
c. Maintenance/Other 0.0<br />
Total Costs 0.5<br />
7. WRM Budget Request<br />
a. Additional WRM 102.6<br />
b. Replenishment/Repair WRM 2.0<br />
c. Stock Rotation/Obsolescence 0.0<br />
d. Assemble/Disassemble 0.0<br />
e. Other 0.0<br />
Total Request 104.6<br />
NARRATIVE: The decapitalization of U.S. <strong>Army</strong> Medical Command war reserve secondary items inventory began<br />
in FY 2012. The transfer will take several years; inventory on order must be received so complete medical kits can<br />
be transferred.<br />
EXHIBIT SM 6<br />
WAR RESERVE MATERIEL 41
<strong>Army</strong> <strong>Working</strong> <strong>Capital</strong> <strong>Fund</strong><br />
Fiscal Year (FY) 2014 Budget Estimates<br />
Supply <strong>Management</strong><br />
War Reserve Materiel<br />
($ in Millions)<br />
FY 2014<br />
Total WRM Protected WRM Other<br />
1. Inventory Beginning of Period (BOP)<br />
2,776.9 2,715.8 61.1<br />
2. Price Change 67.2 67.2 (0.0)<br />
3. Reclassification (65.1) (65.1) 0.0<br />
4. Inventory Changes<br />
a. Receipts 79.1 79.1 0.0<br />
(1) Purchases<br />
77.4 77.4 0.0<br />
(2) Returns from customers<br />
1.7 1.7 0.0<br />
b. Issues (100.0) (100.0) 0.0<br />
(1) Sales<br />
0.0 0.0 0.0<br />
(2) Returns to Suppliers<br />
(76.5) (76.5) 0.0<br />
(3) Disposals<br />
(23.5) (23.5) 0.0<br />
c. Adjustments (24.0) (24.0) 0.0<br />
(1) <strong>Capital</strong>izations<br />
(30.0) (30.0) 0.0<br />
(2) Gains and losses<br />
0.0 0.0 0.0<br />
(3) Other<br />
6.0 6.0 0.0<br />
5. Inventory End of Period (EOP) 2,734.1 2,673.1 61.1<br />
6. STOCKPILE COSTS<br />
a. Storage 0.0<br />
b. Manage 0.5<br />
c. Maintenance/Other 0.0<br />
Total Costs 0.5<br />
7. WRM Budget Request<br />
a. Additional WRM 69.9<br />
b. Replenishment/Repair WRM 2.0<br />
c. Stock Rotation/Obsolescence 0.0<br />
d. Assemble/Disassemble 0.0<br />
e. Other 0.0<br />
Total Request 71.9<br />
NARRATIVE: The decapitalization of U.S. <strong>Army</strong> Medical Command war reserve secondary items inventory began<br />
in FY 2012. The transfer will take several years; inventory on order must be received so complete medical kits can<br />
be transferred.<br />
42<br />
EXHIBIT SM 6<br />
WAR RESERVE MATERIEL
Industrial Operations<br />
Introduction<br />
<strong>Army</strong> <strong>Working</strong> <strong>Capital</strong> <strong>Fund</strong> (<strong>AWCF</strong>)<br />
Fiscal Year (FY) 2014 Budget Estimates<br />
T<br />
he Industrial Operations activity group is comprised of thirteen<br />
government-owned and operated installation activities, each with unique core<br />
competencies. Industrial Operations promotes business-like behavior by<br />
relying on revenue instead of direct appropriations to finance continuing<br />
operations. Customers purchase services from Industrial Operations activities.<br />
These services include, but are not limited to,<br />
repairing and upgrading equipment, producing<br />
weapons and munitions, and storing and<br />
demilitarizing materiel. The goal for the Industrial<br />
Operations activity is to generate enough revenue<br />
to recover the full cost of operations while breaking<br />
even over the long term.<br />
The core financial measures for Industrial<br />
Operations are the net operating result (NOR) and<br />
accumulated operating result (AOR). The NOR<br />
measures the activity’s gain or loss within a single<br />
fiscal year and is used to monitor how closely the<br />
activity performs compared to its budget. The<br />
<br />
<br />
<br />
Mission:<br />
Provide an organic<br />
industrial capability to<br />
conduct depot level<br />
repair and upgrade<br />
Produce munitions<br />
and large caliber<br />
weapons<br />
Store, maintain, and<br />
demilitarize materiel<br />
for the Department of<br />
Defense<br />
AOR measures the activity’s accumulated gains and losses since the fund’s<br />
inception. Rates are set during budget development to break even by bringing<br />
the AOR to zero over a budget cycle. This method returns accumulated gains<br />
through reduced rates and recovers accumulated losses through increased rates.<br />
The rates are set to:<br />
<br />
<br />
<br />
Recover the activity’s costs such as payroll, supplies, contracts,<br />
equipment, inventory, depreciation, and maintenance<br />
Maintain a sufficient cash corpus to cover operating disbursements and<br />
six months of capital disbursements<br />
Break even over time<br />
The Industrial Operations activity relies heavily on customers funded by direct<br />
appropriations to support its operations. The activity synchronizes rates and<br />
budget assumptions with the appropriated funding levels of its customers.<br />
Reductions to customer appropriated funding requests impact the business by<br />
adversely affecting workloading decisions and projected staffing levels and may<br />
also affect equipment readiness of supported customers.<br />
43
SCL<br />
Efficiencies and Business Process<br />
Improvements<br />
<strong>Army</strong> <strong>Working</strong> <strong>Capital</strong> <strong>Fund</strong> (<strong>AWCF</strong>)<br />
Fiscal Year (FY) 2014 Budget Estimates<br />
Cost efficiency is an inherent attribute of<br />
the <strong>AWCF</strong>. The revolving fund construct<br />
promotes total cost visibility, full cost<br />
recovery, and fosters a business-like,<br />
competitive atmosphere. In the same<br />
way that commercial businesses focus on<br />
their bottom line profit, Industrial<br />
Operations activities focus on their Net<br />
Operating Result and other indicators to<br />
gauge the efficiency of their operations.<br />
To increase efficiency and maintain their<br />
Reworked 40mm rounds at McAlester<br />
competitive edge, Industrial Operations <strong>Army</strong> Ammunition Plant saved $28.6M<br />
activities have been fully engaged in<br />
in production costs during FY 2012.<br />
cost-cutting and business process<br />
improvement initiatives for many years. Industrial Operations customers<br />
ultimately garner the benefit of these efficiencies through reduced turn-around<br />
times, lower prices, and increased throughput. Examples of these initiatives<br />
include:<br />
<br />
<br />
<br />
Lean Six Sigma (LSS): LSS is a philosophy used in manufacturing to<br />
streamline and reduce variations in the production process. The U.S.<br />
<strong>Army</strong> Materiel Command (AMC) financial benefits from LSS initiatives<br />
averaged $339 million per year since FY 2009. These benefits come in<br />
the form of hard savings from budgeted programs, cost avoidances, and<br />
increased capacity (e.g. throughput). The Industrial Operations activity<br />
either re-invests the financial benefits or passes them on to its customers<br />
in future budgets through lower rates. AMC currently has 22 Level II<br />
Certified Master Black Belts which equates to over one-third of the <strong>Army</strong>’s<br />
Cadre and ensures AMC’s program is self sufficient.<br />
Value Engineering (VE): VE is a systematic process of function analysis<br />
identifying actions that reduce cost, increase quality, and improve mission<br />
capabilities across the entire spectrum of DOD systems, processes, and<br />
organizations. AMC has averaged over $1.2 billion per year in cost<br />
savings and avoidances since FY 2009 from VE.<br />
International Organization for Standardization (ISO): ISO is a<br />
worldwide federation of national standards bodies that independently audit<br />
and certify companies and organizations for conformance with established<br />
standards. The thirteen Industrial Operations activities currently hold thirty<br />
four ISO certifications for Quality <strong>Management</strong> Systems, International<br />
44
<strong>Army</strong> <strong>Working</strong> <strong>Capital</strong> <strong>Fund</strong> (<strong>AWCF</strong>)<br />
Fiscal Year (FY) 2014 Budget Estimates<br />
Aerospace Quality Systems, Environmental <strong>Management</strong> Systems, and<br />
Occupational Safety and Health Administration Systems.<br />
<br />
<br />
<br />
<br />
<strong>Capital</strong> Investment Program (CIP) Productivity Improvements:<br />
Industrial Operations leverages investments in equipment and facilities<br />
that increase production capacity and efficiency. From FY 2012 to<br />
FY 2014, Industrial Operations has invested or plans to invest an average<br />
of $47 million per year in productivity enhancing equipment, 50 percent of<br />
the CIP equipment investment overall.<br />
Adaptable Workforce Structure: Industrial Operations activities employ<br />
an adaptable workforce structure to maintain flexibility in response to<br />
shifting workload requirements. Activities adjust the size of their workforce<br />
through the judicious use of contractor, term and temporary personnel,<br />
and overtime to accommodate surges in workload.<br />
Safety Improvements: Improving safety is a high priority throughout the<br />
U.S. <strong>Army</strong> Materiel Command (AMC); it improves morale and productivity<br />
and reduces costs. The AMC Commanding General sets, publishes, and<br />
tracks progress toward safety goals each year. Tobyhanna <strong>Army</strong> Depot<br />
(TYAD), Corpus Christi <strong>Army</strong> Depot, McAlester <strong>Army</strong> Ammunition Plant,<br />
and Crane <strong>Army</strong> Ammunition Activity are recognized as Star sites in the<br />
Occupational Safety and Health Administration’s Voluntary Protection<br />
Program (VPP). VPP participants must maintain an effective safety and<br />
health management system that meets rigorous performance-based<br />
criteria.<br />
Energy and Water Savings Programs: AMC has instituted a command<br />
wide policy to identify performance standards to reduce consumption of<br />
energy and water resources, achieve energy security and comply with<br />
DOD goals and objectives. Savings are being realized through the use of<br />
advanced metering programs, energy management and control systems<br />
and implementation for energy conservation measures. Longer term<br />
energy savings are expected from renewable energy sources. AMC’s<br />
current energy conservation efforts include the installation of a 100,000<br />
square foot vegetative roofing system at TYAD that will aid in cooling the<br />
work space with no increase in utility cost. The replacement of air<br />
compressors in two buildings at Letterkenny <strong>Army</strong> Depot with anticipated<br />
savings of $1,700 per year in electric cost and upgrading a boiler system,<br />
saving an estimated $1,200 annually in oil cost is also underway. Efforts<br />
are also planned to assist the Assistant Secretary of the <strong>Army</strong> for<br />
Installations, Energy and Environment Energy Initiatives Task Force in<br />
meeting a renewable energy goal of 1,000 megawatts (MW) of electricity<br />
production. AMC’s contributions include a 10 MW direct use of<br />
geothermal energy and 80 MW of solar production at Sierra <strong>Army</strong> Depot.<br />
45
<strong>Army</strong> <strong>Working</strong> <strong>Capital</strong> <strong>Fund</strong> (<strong>AWCF</strong>)<br />
Fiscal Year (FY) 2014 Budget Estimates<br />
Additional renewable systems planned include a 90 megawatts (MW)<br />
biomass, 200 MW solar array, and a 40 MW wind system at Tooele <strong>Army</strong><br />
Depot. The <strong>Army</strong> Materiel Command installations are also pursuing third<br />
party financed energy and water projects using Energy Saving<br />
Performance Contracts. The initial effort for FY 2012 and following years<br />
include planned projects at McAlister <strong>Army</strong> Ammunition Plant, Anniston<br />
<strong>Army</strong> Depot, and Crane <strong>Army</strong> Ammunition Activity (CAAA). New military<br />
construction projects and facilities renovations are also applying<br />
sustainable design and development principles during the contract phase<br />
at all installations.<br />
Functional Description<br />
The <strong>AWCF</strong> Industrial Operations activity group includes five depots, three arsenals,<br />
two munitions production facilities, and three storage sites. This activity group<br />
performs the following mission functions:<br />
<br />
<br />
<br />
<br />
<br />
Provides depot level maintenance, repair, and modernization of weapon<br />
systems and component parts<br />
Manufactures, renovates, and demilitarizes materiel<br />
Produces munitions and large caliber weapons<br />
Performs a full range of ammunition maintenance services for DOD and<br />
U.S. allies<br />
Performs ammunition receipt, storage, and issue functions<br />
In addition to the mission functions, ten of the thirteen activities provide installation<br />
base support for both internal operations and tenant activities. Corpus Christi <strong>Army</strong><br />
Depot and CAAA are tenants on Navy installations. Rock Island Arsenal receives<br />
installation base support from the <strong>Army</strong> Installation <strong>Management</strong> Command.<br />
Industrial Operations activities<br />
collaborate with the private<br />
sector through formal publicprivate<br />
partnership<br />
agreements to perform work<br />
or utilize facilities and<br />
equipment. Under authority<br />
granted by Title 10, United<br />
States Code, § 2474, these<br />
partnerships create<br />
opportunities for both the<br />
Corpus Christi <strong>Army</strong> Depot employees inspect a<br />
public and private sectors by UH-60 Black Hawk during routine maintenance.<br />
capitalizing on each other’s<br />
strengths and efficiencies. The benefits to the <strong>Army</strong> and its customers include:<br />
46
<strong>Army</strong> <strong>Working</strong> <strong>Capital</strong> <strong>Fund</strong> (<strong>AWCF</strong>)<br />
Fiscal Year (FY) 2014 Budget Estimates<br />
leveraging capacity; sustaining core maintenance capabilities; sharing of overhead<br />
costs; and enhancing technical expertise in the workforce. The benefits to private<br />
industry include access to specialized facilities, equipment and processes, and<br />
stimulating local economies. Current public-private partnership agreements are held<br />
with companies such as The Boeing Company, General Dynamics Land Systems,<br />
Sikorsky Aircraft Corporation, and Honeywell International.<br />
The five hard-iron maintenance depots (Anniston, Corpus Christi, Letterkenny, Red<br />
River, and Tobyhanna) and Pine Bluff Arsenal, Rock Island Arsenal, Sierra <strong>Army</strong><br />
Depot, and Tooele <strong>Army</strong> Depot are designated as Centers of Industrial and<br />
Technical Excellence (CITE) for the performance of core 11 maintenance workload in<br />
support of DOD and foreign allies. The CITE designation provides authority under<br />
Title 10, United States Code, § 2474 to partner with and lease facilities to industry on<br />
programs relating to core maintenance and technical expertise.<br />
The Shingo Prize, administered by the Jon M. Huntsman School of Business at<br />
Utah State University, is the premier award for operational excellence<br />
world-wide. Since FY 2005, the U.S. <strong>Army</strong> Materiel Command has received<br />
thirty Shingo Prizes for various programs at its depots and arsenals, including<br />
eight at Red River <strong>Army</strong> Depot, seven at Letterkenny <strong>Army</strong> Depot, seven at<br />
Tobyhanna <strong>Army</strong> Depot, three at Rock Island Arsenal and two at Anniston <strong>Army</strong><br />
Depot. This award recognizes industry leaders who promote world-class business<br />
and manufacturing processes that enable on-time delivery and customer satisfaction.<br />
On-site examiners conduct Shingo Prize evaluations and score the following areas:<br />
<br />
<br />
<br />
<br />
<br />
<br />
<br />
<br />
Cost improvement<br />
Partnering practices with<br />
suppliers and customers<br />
Quality and results<br />
Innovation and development<br />
Environmental practices<br />
Vision and strategy<br />
Leadership & Empowerment<br />
Continuous improvement<br />
M1151 High Mobility Multipurpose<br />
Wheeled Vehicle (HMMWV) in the process<br />
of being up-armored.<br />
11<br />
Title 10, United States Code, § 2464. Core Logistics Capabilities - Government-owned and<br />
Government-operated equipment and facilities required to ensure a ready and controlled source<br />
of technical competence and resources necessary to ensure effective and timely response to a<br />
mobilization, national defense contingency situations, and other emergency requirements.<br />
47
<strong>Army</strong> <strong>Working</strong> <strong>Capital</strong> <strong>Fund</strong> (<strong>AWCF</strong>)<br />
Fiscal Year (FY) 2014 Budget Estimates<br />
Activity Group Composition<br />
Figure IO 1 - Industrial Operations Activity Group Composition<br />
Tooele<br />
Conventional Ammunition,<br />
Equipment<br />
Rock Island<br />
Howitzers, Gun Mounts<br />
Crane<br />
Conventional Munitions<br />
Demilitarization<br />
Watervliet<br />
Tank/Artillery Cannons,<br />
Guided Munitions Casings<br />
Tobyhanna<br />
Communications-Electronics<br />
Avionics<br />
Missile Guidance & Control<br />
Sierra<br />
Operational<br />
Project Stocks<br />
Letterkenny<br />
DoD Tactical Missiles<br />
Fire Control<br />
Bluegrass<br />
Conventional Ammunition<br />
Conventional<br />
Ammunition<br />
Chemical Defense<br />
Equipment<br />
McAlester<br />
Conventional Munitions<br />
Demilitarization<br />
Red River<br />
Bradley and MLRS<br />
Tactical/Combat Wheeled Vehicles<br />
Conventional Ammunition<br />
Corpus Christi<br />
Rotary Wing Aircraft<br />
Pine Bluff<br />
White/Red Phosphorus<br />
Chemical/Bio Defensive Equipment,<br />
Demilitarization<br />
Anniston<br />
Combat Vehicles<br />
Artillery<br />
Small Arms<br />
Conventional Ammunition<br />
Color Key:<br />
Maintenance Depot<br />
Arsenal<br />
Storage Depot<br />
Munitions Production<br />
The U.S. <strong>Army</strong> Materiel Command is located in Huntsville, Alabama and<br />
serves as the management command for the Industrial Operations activity group.<br />
Installations or activities in this group fall under the direct command and control<br />
of the Life Cycle <strong>Management</strong> Commands each aligned in accordance with the<br />
nature of its mission. The following are descriptions of the Industrial Operations<br />
activities and their major core mission functions.<br />
48
<strong>Army</strong> <strong>Working</strong> <strong>Capital</strong> <strong>Fund</strong> (<strong>AWCF</strong>)<br />
Fiscal Year (FY) 2014 Budget Estimates<br />
Anniston <strong>Army</strong> Depot (ANAD)<br />
Location: Anniston, Alabama<br />
2012 Workforce: 3,289<br />
Description: A vital part of the community since opening in 1942,<br />
the depot’s annual economic impact is estimated to be $1.1 billion<br />
and indirectly supports over 18,000 jobs in the Anniston area. It is<br />
the only <strong>Army</strong> depot capable of performing maintenance on both<br />
heavy and light-tracked combat vehicles, and their components. The depot is the<br />
designated Center of Industrial and Technical Excellence for the M1 Abrams<br />
Tank and is the primary depot for the repair of the Armored Vehicle Launched<br />
Bridge, and the M728 and M88 combat vehicles. ANAD also has responsibility<br />
for the overhaul of the M113 Family of Vehicles, Stryker, M9 Armored Combat<br />
Earthmover, small arms, and towed and self-propelled artillery. The depot is<br />
actively engaged in the Reset of equipment returning from operations in<br />
Southwest Asia, performing maintenance on individual and crew-served<br />
weapons, land combat missiles, and small arms. ANAD also provides installation<br />
support to attached organizations and assigned operating facilities.<br />
Blue Grass <strong>Army</strong> Depot (BGAD)<br />
Location: Richmond, Kentucky<br />
2012 Workforce: 910<br />
Description: BGAD is a Strategic Mobility Power Projection<br />
ammunition depot with the mission to receive, store, issue,<br />
renovate, modify, maintain, and demilitarize conventional munitions<br />
for all DOD services. BGAD stores and manages all <strong>Army</strong> Special<br />
Operations Forces ammunition. The depot is DOD’s primary center for<br />
surveillance, receipt, storage, issue, testing, and minor repair of Individual<br />
Protection Chemical Defense Equipment. Additionally, BGAD maintains an<br />
Industrial Services capability providing receipt, storage, cutting, and fabrication of<br />
raw materials and metal parts for high visibility programs such as the Mine<br />
Resistant Ambush Protected family of vehicles. Anniston Munitions Center,<br />
located at Anniston <strong>Army</strong> Depot, is under the command and control of BGAD and<br />
serves as a multifunctional production facility, primary missile storage and<br />
maintenance depot, and as a storage and demilitarization depot for other<br />
conventional ammunition items. BGAD also provides installation support to<br />
attached organizations and assigned operating facilities.<br />
49
<strong>Army</strong> <strong>Working</strong> <strong>Capital</strong> <strong>Fund</strong> (<strong>AWCF</strong>)<br />
Fiscal Year (FY) 2014 Budget Estimates<br />
Crane <strong>Army</strong> Ammunition Activity (CAAA)<br />
Location: Crane, Indiana<br />
2012 Workforce: 972<br />
Description: CAAA serves as a primary ammunition storage and<br />
distribution site within the DOD for the U.S. Central and Northern<br />
regions. CAAA’s mission is to produce and renovate conventional<br />
ammunition and ammunition-related components. This includes<br />
manufacturing, engineering, and product assurance in support of production.<br />
Other functions are storing, shipping, demilitarizing, and disposing of<br />
conventional ammunition and related items. CAAA’s diverse manufacturing<br />
capabilities allow for the production of detonators weighing only 20 grams to<br />
40,000 pound cast shock test charges. CAAA has extensive renovation and<br />
maintenance capabilities for conventional munitions and is the recognized center<br />
of excellence for the production of pyrotechnic devices including signal smoke,<br />
illuminating and infrared flares, and distress signals. Letterkenny Munitions<br />
Center, located at Letterkenny <strong>Army</strong> Depot, is under the command and control of<br />
CAAA. LEMC stores, maintains, distributes, and demilitarizes conventional<br />
ammunition.<br />
Corpus Christi <strong>Army</strong> Depot (CCAD)<br />
Location: Corpus Christi, Texas<br />
2012 Workforce: 4,103<br />
Description: The CCAD mission is to overhaul, repair, modify,<br />
retrofit, test and modernize helicopters and associated<br />
components for government agencies and U.S. allies. CCAD<br />
serves as the depot training base for active duty <strong>Army</strong>, National<br />
Guard, Reserve, and foreign military personnel. CCAD provides worldwide<br />
on-site maintenance services, aircraft crash analysis, lubricating oil analysis, and<br />
chemical, metallurgical, and training support services to customers. Designated<br />
as the Center of Industrial and Technical Excellence for rotary-wing aircraft,<br />
CCAD supports the AH-64 Apache, UH-60 Black Hawk, CH-47 Chinook, OH-58<br />
Kiowa Warrior, and HH-60 Pave Hawk helicopters. CCAD is also actively<br />
engaged in the Reset of equipment returning from operations in Southwest Asia.<br />
50
<strong>Army</strong> <strong>Working</strong> <strong>Capital</strong> <strong>Fund</strong> (<strong>AWCF</strong>)<br />
Fiscal Year (FY) 2014 Budget Estimates<br />
Letterkenny <strong>Army</strong> Depot (LEAD)<br />
Location: Chambersburg, Pennsylvania<br />
2012 Workforce: 1,681<br />
Description: LEAD performs maintenance, modification, storage,<br />
and demilitarization operations on tactical missiles and ammunition.<br />
It has unique tactical missile repair capabilities supporting a variety<br />
of DOD missile systems including the Patriot and its ground support<br />
and radar equipment. LEAD is the designated Center of Industrial and Technical<br />
Excellence for air defense and tactical missile ground support equipment. In<br />
addition, it supports repair and maintenance on a multitude of generators and<br />
accommodates surge levels of repair and recapitalization for the High Mobility<br />
Multipurpose Wheeled Vehicle family. LEAD also provides installation support to<br />
attached organizations and assigned operating facilities.<br />
McAlester <strong>Army</strong> Ammunition Plant (MCAAP)<br />
Location: McAlester, Oklahoma<br />
2012 Workforce: 1,521<br />
Description: MCAAP is located on 45,000 acres in southeastern<br />
Oklahoma. It has six ammunition production, maintenance and<br />
renovation complexes and is a major ammunition storage site for all<br />
branches of the Armed Forces. In addition, the plant has nearly<br />
2,300 storage magazines and six million square feet of covered<br />
explosive storage space. MCAAP produces and renovates conventional<br />
ammunition, bombs, warheads, rockets, missiles, and ammunition-related<br />
components; performs engineering and product assurance in support of<br />
production; and receives, stores, ships, demilitarizes, and disposes of<br />
conventional and missile ammunition and related items. The Red River<br />
Munitions Center (RRMC), located at Red River <strong>Army</strong> Depot, is under the<br />
command and control of MCAAP. RRMC stores, maintains, and distributes<br />
conventional ammunition. MCAAP also provides installation support to attached<br />
organizations and assigned operating facilities.<br />
51
<strong>Army</strong> <strong>Working</strong> <strong>Capital</strong> <strong>Fund</strong> (<strong>AWCF</strong>)<br />
Fiscal Year (FY) 2014 Budget Estimates<br />
Pine Bluff Arsenal (PBA)<br />
Location: Pine Bluff, Arkansas<br />
2012 Workforce: 881<br />
Description: With a local economic impact exceeding $160 million<br />
annually, PBA produces, renovates, and stores more than 60<br />
different conventional ammunition products ranging in caliber from<br />
40 mm to 175 mm. Specialties include production of munitions<br />
containing payloads for smoke, non-lethal, riot control, incendiary,<br />
illumination, and infrared uses. Designated the Center of Industrial and<br />
Technical Excellence for Chemical and Biological Defense Equipment, PBA is a<br />
leader in the field of protective mask fabrication, repair, and re-certification, and<br />
represents the <strong>Army</strong>’s sole facility for the repair and rebuild of a series of masks<br />
and breathing apparatus. It provides maintenance, upgrade, storage, and<br />
mission support for various mobile and powered Soldier support systems. PBA<br />
has strengthened business initiatives by forming public-private partnerships with<br />
the Clara Barton Center for Domestic Preparedness, and with the Department of<br />
Homeland Security. The arsenal also provides installation support to attached<br />
organizations and assigned operating facilities.<br />
Rock Island Arsenal-Joint Manufacturing and Technology Center<br />
(RIA-JMTC)<br />
Location: Rock Island, Illinois<br />
2012 Workforce: 1,547<br />
Description: RIA-JMTC manufactures weapons, weapon<br />
components, and mobile maintenance systems. RIA-JMTC is<br />
currently producing the M119A2 Howitzer, Forward Repair System,<br />
Shop Equipment Contact Maintenance, as well as manufacturing<br />
artillery, gun mounts, recoil mechanisms, small arms, aircraft weapon<br />
sub-systems, and weapons simulators. In addition, it produces a host of spare<br />
and repair parts and demilitarizes containers. RIA-JMTC is the only<br />
multi-purpose and vertically integrated metal manufacturer in DOD and is a<br />
designated Center for Industrial and Technical Excellence for mobile<br />
maintenance systems and add-on-armor design, development, and prototype<br />
fabrication. The center possesses the unique technical expertise and equipment<br />
to manufacture high quality and sustainable products. RIA-JMTC strives to<br />
remain on the cutting edge of technological developments and has recently<br />
added titanium casting and composite armor production to its long list of metal<br />
manufacturing capabilities.<br />
52
<strong>Army</strong> <strong>Working</strong> <strong>Capital</strong> <strong>Fund</strong> (<strong>AWCF</strong>)<br />
Fiscal Year (FY) 2014 Budget Estimates<br />
Red River <strong>Army</strong> Depot (RRAD)<br />
Location: Texarkana, Texas<br />
2012 Workforce: 3,363<br />
Description: RRAD’s mission is to conduct ground combat, and<br />
tactical systems sustainment maintenance operations, and related<br />
support services worldwide for the <strong>Army</strong>, other DOD components,<br />
and allied nations. Systems supported include the Bradley Fighting<br />
Vehicle System (BFVS), Multiple Launch Rocket System (MLRS),<br />
Small Emplacement Excavator (SEE), five-ton dump truck, Heavy Expanded<br />
Mobility Tactical Truck, 25 ton crane, track and road wheels, HMMWV, M800 and<br />
M900 series trucks, and various configurations of trailers. In addition, it has been<br />
named as the depot source of repair for the Mine Resistant Ambush Protected<br />
vehicle. RRAD is designated as the Center of Industrial and Technical<br />
Excellence for tactical wheeled vehicles, BFVS, MLRS chassis, SEE, and rubber<br />
products necessary for depot maintenance missions. RRAD continuously<br />
engages in business process improvements to maximize both production<br />
capacity and flexibility to assume new programs. The depot has accommodated<br />
surge levels for repair and recapitalization of light and heavy tracked vehicles,<br />
road wheels and track, electronic systems, missile systems, towed and<br />
self-propelled artillery, tactical wheeled vehicles, and support equipment. RRAD<br />
also provides installation support to attached organizations and assigned<br />
operating facilities.<br />
Sierra <strong>Army</strong> Depot (SIAD)<br />
Location: Herlong, California<br />
2012 Workforce: 1,349<br />
Description: SIAD provides a complete range of logistics support,<br />
as the Center of Industrial and Technical Excellence for Reverse<br />
Osmosis Water Purification Units as well as operational project<br />
stocks, including receipt, storage, repair, shipping, maintenance,<br />
containerization, and fabrication of assets. SIAD supports critical<br />
systems such as Deployable Medical Systems, Petroleum and Water Systems,<br />
strategic configured loads and Force Provider. SIAD is the redistribution point for<br />
containers of secondary items returning from Southwest Asia. It also provides<br />
installation support to attached organizations and assigned operating facilities.<br />
53
<strong>Army</strong> <strong>Working</strong> <strong>Capital</strong> <strong>Fund</strong> (<strong>AWCF</strong>)<br />
Fiscal Year (FY) 2014 Budget Estimates<br />
Tooele <strong>Army</strong> Depot (TEAD)<br />
Location: Tooele, Utah<br />
2012 Workforce: 463<br />
Description: Designated as the Center of Industrial and Technical<br />
Excellence for Ammunition Peculiar Equipment (APE), TEAD is the life<br />
cycle engineering depot for the design, development, manufacturing<br />
and fielding of munitions systems and APE throughout the world. The<br />
depot receives, stores, issues, renovates, modifies, maintains, and destroys<br />
conventional munitions for all of DOD. TEAD provides America’s joint fighting<br />
forces with munitions and APE in support of military missions before, during, and<br />
after any contingency. It also provides installation support to attached<br />
organizations and assigned operating facilities.<br />
Tobyhanna <strong>Army</strong> Depot (TYAD)<br />
Location: Tobyhanna, Pennsylvania<br />
2012 Workforce: 3,779<br />
Description: TYAD is a full-service repair, overhaul, and<br />
fabrication facility for communications-electronics systems,<br />
equipment, and select missile guidance systems, and it provides for<br />
the maintenance, issue, and disposal of assigned commodities for<br />
DOD and other customers. It is designated as the Center of<br />
Industrial and Technical Excellence for Command, Control, Communications,<br />
Computers, Intelligence, Surveillance and Reconnaissance, electronics, avionics,<br />
and missile guidance and control. TYAD is the Air Force Technology Repair<br />
Center for radio and satellite communication equipment, computers, air traffic<br />
control, surveillance, and range threat systems. The depot is also actively<br />
engaged in the Reset of equipment returning from operations in Iraq and<br />
Afghanistan. It provides installation support to attached organizations and<br />
assigned operating facilities.<br />
Watervliet Arsenal (WVA)<br />
Location: Watervliet, New York<br />
2012 Workforce: 602<br />
Description: WVA produces armaments, mortars, recoilless rifles,<br />
howitzers and is recognized as the premier cannon-maker for the<br />
<strong>Army</strong>. This includes all life cycle support elements from research<br />
and development through prototype, manufacturing, testing support,<br />
legacy system support, and technical expertise. The guns manufactured at WVA<br />
provide the firepower for the <strong>Army</strong>’s main battlefield tank, the M1A1 Abrams.<br />
WVA also provides installation support to attached organizations and assigned<br />
operating facilities.<br />
54
<strong>Army</strong> <strong>Working</strong> <strong>Capital</strong> <strong>Fund</strong> (<strong>AWCF</strong>)<br />
Fiscal Year (FY) 2014 Budget Estimates<br />
Budget Highlights<br />
Assumptions<br />
This submission represents a business plan that supports equipment readiness<br />
requirements and assumes a lower OPTEMPO for the Nation’s continued efforts in<br />
Overseas Contingency Operations. The budget reflects workload assumptions<br />
developed in coordination with our customers that support both baseline and Reset<br />
requirements. However, as unit rotations and weapon system delivery schedules<br />
shift, annual projections can change significantly. To offset these risks, the Industrial<br />
Operations activity remains poised to increase or decrease output in order to<br />
accommodate customers’ changing demands.<br />
Personnel<br />
Chart IO 1 - Civilian Personnel (excludes contractors)<br />
Civilian end-strength<br />
represents the number of<br />
30,000<br />
personnel employed at the<br />
25,000<br />
end of each fiscal year. Full<br />
time equivalents represent the<br />
20,000<br />
manpower level of effort<br />
necessary to accomplish the<br />
15,000<br />
projected workload on an<br />
10,000<br />
annual basis. The Industrial<br />
Operations labor pool includes<br />
5,000<br />
a mix of permanent,<br />
0<br />
temporary, and<br />
FY 2012 FY 2013 FY 2014<br />
term-appointed employees, in End Strength 24,460 23,111 22,367<br />
addition to contract labor,<br />
FTE 25,006 24,151 22,501<br />
which allow for workforce<br />
flexibility to accommodate workload changes. In addition to civilian personnel, the<br />
Industrial Operations activities employ 26 military personnel, which include primarily<br />
installation commanders, Sergeants Major, and test pilots.<br />
Maintaining a trained and ready workforce is critical to this labor intensive business<br />
area. Industrial Operations activities engage in various intern and apprentice<br />
programs to help meet this requirement. Due to the specialized nature of the work<br />
and skill level requirements, training may require two to three years before an<br />
employee is able to perform specific tasks without supervision.<br />
55
<strong>Army</strong> <strong>Working</strong> <strong>Capital</strong> <strong>Fund</strong> (<strong>AWCF</strong>)<br />
Fiscal Year (FY) 2014 Budget Estimates<br />
Direct Labor Hour (DLH)<br />
Chart IO 2 - Direct Labor Hours<br />
35,000<br />
Total direct labor hours<br />
represent the number of<br />
30,000<br />
hours required to<br />
25,000<br />
complete the Industrial<br />
Operations direct<br />
20,000<br />
mission workload.<br />
15,000<br />
FY 2013 and FY 2014<br />
DLHs decrease slightly<br />
10,000<br />
as new orders are<br />
5,000<br />
expected to decrease,<br />
but production remains<br />
0<br />
FY 2012 FY 2013 FY 2014 high to complete work<br />
Total DLH 32,007 29,709 27,244<br />
Contractor DLH<br />
carried over from prior<br />
5,385 4,565 4,040<br />
Civilian DLH - Overtime 4,245 2,364 1,858 fiscal years. IO activities<br />
Civilian DLH - Regular 22,377 22,780 21,347<br />
remain prepared to<br />
increase overtime and contractor DLHs in the event workload estimates increase.<br />
Thousands<br />
Direct Labor Hour Rate<br />
The composite Chart IO 3 - Direct Labor Hour Rate<br />
revenue rate is an<br />
$250.00<br />
aggregate<br />
hourly rate<br />
$200.00<br />
established in the<br />
$150.00<br />
budget cycle and<br />
used to price ratestabilized<br />
workload.<br />
$100.00<br />
It is comprised of<br />
$50.00<br />
direct labor and<br />
material costs,<br />
$0.00<br />
FY 2012 FY 2013 FY 2014<br />
overhead costs<br />
Composite Revenue Rate per DLH 129.56 136.01 141.46<br />
Unit Cost per DLH 198.91 221.91 230.47<br />
(mission indirect<br />
Revenue Rate Change (11.6%) 5.0% 4.0%<br />
and non-mission<br />
indirect costs) and accumulated operating result adjustments that are designed to<br />
return gains or recover losses. In contrast to rate-stabilized workload, cost<br />
reimbursable workload represents workload that is prototype in nature or has very<br />
little repair history. It is not included in the stabilized rate calculation until sufficient<br />
repair information has been established. The composite revenue rate calculation is<br />
complex and influenced by several factors: 1) commodity mix of the workload<br />
planned (labor intensive, material intensive or both); 2) the amount of gains to be<br />
Dollars<br />
56
Chart IO 4 - Revenue and Expenses<br />
<strong>Army</strong> <strong>Working</strong> <strong>Capital</strong> <strong>Fund</strong> (<strong>AWCF</strong>)<br />
Fiscal Year (FY) 2014 Budget Estimates<br />
returned or losses to be recovered over the budget years; 3) the amount of stabilized<br />
direct labor hours available to return gains or recover losses; and 4) the number of<br />
total direct labor hours available to distribute overhead cost (stabilized and nonstabilized<br />
workload). A change to the composite revenue rate directly affects the<br />
total revenue and new order values for the budget year. The FY 2014 composite<br />
revenue rate is $141.46 and is set to return $202.3 million of prior year accumulated<br />
operating result (AOR). Unlike the composite revenue rate, which is adjusted for<br />
AOR and applied to only new rate stabilized workload, the unit cost per direct labor<br />
hour represents total costs of work performed on both prior year and current year<br />
orders. The unit cost does not include adjustments for AOR. The return of operating<br />
gains to customers causes the revenue rate to be lower than unit cost.<br />
Revenue and Expenses<br />
The Industrial Operations<br />
revenue amount represents<br />
earnings from work<br />
performed on customer<br />
equipment. Total expenses<br />
cover full costs, including<br />
material, labor, storage, and<br />
other direct or indirect costs<br />
associated with the products<br />
or services being provided.<br />
Revenue and expense<br />
projections increase in<br />
FY 2013 as activities<br />
increase production to<br />
reduce carryover. FY 2013<br />
$ Millions<br />
7,000<br />
6,000<br />
5,000<br />
4,000<br />
3,000<br />
2,000<br />
1,000<br />
0<br />
FY 2012 FY 2013 FY 2014<br />
Total Revenue 6,351.9 6,403.6 6,023.5<br />
Total Expenses 6,366.4 6,592.8 6,278.8<br />
and FY 2014 revenue reflects the return of operational gains back to customers.<br />
Revenue and expenses are displayed in more detail on Exhibit <strong>Fund</strong> 14,<br />
Revenue and Costs.<br />
Operating Result<br />
The Net Operating Result (NOR) represents the difference between revenue and<br />
expenses within a fiscal year. The AOR represents the summation of all<br />
operating gains or losses since activity group inception along with any prior<br />
period adjustments. AOR at the end of FY 2012 was $681.5 million. Industrial<br />
Operations set rates to return $135.2 million and $202.3 million of this AOR in<br />
FY 2013 and FY 2014, respectively. The Industrial Operations business received<br />
approval from DOD Comptroller to defer the return of $344.0 million of AOR<br />
pending resolution of potential prior year accounting issues related to inventory<br />
57
<strong>Army</strong> <strong>Working</strong> <strong>Capital</strong> <strong>Fund</strong> (<strong>AWCF</strong>)<br />
Fiscal Year (FY) 2014 Budget Estimates<br />
valuation. The Recoverable Net Operating Result, Deferred Accumulated<br />
Operating Result (AOR), and AOR are displayed in the table below and on<br />
Exhibit <strong>Fund</strong> 14, Revenue and Costs.<br />
Table IO 1 - Operating Results<br />
($ Millions) FY 2012 FY 2013 FY 2014<br />
Recoverable Net Operating Result 42.0 (135.2) (202.3)<br />
Deferred AOR 0.0 0.0 (344.0)<br />
Accumulated Operating Result 681.5 546.2 0.0<br />
New Orders<br />
Chart IO 5 - New Orders<br />
Industrial Operations<br />
activities develop workload<br />
8,000<br />
projections based on close<br />
7,000<br />
coordination with<br />
6,000<br />
customers and their<br />
5,000<br />
delivery schedule<br />
requirements. This budget<br />
4,000<br />
includes workload<br />
3,000<br />
assumptions associated<br />
2,000<br />
with base program<br />
1,000<br />
requirements and<br />
anticipated Reset workload<br />
0<br />
FY 2012 FY 2013 FY 2014<br />
included in the Overseas<br />
Total IO New Orders 6,188.6 5,103.0 4,401.0<br />
Contingency Operations<br />
IO Reset New Orders 1,542.2 1,142.1 1,069.1<br />
request. The Reset<br />
IO Other New Orders 4,646.4 3,960.9 3,331.9<br />
program ensures <strong>Army</strong><br />
Note: Numbers may not add due to rounding.<br />
equipment is restored to a<br />
level of combat capability commensurate with a unit’s future mission. The projected<br />
workload in FY 2013 and FY 2014 decreases slightly, in line with customer<br />
projections and budgeted depot maintenance requirements. Exhibit <strong>Fund</strong> 11, Source<br />
of New Orders and Revenue, displays total new order estimates by fund category.<br />
Carryover<br />
$ Millions<br />
Carryover, or unfilled orders, represents the dollar value of work that has been<br />
ordered and funded by customers but not completed by the industrial activities at the<br />
end of each fiscal year. Carryover leads to better planning, better decision making,<br />
and cost efficiencies. It provides lead time to assemble necessary workforce skill<br />
sets, to establish supply chains and to coordinate workload routing. Carryover also<br />
prevents production line stoppages and ensures the activities have funded work to<br />
provide a smooth transition between fiscal years. <strong>Army</strong> expects to be under the<br />
carryover ceiling in each fiscal year, reducing carryover by $1,300.6 million in<br />
58
<strong>Army</strong> <strong>Working</strong> <strong>Capital</strong> <strong>Fund</strong> (<strong>AWCF</strong>)<br />
Fiscal Year (FY) 2014 Budget Estimates<br />
FY 2013 and $1,622.4 million in FY 2014, as displayed on Exhibit <strong>Fund</strong> 11, Source of<br />
New Orders and Revenue, and Exhibit <strong>Fund</strong> 11a, Carryover Reconciliation.<br />
Chart IO 6 - New Orders and Carryover<br />
7,000<br />
6,000<br />
5,000<br />
$ Millions<br />
4,000<br />
3,000<br />
2,000<br />
1,000<br />
Table IO 2 - Performance Measurements<br />
0<br />
FY 2012 FY 2013 FY 2014<br />
New Orders 6,188.6 5,103.0 4,401.0<br />
Allowable Carryover 4,767.5 3,753.9 3,041.4<br />
Calculated Actual Carryover 4,573.4 3,404.0 1,867.7<br />
Note: Carryover amounts displayed account for carryover exclusions<br />
Performance Measurements<br />
Performance measurements and goals for the Industrial Operations activity group<br />
include Recoverable Net Operating Result (NOR) and Productive Yield. FY 2012<br />
actual results and projections for FY 2013 and FY 2014 are shown in the table below.<br />
Measurements/Goals FY 2012 FY 2013 FY 2014<br />
Recoverable Net Operating Result 42.0 (135.2) (202.3)<br />
Productive Yield (Goal 1,615) 1,502 1,617 1,616<br />
The customer rates in the budget return<br />
prior year gains, as reflected by the<br />
negative NOR, and also preserves $344.0<br />
million of Accumulated Operating Result<br />
(AOR) for resolution of potential prior year<br />
accounting issues.<br />
Productive Yield represents the average<br />
number of regular direct labor hours for<br />
each full time equivalent position involved<br />
in production and is an indicator of whether<br />
direct labor employees can support<br />
Patriot radar on display at<br />
Letterkenny <strong>Army</strong> Depot.<br />
59
$ Millions<br />
<strong>Army</strong> <strong>Working</strong> <strong>Capital</strong> <strong>Fund</strong> (<strong>AWCF</strong>)<br />
Fiscal Year (FY) 2014 Budget Estimates<br />
projected workload. The goal is 1,615 productive labor hours per employee,<br />
however, this does not reflect the additional training requirements implemented since<br />
the start of Operation Iraqi Freedom and Operation Enduring Freedom. The<br />
productive yield for FY 2012 was lower than planned due largely to training and the<br />
continued learning curve experienced by the deployment of the Logistics<br />
Modernization Program at the final ten Industrial Operations activities. Projections for<br />
FY 2013 and FY 2014 meet the productive yield goal.<br />
Appropriations<br />
No direct appropriations are requested in the budget.<br />
Collections, Disbursements, and Outlays<br />
Collections are calculated<br />
based on projected<br />
Chart IO 7 - Cash <strong>Management</strong><br />
7,000<br />
revenue and changes in<br />
6,000<br />
accounts receivable.<br />
5,000<br />
Disbursements are<br />
projected based on<br />
4,000<br />
monthly operating<br />
3,000<br />
expenses, changes in<br />
2,000<br />
accounts payable, and<br />
<strong>Capital</strong> Investment<br />
1,000<br />
Program obligations. Net<br />
0<br />
FY 2012 FY 2013 FY 2014<br />
outlays reflect the return of<br />
Collections 5,022.3 5,040.3 4,740.0<br />
Disbursements 5,906.5 5,883.9 5,512.3<br />
accumulated operating<br />
Net Outlays 884.2 843.5 772.3<br />
result to customers<br />
($202.3 million in FY 2014) and the treatment of internal work performed under<br />
the Logistics Modernization Program (LMP). Under the internal work performed<br />
process, there are no collections or disbursements between the Industrial<br />
Operations and Supply <strong>Management</strong> activity groups as LMP treats both entities<br />
as one company. This business process happens to result in an increased net<br />
outlay for the Industrial Operations activity, which is balanced by a decreased net<br />
outlay for the Supply <strong>Management</strong> activity.<br />
60
<strong>Army</strong> <strong>Working</strong> <strong>Capital</strong> <strong>Fund</strong> (<strong>AWCF</strong>)<br />
Fiscal Year (FY) 2014 Budget Estimates<br />
Minimum <strong>Capital</strong> Investment for Certain<br />
Depots and Arsenals<br />
The National Defense<br />
Authorization Acts for<br />
FY 2007, FY 2009 and<br />
FY 2012 require the five<br />
<strong>Army</strong> maintenance depots<br />
(Anniston, Red River,<br />
Letterkenny, Tobyhanna,<br />
and Corpus Christi), the<br />
three arsenals (Rock Island,<br />
Pine Bluff, and Watervliet)<br />
and Tooele <strong>Army</strong> Depot to<br />
invest the equivalent of at<br />
least six percent of funded<br />
workload in capital<br />
programs.<br />
Chart IO 8 – Minimum <strong>Capital</strong> Investment<br />
$ Millions<br />
400.0<br />
300.0<br />
200.0<br />
100.0<br />
0.0<br />
FY 2012 FY 2013 FY 2014<br />
Investment Percentage 6.5% 6.2% 4.4%<br />
Investment Target 304.2 306.4 312.9<br />
Investment Actual/Request 330.9 319.0 230.3<br />
Over / (Under) 26.7 12.6 (82.7)<br />
The chart displays the total investment target and total investment amount planned.<br />
<strong>Army</strong> investment met the six percent minimum requirement in FY 2012 and intends<br />
to meet the requirement in FY 2013. The <strong>Army</strong> is in the process of identifying<br />
additional investments for FY 2014 and is exploring the feasibility of pulling some of<br />
the FY 2015 requirements forward to FY 2014. With the expected decrease in<br />
overseas operations, investments tied to record revenue producing years is<br />
becoming increasingly challenging and may no longer be supportable or prudent as<br />
the force draws down. Exhibit <strong>Fund</strong> 6, Minimum <strong>Capital</strong> Investment for Certain<br />
Depots and Arsenals provides investment details by category for each activity.<br />
61
<strong>Army</strong> <strong>Working</strong> <strong>Capital</strong> <strong>Fund</strong><br />
Fiscal Year (FY) 2014 Budget Estimates<br />
Industrial Operations<br />
Revenue and Costs<br />
($ in Millions)<br />
FY 2012 FY 2013 FY 2014<br />
Revenue<br />
Gross Sales: 6,282.5 6,403.6 6,023.5<br />
Operations 6,143.6 6,230.3 5,859.7<br />
Surcharges<br />
Depreciation excluding Major Construction 138.9 173.2 163.7<br />
Other Income (Unfunded Depreciation) 32.7 0.0 0.0<br />
Other Income (Misc Gains/losses) 36.7 0.0 0.0<br />
Total Income: 6,351.9 6,403.6 6,023.5<br />
Costs<br />
Salaries and Wages: 2,109.3 2,039.5 1,884.2<br />
Military Personnel Compensation & Benefits 3.1 3.4 3.4<br />
Civilian Personnel Compensation & Benefits 2,106.2 2,036.2 1,880.8<br />
Travel & Transportation of Personnel 47.0 40.4 38.2<br />
Materials & Supplies (For Internal Operations) 2,380.8 2,915.0 2,941.4<br />
Equipment 66.6 84.5 74.1<br />
Other Purchases from Revolving <strong>Fund</strong>s 400.0 123.9 112.5<br />
Transportation of Things 13.5 11.6 10.3<br />
Depreciation - <strong>Capital</strong> 171.6 173.2 163.7<br />
Printing and Reproduction 1.9 2.9 3.0<br />
Advisory and Assistance Services 165.0 152.0 116.2<br />
Rent, Communication, Utilities, & Misc. Charges 92.9 102.0 94.5<br />
Other Purchased Services 917.8 947.8 840.6<br />
Total Costs: 6,366.4 6,592.8 6,278.8<br />
Operating Result (14.5) (189.3) (255.4)<br />
Other Changes Affecting NOR: 56.6 54.0 53.1<br />
Other Inventory Adjustments<br />
*Non-Recoverable Expenses 56.6 54.0 53.1<br />
Recoverable Net Operating Result 42.0 (135.2) (202.3)<br />
Other Changes Affecting AOR<br />
a. AOR Beginning of Year (Unadjusted) 639.4 681.5 546.2<br />
b. +/- Prior Year Adjustments<br />
c. Equals AOR BOY (Adjusted) 639.4 681.5 546.2<br />
d. +/- Net Operating Result 42.0 (135.2) (202.3)<br />
e. Deferred AOR (344.0)<br />
f. Equals Recoverable AOR EOP 681.5 546.2 0.0<br />
* Logistics Modernization Program Alternate Dispute Resolution Settlement $30.4M in FY 2012; depreciation on donated<br />
and transferred plant, property and equipment $22.0M in FY 2012, $54.0M in FY 2013, and $53.1M in FY 2014.<br />
62<br />
EXHIBIT FUND 14<br />
REVENUE AND COSTS
<strong>Army</strong> <strong>Working</strong> <strong>Capital</strong> <strong>Fund</strong><br />
Fiscal Year (FY) 2014 Budget Estimates<br />
Industrial Operations<br />
Source of New Orders and Revenue<br />
($ in Millions)<br />
1. New Orders<br />
FY 2012 FY 2013 FY 2014<br />
a. Orders from DoD Components:<br />
Department of <strong>Army</strong><br />
Operations & Maintenance, <strong>Army</strong> 2,368.6 2,263.2 1,978.0<br />
Operations & Maintenance, ARNG 182.0 152.7 69.1<br />
Operations & Maintenance, AR 145.2 134.5 4.3<br />
Subtotal, O&M: 2,695.8 2,550.4 2,051.4<br />
Aircraft Procurement 235.8 176.8 163.0<br />
Missile Procurement 42.8 0.7 0.7<br />
Weapons & Tracked Combat Vehicles 109.0 122.2 125.6<br />
Procurement of Ammunition 145.0 130.5 90.3<br />
Other Procurement 685.0 184.5 148.3<br />
Subtotal, Procurement: 1,217.7 614.9 528.0<br />
RDTE 33.1 14.1 5.9<br />
BRAC 0.1 0.3 0.3<br />
Family Housing 3.0 2.4 2.4<br />
Military Construction 8.0 0.0 0.0<br />
Chem Agents & Munitions Dest, <strong>Army</strong> 3.1 2.6 3.0<br />
Other 3.2 0.1 0.1<br />
Subtotal, Other <strong>Army</strong>: 50.6 19.4 11.6<br />
Subtotal, Department of <strong>Army</strong>: 3,964.1 3,184.7 2,591.0<br />
Department of Air Force O&M 110.8 72.0 84.4<br />
Department of Air Force Investment 78.7 59.3 43.2<br />
Department of Navy O&M 18.6 24.5 19.3<br />
Department of Navy Investment 30.6 19.4 22.3<br />
US Marines O&M 187.7 101.4 79.7<br />
US Marines Investment 11.3 22.3 19.4<br />
Other Department of Defense 63.3 44.5 32.2<br />
Subtotal, Other DoD Services: 501.0 343.4 300.5<br />
EXHIBIT FUND 11<br />
SOURCE OF NEW ORDERS AND REVENUE<br />
63
<strong>Army</strong> <strong>Working</strong> <strong>Capital</strong> <strong>Fund</strong><br />
Fiscal Year (FY) 2014 Budget Estimates<br />
Industrial Operations<br />
Source of New Orders and Revenue<br />
($ in Millions)<br />
FY 2012 FY 2013 FY 2014<br />
b. DWCF:<br />
Industrial Operations, <strong>Army</strong> 27.5 21.3 21.5<br />
Supply <strong>Management</strong>, <strong>Army</strong> 1,321.2 1,210.4 1,209.3<br />
Supply <strong>Management</strong>, Air Force 40.2 48.2 11.5<br />
Supply <strong>Management</strong>, Navy 50.9 66.0 53.0<br />
Supply <strong>Management</strong>, Marine Corps 3.6 0.0 0.0<br />
DECA 0.1 0.1 0.1<br />
DFAS 0.3 0.3 0.4<br />
DISA 1.3 1.8 1.9<br />
DLA 24.9 52.3 24.7<br />
TRANSCOM 0.1 0.0 0.0<br />
Other 1.2 10.2 10.1<br />
Subtotal, DWCF: 1,471.4 1,410.5 1,332.4<br />
c. Total DoD 5,936.4 4,938.7 4,223.9<br />
d. Other Orders:<br />
Other Federal Agencies 14.9 0.7 0.8<br />
Foreign Military Sales 157.7 39.6 106.7<br />
Nonappropriated 8.3 29.6 6.0<br />
Non-Federal Agencies 71.1 94.4 63.5<br />
Subtotal, Other Orders: 252.1 164.4 177.1<br />
Total New Orders: 6,188.6 5,103.0 4,401.0<br />
2. Carry-in Orders 5,054.2 4,960.3 3,659.7<br />
3. Total Gross Orders 11,242.7 10,063.3 8,060.7<br />
4. Revenue (-) 6,282.5 6,403.6 6,023.5<br />
5. End of Year Work-inProcess (-)<br />
6. FMS, BRAC, Other Federal, and Non-Federal orders 253.1 202.0 135.9<br />
Crash Damage 132.3 53.8 33.7<br />
4th Qtr Other Service Wkld 1.6 0.0 0.0<br />
7. <strong>Fund</strong>ed Carry-over 4,573.4 3,404.0 1,867.7<br />
8. Allowable Carry-over 4,767.5 3,753.9 3,041.4<br />
9. Over/(Under) Allowable Carry-over (194.0) (349.9) (1,173.7)<br />
64<br />
EXHIBIT FUND 11<br />
SOURCE OF NEW ORDERS AND REVENUE
<strong>Army</strong> <strong>Working</strong> <strong>Capital</strong> <strong>Fund</strong><br />
Fiscal Year (FY) 2014 Budget Estimates<br />
Industrial Operations<br />
Carryover Reconciliation<br />
($ in Millions)<br />
FY 2012 FY 2013 FY 2014<br />
1. Net Carry-In 5,054.2 4,960.3 3,659.7<br />
2. Revenue 6,282.5 6,403.6 6,023.5<br />
3. New Orders 6,188.6 5,103.0 4,401.0<br />
4. Exclusions:<br />
FMS 157.7 39.6 106.7<br />
BRAC 0.1 0.3 0.3<br />
Other Federal Depts & Agencies 14.9 0.7 0.8<br />
Non-Federal and Others 79.5 124.0 69.6<br />
Crash Damage 81.3 46.5 36.6<br />
4th Qtr Other Service Wkld 1.6 0.0 0.0<br />
5. Orders for Carryover Calculation 5,853.4 4,891.9 4,187.1<br />
2nd Yr Orders for Carryover Calculation 2,050.2 1,338.3 715.9<br />
6. Weighted Composite Outlay Rate 33.1% 36.2% 36.0%<br />
2nd Yr Weighted Composite Outlay Rate 58.6% 52.7% 49.7%<br />
7. Carryover Rate 66.9% 63.8% 64.0%<br />
2nd Yr Carryover Rate 41.4% 47.3% 50.3%<br />
8. Allowable Carryover (1st Year Outlay Rate 3,917.9 3,120.8 2,681.4<br />
Prior Year 2nd Yr Outlay Rate 849.5 633.1 360.0<br />
Total Allowable Carryover 4,767.5 3,753.9 3,041.4<br />
9. Balance of Customer Orders at Year End 4,960.3 3,659.7 2,037.3<br />
10. Exclusions:<br />
FMS 189.6 124.2 107.7<br />
BRAC 1.3 1.1 1.1<br />
Other Federal Depts & Agencies 21.2 5.1 1.9<br />
Non-Federal and Others 41.0 71.5 25.2<br />
Crash Damage 132.3 53.8 33.7<br />
4th Qtr Other Service Wkld 1.6 0.0 0.0<br />
11. Calculated Actual Carryover 4,573.4 3,404.0 1,867.7<br />
EXHIBIT FUND 11a<br />
CARRYOVER RECONCILIATION<br />
65
<strong>Army</strong> <strong>Working</strong> <strong>Capital</strong> <strong>Fund</strong><br />
Fiscal Year (FY) 2014 Budget Estimates<br />
Industrial Operations<br />
Changes in the Cost of Operations<br />
($ in Millions)<br />
Costs<br />
FY 2012 Estimated Actual 6,366.4<br />
FY 2013 Estimate in President's Budget<br />
6,493.7<br />
Pricing Adjustments 15.1<br />
FY 2013 Pay Raise 7.8<br />
-Civilian Personnel 7.8<br />
-Military Personnel 0.0<br />
Materials and Supplies 1.7<br />
Other 5.6<br />
Productivity Initiatives and Other Efficiencies 0.0<br />
Lean Program 20.1<br />
Value Engineering Program (1.3)<br />
Reinvestment of Lean savings (-) (18.7)<br />
Program Changes 84.0<br />
Labor 104.5<br />
Travel (12.0)<br />
Material (228.6)<br />
Equipment 6.9<br />
Transportation (5.0)<br />
Depreciation 42.8<br />
Advisory and Assistance Services 35.8<br />
Other Purchased Services 134.3<br />
Other 5.3<br />
FY 2013 Current Estimate 6,592.8<br />
Pricing Adjustments 14.0<br />
FY 2014 Pay Raise 17.6<br />
-Civilian Personnel 17.5<br />
-Military Personnel 0.1<br />
Materials and Supplies (32.3)<br />
Other 28.7<br />
Productivity Initiatives and Other Efficiencies 0.0<br />
Lean Program 10.4<br />
Value Engineering Program 4.9<br />
Reinvestment of Lean savings (-) (15.3)<br />
Program Changes (328.0)<br />
Labor (172.8)<br />
Travel (3.0)<br />
Material 58.7<br />
Equipment (11.8)<br />
Transportation (1.5)<br />
Depreciation (9.5)<br />
Advisory and Assistance Services (38.7)<br />
Other Purchased Services (125.1)<br />
Other (24.3)<br />
FY 2014 Budget Estimate 6,278.8<br />
66<br />
EXHIBIT FUND 2<br />
CHANGES IN THE COST OF OPERATIONS
<strong>Army</strong> <strong>Working</strong> <strong>Capital</strong> <strong>Fund</strong><br />
Fiscal Year (FY) 2014 Budget Estimates<br />
Industrial Operations<br />
Material Inventory Data<br />
($ in Millions)<br />
FY 2012<br />
Total Mobilization Operating Other<br />
Material Inventory BOP 1,382.0 0.0 1,382.0 0.0<br />
Purchases<br />
A. Purchases to Support Customer Orders (+) 2,343.3 0.0 2,343.3 0.0<br />
B. Purchase of long lead items in advance of customer orders (+) 32.4 0.0 32.4 0.0<br />
C. Other Purchases (list) (+) 68.8 0.0 68.8 0.0<br />
D. Total Purchases 2,444.5 0.0 2,444.5 0.0<br />
Material Inventory Adjustments<br />
A. Material Used in Maintenance (and billed/charged to customer orders) 2,380.8 0.0 2,380.8 0.0<br />
B. Disposals, theft, losses due to damages (-) 31.2 0.0 31.2 0.0<br />
C. Other reductions (list) (-) 0.0 0.0 0.0<br />
D. Total inventory adjustments 2,412.0 0.0 2,412.0 0.0<br />
Material Inventory EOP 1,414.5 0.0 1,414.5 0.0<br />
FY 2013<br />
Total Mobilization Operating Other<br />
Material Inventory BOP 1,414.5 0.0 1,414.5 0.0<br />
Purchases<br />
A. Purchases to Support Customer Orders (+) 2,059.6 0.0 2,059.6 0.0<br />
B. Purchase of long lead items in advance of customer orders (+) 589.7 0.0 589.7 0.0<br />
C. Other Purchases (list) (+) 76.2 0.0 76.2 0.0<br />
D. Total Purchases 2,725.5 0.0 2,725.5 0.0<br />
Material Inventory Adjustments<br />
A. Material Used in Maintenance (and billed/charged to customer orders) 2,915.0 0.0 2,915.0 0.0<br />
B. Disposals, theft, losses due to damages (-) 40.0 0.0 40.0 0.0<br />
C. Other reductions (list) (-) 0.2 0.0 0.2 0.0<br />
D. Total inventory adjustments 2,955.1 0.0 2,955.1 0.0<br />
Material Inventory EOP 1,184.9 0.0 1,184.9 0.0<br />
FY 2014<br />
Total Mobilization Operating Other<br />
Material Inventory BOP 1,184.9 0.0 1,184.9 0.0<br />
Purchases<br />
A. Purchases to Support Customer Orders (+) 2,569.5 0.0 2,569.5 0.0<br />
B. Purchase of long lead items in advance of customer orders (+) 27.4 0.0 27.4 0.0<br />
C. Other Purchases (list) (+) 71.7 0.0 71.7 0.0<br />
D. Total Purchases 2,668.6 0.0 2,668.6 0.0<br />
Material Inventory Adjustments<br />
A. Material Used in Maintenance (and billed/charged to customer orders) 2,941.4 0.0 2,941.4 0.0<br />
B. Disposals, theft, losses due to damages (-) 38.5 0.0 38.5 0.0<br />
C. Other reductions (list) (-) 0.2 0.0 0.2 0.0<br />
D. Total inventory adjustments 2,980.1 0.0 2,980.1 0.0<br />
Material Inventory EOP 873.4 0.0 873.4 0.0<br />
EXHIBIT FUND 16<br />
MATERIAL INVENTORY DATA<br />
67
<strong>Army</strong> <strong>Working</strong> <strong>Capital</strong> <strong>Fund</strong><br />
Fiscal Year (FY) 2014 Budget Estimates<br />
Industrial Operations<br />
Minimum <strong>Capital</strong> Investment for Certain Depots and Arsenals<br />
($ in Millions)<br />
FY 2012 FY 2013 FY 2014<br />
Anniston <strong>Army</strong> Depot<br />
Average Revenue for Investment 802.1 732.4 733.2<br />
<strong>Capital</strong> Investment Program 30.1 25.2 13.0<br />
Facilities Restoration and Modernization 4.3 1.6 1.6<br />
Equipment Modernization 8.3 7.2 7.0<br />
Productivity Enhancements 0.0 0.0 0.0<br />
MILCON 0.0 1.2 0.0<br />
Actual/ Budgeted Investment 42.7 35.2 21.5<br />
Required Investment 48.1 43.9 44.0<br />
Investment Over / (Under) Required Amount (5.5) (8.8) (22.5)<br />
Corpus Christi <strong>Army</strong> Depot<br />
Average Revenue for Investment 1,329.7 1,477.9 1,520.0<br />
<strong>Capital</strong> Investment Program 50.4 55.7 30.5<br />
Facilities Restoration and Modernization 2.6 0.8 0.8<br />
Equipment Modernization 14.3 29.8 30.3<br />
Productivity Enhancements 0.0 0.0 0.0<br />
MILCON 0.0 37.2 0.0<br />
Actual/ Budgeted Investment 67.3 123.5 61.6<br />
Required Investment 79.8 88.7 91.2<br />
Investment Over / (Under) Required Amount (12.4) 34.8 (29.6)<br />
Letterkenny <strong>Army</strong> Depot<br />
Average Revenue for Investment 637.5 655.7 673.9<br />
<strong>Capital</strong> Investment Program 10.9 22.7 12.0<br />
Facilities Restoration and Modernization 5.3 6.8 6.5<br />
Equipment Modernization 5.2 0.0 0.0<br />
Productivity Enhancements 0.0 0.0 0.0<br />
MILCON 1.2 0.0 0.0<br />
Actual/ Budgeted Investment 22.5 29.4 18.5<br />
Required Investment 38.2 39.3 40.4<br />
Investment Over / (Under) Required Amount (15.7) (9.9) (22.0)<br />
Red River <strong>Army</strong> Depot<br />
Average Revenue for Investment 819.0 798.0 877.4<br />
<strong>Capital</strong> Investment Program 21.4 22.2 46.0<br />
Facilities Restoration and Modernization 6.3 5.1 3.7<br />
Equipment Modernization 0.0 7.7 4.9<br />
Productivity Enhancements 0.0 0.4 0.4<br />
MILCON 44.0 0.0 0.0<br />
Actual/ Budgeted Investment 71.7 35.4 55.0<br />
Required Investment 49.1 47.9 52.6<br />
Investment Over / (Under) Required Amount 22.5 (12.5) 2.3<br />
68<br />
EXHIBIT FUND 6<br />
MINIMUM CAPITAL INVESTMENT FOR CERTAIN DEPOTS AND ARSENALS
<strong>Army</strong> <strong>Working</strong> <strong>Capital</strong> <strong>Fund</strong><br />
Fiscal Year (FY) 2014 Budget Estimates<br />
Industrial Operations<br />
Minimum <strong>Capital</strong> Investment for Certain Depots and Arsenals<br />
($ in Millions)<br />
FY 2012 FY 2013 FY 2014<br />
Tobyhanna <strong>Army</strong> Depot<br />
Average Revenue for Investment 822.4 845.1 869.4<br />
<strong>Capital</strong> Investment Program 22.7 25.3 15.7<br />
Facilities Restoration and Modernization 13.9 2.0 2.2<br />
Equipment Modernization 13.0 9.8 9.8<br />
Productivity Enhancements 0.4 0.4 0.4<br />
MILCON 0.0 4.0 0.0<br />
Actual/ Budgeted Investment 50.1 41.4 28.1<br />
Required Investment 49.3 50.7 52.2<br />
Investment Over / (Under) Required Amount 0.7 (9.3) (24.1)<br />
Pine Bluff Arsenal<br />
Average Revenue for Investment 156.7 155.2 148.4<br />
<strong>Capital</strong> Investment Program 5.7 5.4 3.5<br />
Facilities Restoration and Modernization 5.6 0.3 0.3<br />
Equipment Modernization 1.9 1.8 1.8<br />
Productivity Enhancements 0.1 0.0 0.0<br />
MILCON 0.0 0.0 0.0<br />
Actual/ Budgeted Investment 13.3 7.4 5.5<br />
Required Investment 9.4 9.3 8.9<br />
Investment Over / (Under) Required Amount 3.9 (1.9) (3.4)<br />
Rock Island Arsenal<br />
Average Revenue for Investment 333.3 289.9 246.5<br />
<strong>Capital</strong> Investment Program 13.5 15.4 6.5<br />
Facilities Restoration and Modernization 6.6 6.4 3.2<br />
Equipment Modernization 7.4 4.3 3.5<br />
Productivity Enhancements 0.0 0.0 0.0<br />
MILCON 0.0 2.1 0.0<br />
Actual/ Budgeted Investment 27.4 28.3 13.2<br />
Required Investment 20.0 17.4 14.8<br />
Investment Over / (Under) Required Amount 7.4 10.9 (1.6)<br />
Watervliet Arsenal<br />
Average Revenue for Investment 111.0 96.0 93.2<br />
<strong>Capital</strong> Investment Program 17.1 9.4 7.6<br />
Facilities Restoration and Modernization 5.9 4.4 4.4<br />
Equipment Modernization 0.0 0.0 0.0<br />
Productivity Enhancements 0.0 0.0 0.0<br />
MILCON 0.0 0.0 0.0<br />
Actual/ Budgeted Investment 23.0 13.8 12.0<br />
Required Investment 6.7 5.8 5.6<br />
Investment Over / (Under) Required Amount 16.3 8.1 6.4<br />
EXHIBIT FUND 6<br />
MINIMUM CAPITAL INVESTMENT FOR CERTAIN DEPOTS AND ARSENALS<br />
69
<strong>Army</strong> <strong>Working</strong> <strong>Capital</strong> <strong>Fund</strong><br />
Fiscal Year (FY) 2014 Budget Estimates<br />
Industrial Operations<br />
Minimum <strong>Capital</strong> Investment for Certain Depots and Arsenals<br />
($ in Millions)<br />
FY 2012 FY 2013 FY 2014<br />
Tooele <strong>Army</strong> Depot<br />
Average Revenue for Investment 58.5 57.2 53.7<br />
<strong>Capital</strong> Investment Program 2.5 3.8 1.6<br />
Facilities Restoration and Modernization 1.7 0.2 0.2<br />
Equipment Modernization 0.1 0.7 0.7<br />
Productivity Enhancements 0.0 0.0 0.0<br />
MILCON 8.7 0.0 12.5<br />
Actual/ Budgeted Investment 12.9 4.6 14.9<br />
Required Investment 3.5 3.4 3.2<br />
Investment Over / (Under) Required Amount 9.4 1.2 11.6<br />
TOTAL ARMY<br />
Average Revenue for Investment 5,070.1 5,107.4 5,215.7<br />
<strong>Capital</strong> Investment Program 174.2 185.0 136.4<br />
Facilities Restoration and Modernization 52.2 27.5 22.8<br />
Equipment Modernization 50.2 61.3 58.0<br />
Productivity Enhancements 0.5 0.7 0.7<br />
MILCON 53.8 44.5 12.5<br />
Actual/ Budgeted Investment 330.9 319.0 230.3<br />
Required Investment 304.2 306.4 312.9<br />
Investment Over / (Under) Required Amount 26.7 12.6 (82.7)<br />
Investment percentage 6.5% 6.2% 4.4%<br />
70<br />
EXHIBIT FUND 6<br />
MINIMUM CAPITAL INVESTMENT FOR CERTAIN DEPOTS AND ARSENALS
<strong>Army</strong> <strong>Working</strong> <strong>Capital</strong> <strong>Fund</strong><br />
Fiscal Year (FY) 2014 Budget Estimates<br />
Industrial Operations<br />
Fuel Data<br />
FY 2012<br />
FUEL PROCUREMENT<br />
COST PER EXTENDED<br />
BARRELS BARREL PRICE<br />
PRODUCT (millions) ($) ($ millions)<br />
Jet Fuel Widecut $204.96<br />
Jet Fuel Com'l Grade $159.60<br />
JP-5 0.007 $162.54 1.1<br />
AVGAS $184.38<br />
GASOHOL $166.74<br />
DIESEL 0.049 $145.32 7.1<br />
MOGAS Unleaded 0.019 $157.92 3.1<br />
MOGAS Leaded $161.70<br />
JP-8 0.021 $161.70 3.4<br />
Distillate Heating 0.000 $161.28 0.0<br />
Residual Heating $80.22<br />
Burner Fuel 0.005 $101.64 0.6<br />
Propane (MLP) 0.004 $50.40 0.2<br />
Diesel Heating Fuel 0.003 $156.66 0.4<br />
Natural Gas (CNG) 0.017 $6.01 0.1<br />
Other (list) 0.000 $98.28 0.0<br />
TOTAL 0.127 $2,159.35 16.1<br />
FY 2013<br />
FUEL PROCUREMENT<br />
COST PER EXTENDED<br />
BARRELS BARREL PRICE<br />
PRODUCT (millions) ($) ($ millions)<br />
Jet Fuel Widecut $191.94<br />
Jet Fuel Com'l Grade $155.82<br />
JP-5 0.016 $157.50 2.5<br />
AVGAS $178.92<br />
GASOHOL $161.70<br />
DIESEL 0.055 $140.70 7.8<br />
MOGAS Unleaded 0.026 $152.88 4.0<br />
MOGAS Leaded $156.66<br />
JP-8 0.024 $156.66 3.7<br />
Distillate Heating 0.010 $156.24 1.5<br />
Residual Heating $78.54<br />
Burner Fuel 0.014 $99.12 1.4<br />
Propane (MLP) 0.006 $41.16 0.2<br />
Diesel Heating Fuel 0.009 $152.88 1.4<br />
Natural Gas (CNG) 0.039 $5.96 0.2<br />
Other (list) 0.000 $98.28 0.0<br />
TOTAL 0.200 $2,084.96 22.9<br />
EXHIBIT FUND 15<br />
FUEL DATA<br />
71
<strong>Army</strong> <strong>Working</strong> <strong>Capital</strong> <strong>Fund</strong><br />
Fiscal Year (FY) 2014 Budget Estimates<br />
Industrial Operations<br />
Fuel Data<br />
FY 2014<br />
FUEL PROCUREMENT<br />
COST PER EXTENDED<br />
BARRELS BARREL PRICE<br />
PRODUCT (millions) ($) ($ millions)<br />
Jet Fuel Widecut $186.48<br />
Jet Fuel Com'l Grade $151.20<br />
JP-5 0.010 $152.88 1.5<br />
AVGAS $173.46<br />
GASOHOL $157.08<br />
DIESEL 0.090 $136.50 12.3<br />
MOGAS Unleaded 0.018 $148.26 2.6<br />
MOGAS Leaded $157.08<br />
JP-8 0.014 $152.04 2.1<br />
Distillate Heating 0.007 $151.62 1.1<br />
Residual Heating $76.02<br />
Burner Fuel 0.014 $96.18 1.4<br />
Propane (MLP) 0.006 $43.68 0.3<br />
Diesel Heating Fuel 0.003 $148.26 0.4<br />
Natural Gas (CNG) 0.052 $5.88 0.3<br />
Other (list) 0.000 $95.34 0.0<br />
TOTAL 0.213 $2,031.96 21.9<br />
72<br />
EXHIBIT FUND 15<br />
FUEL DATA
<strong>Capital</strong> Budget<br />
Introduction<br />
<strong>Army</strong> <strong>Working</strong> <strong>Capital</strong> <strong>Fund</strong> (<strong>AWCF</strong>)<br />
Fiscal Year (FY) 2014 Budget Estimates<br />
T<br />
he primary goal of the <strong>Capital</strong> Investment Program (CIP) within the<br />
<strong>AWCF</strong> is to establish a capability for reinvestment in the infrastructure of<br />
business areas to improve product and service quality and timeliness,<br />
reduce costs, and foster state-of-the-art business operations. The CIP<br />
provides the framework for planning, coordinating, and controlling <strong>AWCF</strong><br />
resources and expenditures to obtain capital assets. Included in the capital<br />
budget are the following types of assets: automated data processing equipment<br />
(ADPE); non-ADPE equipment; automated data processing software, whether<br />
internally or externally developed; and minor construction. The capital budget<br />
justifies the purchase of assets with a unit cost that is greater than or equal to<br />
$250,000 and have a useful life of two or more years.<br />
Headquarters, <strong>Army</strong> Materiel Command conducts a thorough vetting process to<br />
ensure capital projects deliver a positive return on investment and comply with<br />
strategic plans for each industrial facility. <strong>Capital</strong> projects within the Industrial<br />
Operations enterprise focuses primarily on replacing and upgrading equipment,<br />
while the Supply <strong>Management</strong> enterprise focus solely on software development<br />
in support of the Logistics Modernization Program.<br />
<strong>Capital</strong> budget obligation authority is displayed on the following exhibits:<br />
<strong>Fund</strong> 9a, <strong>Capital</strong> Investment Summary; <strong>Fund</strong> 9b, <strong>Capital</strong> Purchase Justification;<br />
and <strong>Fund</strong> 9c, <strong>Capital</strong> Budget Execution.<br />
The table below shows the Supply <strong>Management</strong> capital budget and associated<br />
cash outlays.<br />
Table CIP 1 – Supply <strong>Management</strong> <strong>Capital</strong> Budget<br />
($ Millions) FY 2012 FY 2013 FY 2014<br />
Software (LMP) 32.6 59.2 71.8<br />
<strong>Capital</strong> Cash Outlays 34.9 39.1 61.5<br />
73
<strong>Army</strong> <strong>Working</strong> <strong>Capital</strong> <strong>Fund</strong> (<strong>AWCF</strong>)<br />
Fiscal Year (FY) 2014 Budget Estimates<br />
The table below shows categories and respective values of the Industrial<br />
Operations capital budget and the projected capital cash outlays.<br />
Table CIP 2 – Industrial Operations <strong>Capital</strong> Budget<br />
($ Millions) FY 2012 FY 2013 FY 2014<br />
Equipment 124.2 83.6 75.0<br />
ADPE & Telecommunications 1.3 5.0 0.0<br />
Software 50.8 79.7 75.5<br />
Minor Construction 25.0 31.7 27.6<br />
Total 201.3 200.0 178.1<br />
<strong>Capital</strong> Cash Outlays 173.6 192.9 187.1<br />
74
<strong>Army</strong> <strong>Working</strong> <strong>Capital</strong> <strong>Fund</strong><br />
Fiscal Year (FY) 2014 Budget Estimates<br />
Supply <strong>Management</strong><br />
<strong>Capital</strong> Investment Summary<br />
($ Millions)<br />
Line No.<br />
Description<br />
FY 2012 FY 2013 FY 2014<br />
Quantity Total Cost Quantity Total Cost Quantity Total Cost<br />
00-02 SOFTWARE<br />
Logistics Modernization Program (LMP) 1 32.644 1 59.218 1 71.822<br />
SOFTWARE TOTAL 1 32.644 1 59.218 1 71.822<br />
ACTIVITY TOTAL 1 32.644 1 59.218 1 71.822<br />
Total <strong>Capital</strong> Outlays 34.881 39.075 61.466<br />
Total Depreciation Expense 84.186 86.900 86.900<br />
EXHIBIT FUND 9a<br />
CAPITAL INVESTMENT SUMMARY<br />
75
Line No<br />
00-02<br />
Item Description<br />
Logistics Modernization Program (LMP)<br />
Activity Identification<br />
Supply <strong>Management</strong><br />
FY 2012 FY 2013<br />
FY 2014<br />
Element of Cost Quantity Unit Cost Total Cost Quantity Unit Cost Total Cost Quantity Unit Cost Total Cost<br />
Logistics Modernization Program (LMP) 1 32.644 32.644 1 59.218 59.218 1 71.822 71.822<br />
Total 1 32.644 1 59.218 1 71.822 71.822<br />
Narrative Justification<br />
<strong>Army</strong> <strong>Working</strong> <strong>Capital</strong> <strong>Fund</strong><br />
Fiscal Year (FY) 2014 Budget Estimates<br />
Supply <strong>Management</strong><br />
<strong>Capital</strong> Purchase Justification<br />
($ Millions)<br />
SOFTWARE<br />
Logistics Modernization Program (LMP) leverages commercial market driven business process improvements. Although LMP is functional at each of AMC’s Life Cycle <strong>Management</strong> Commands, it continues to require<br />
enhancements and upgrades to maintain superior functionality and obtain auditable financial statements. Additionally, it is not yet integrated into overarching <strong>Army</strong> transformation efforts. Work continues to achieve<br />
these goals. The budget includes the following LMP enhancements under the LMP Increment II:<br />
• <strong>Army</strong> Prepositioned Stock enhancements will incorporate the war reserve secondary items requirements determination process in LMP.<br />
• National Maintenance Program (NMP) enhancements will improve the work loading, management processes, and financial integrities for depot-level work at NMP sites managed in LMP but executed in the Global<br />
Combat Support System - <strong>Army</strong>.<br />
• Acquisition of LMP software licenses in support of the <strong>Army</strong> plan to obtain ownership from the current service provider in FY 2013.<br />
• Incorporation of <strong>AWCF</strong> budgetary processes into the LMP system.<br />
• Integration of Non-<strong>Army</strong> Managed Items (NAMI) capability into LMP, enabling redistribution of <strong>Army</strong> assets and extending supply chain management of consumable items beyond the wholesale level in order to provide<br />
products and services to the point of consumption. NAMI enhancements will support the search matrix for NAMI, process Authorized Stock List replenishment requisitions, lateral redistribution, and NAMI return and<br />
disposals.<br />
ECONOMIC INDICATORS:<br />
Investment Cost (FY12-FY18) $232,865.000 Present Value of Benefits: $1,287,000.000 Benefit to Investment Ratio: 5.527 Payback Period:<br />
76<br />
EXHIBIT FUND 9b<br />
CAPITAL INVESTMENT SUMMARY
<strong>Army</strong> <strong>Working</strong> <strong>Capital</strong> <strong>Fund</strong><br />
Fiscal Year (FY) 2014 Budget Estimates<br />
Supply <strong>Management</strong><br />
<strong>Capital</strong> Purchase Execution<br />
($ Millions)<br />
Approved<br />
Approved<br />
Project Project Approved Current Asset/<br />
FY12 Title Amount Reprogs Proj Cost Proj Cost Deficiency<br />
Explanation<br />
SOFTWARE<br />
FY12 Logistics Modernization Program 32.644 0.000 32.644 32.644 0.000<br />
FY12 TOTAL 32.644 0.000 32.644 32.644 0.000<br />
Approved<br />
Approved<br />
Project Project Approved Current Asset/<br />
FY13 Title Amount Reprogs Proj Cost Proj Cost Deficiency<br />
Explanation<br />
SOFTWARE<br />
FY13 Logistics Modernization Program 59.218 0.000 59.218 59.218 0.000<br />
FY13 TOTAL 59.218 0.000 59.218 59.218 0.000<br />
Approved<br />
Approved<br />
Project Project Approved Current Asset/<br />
FY14 Title Amount Reprogs Proj Cost Proj Cost Deficiency<br />
Explanation<br />
SOFTWARE<br />
FY14 Logistics Modernization Program 71.822 0.000 71.822 71.822 0.000<br />
FY14 TOTAL 71.822 0.000 71.822 71.822 0.000<br />
EXHIBIT FUND 9c<br />
CAPITAL INVESTMENT SUMMARY<br />
77
<strong>Army</strong> <strong>Working</strong> <strong>Capital</strong> <strong>Fund</strong><br />
Fiscal Year (FY) 2014 Budget Estimates<br />
Industrial Operations<br />
<strong>Capital</strong> Investment Summary<br />
($ in Millions)<br />
FY 2012 FY 2013 FY 2014<br />
Line No. Description Quantity Total Cost Quantity Total Cost Quantity Total Cost<br />
05-13 EQUIPMENT CAPABILITIES<br />
- Replacement 56 69.029 32 40.953 20 28.709<br />
- Productivity 42 54.339 27 40.931 5 46.241<br />
- New Mission 0 0.000 0 0.000 0 0.000<br />
- Environmental 2 0.849 2 1.725 0 0.000<br />
EQUIPMENT TOTAL 100 124.217 61 83.609 25 74.950<br />
ADPE & Telecommunications Equipment Capabilities<br />
04-26 Miscellaneous ADPE 1 1.181 4 2.008 0 0.000<br />
06-46 Automatic Identification Technology (AIT) 1 0.107 1 3.000 0 0.000<br />
ADPE & TELECOMMUNICATIONS EQUIPMENT TOTAL 2 1.288 5 5.008 0 0.000<br />
SOFTWARE DEVELOPMENT<br />
99-08 <strong>Army</strong> Workload and Performance System (AWPS) 1 0.431 0 0.000 0 0.000<br />
10-03 Defense Property Accounting System - Enhanced (DPAS-E) 1 1.392 0 0.000 0 0.000<br />
00-02 Logistics Modernization Program (LMP) 1 48.960 1 79.650 1 75.523<br />
SOFTWARE TOTAL 3 50.783 1 79.650 1 75.523<br />
MINOR CONSTRUCTION CAPABILITIES<br />
05-26 Various Minor Construction $100K
<strong>Army</strong> <strong>Working</strong> <strong>Capital</strong> <strong>Fund</strong><br />
Fiscal Year (FY) 2014 Budget Estimates<br />
Industrial Operations<br />
<strong>Capital</strong> Purchase Justification<br />
($ in Millions)<br />
Equipment<br />
Line No<br />
Item Description Activity Identification<br />
05-13 Various <strong>Capital</strong> Equipment Industrial Operations<br />
Total Cost<br />
FY 2012 FY 2013 FY 2014<br />
Replacement 69.029 40.953 28.709<br />
Productivity 54.339 40.931 46.241<br />
New Mission 0.000 0.000 0.000<br />
Environmental 0.849 1.725 0.000<br />
Total 124.217 83.609 74.950<br />
Narrative Justification<br />
This exhibit represents equipment purchases costing more than $250K, which will improve the installations' efficiency through replacement, modification or addition of<br />
production and maintenance capability and compliance with new mission requirements. Equipment supports organic maintenance, overhaul, rebuild, reclamation,<br />
conversion, renovation, modification and repair programs.<br />
Acquisition of this equipment improves productivity; increases capacity that cannot be met with current equipment; replaces unsafe, inoperable or unusable assets;<br />
and includes requirements for environmental hazardous waste reduction or regulatory agency mandated requirements. This new equipment increases reliability and<br />
productivity, thus enabling the installation to be more efficient.<br />
If not acquired, equipment support capability would not provide for mission needs and would impact operations in the following ways: reduce mission capability, cause<br />
failure to meet present and future workload requirements, increase man-hour expenditures, cause inability to meet production schedules, lead to excessive downtime,<br />
increase maintenance costs, and decrease accuracy and dependability.<br />
Economic Analyses have been performed on individual projects when required and are available upon request.<br />
EXHIBIT FUND 9b<br />
CAPITAL PURCHASE JUSTIFICATION<br />
79
<strong>Army</strong> <strong>Working</strong> <strong>Capital</strong> <strong>Fund</strong><br />
Fiscal Year (FY) 2014 Budget Estimates<br />
Industrial Operations<br />
<strong>Capital</strong> Purchase Justification<br />
($ in Millions)<br />
AUTOMATED DATA PROCESSING EQUIPMENT (ADPE) AND TELECOMMUNICATIONS<br />
Total cost<br />
Line No<br />
Item Description<br />
Activity Identification<br />
04-26 Miscellaneous ADPE < $1M Industrial Operations FY 2012 FY 2013 FY 2014<br />
Miscellaneous ADPE < $1M 1.181 2.008 0.000<br />
Total 1.181 2.008 0.000<br />
Narrative Justification<br />
These miscellaneous information management projects replace old/obsolete and unreliable equipment with state-of-the-art equipment.<br />
Replacement of obsolete equipment will improve processing speeds, increase productivity and reduce maintenance costs. Projects allow sites to<br />
conform to <strong>Army</strong> standards and improve communications with other <strong>Army</strong> sites. New technology will improve security and lessen the threat of<br />
access by unauthorized sources.<br />
Without this investment, systems and equipment will continue to be unreliable, downtime will increase and administrative costs will rise. Users will<br />
be unable to communicate with higher headquarters, other installations, and customers via electronic means. Data will be at risk for release to<br />
unauthorized users.<br />
Economic Analyses have been performed on individual projects when required and are available upon request.<br />
80<br />
EXHIBIT FUND 9b<br />
CAPITAL PURCHASE JUSTIFICATION
Total Cost<br />
Line No<br />
06-46<br />
Item Description<br />
AIT<br />
Activity Identification<br />
Industrial Operations FY 2012 FY 2013 FY 2014<br />
Narrative Justification:<br />
<strong>Army</strong> <strong>Working</strong> <strong>Capital</strong> <strong>Fund</strong><br />
Fiscal Year (FY) 2014 Budget Estimates<br />
Industrial Operations<br />
<strong>Capital</strong> Purchase Justification<br />
($ in Millions)<br />
Automated Data Processing Equipment (ADPE) and Telecommunications<br />
Automatic Identification<br />
Technology (AIT) 0.107 3.000 0.000<br />
Total 0.107 3.000 0.000<br />
The <strong>Army</strong> <strong>Working</strong> <strong>Capital</strong> <strong>Fund</strong> (<strong>AWCF</strong>) Industrial Operations activities currently have extremely limited Automatic Identification Technology (AIT) capability.<br />
Current automated capabilities do not tie into an Enterprise Resource Planning (ERP), nor do they send data to shop floor control systems or<br />
inventory/accountability systems. This requires depot personnel to manually key data into systems resulting in expenditure of many man hours that could be used<br />
to perform other vital depot functions. Presently, AMC installations do not have the required business process hardware to support the use of automated reporting<br />
in their respective shop floor operations. They are unable to capitalize on labor/production reporting and material movement essential to delivering a modernized<br />
and efficient business solution to the shop floor. Presently AMC depots/arsenals/plants/activities/centers do not have the capability to read radio frequency<br />
identification (RFID) and interface with the wide area work flow (WAWF). They are unable to electronically accept vendor pallets and cases and report receipt to<br />
the WAWF.<br />
Continued implementation of AIT enterprise will provide state-of-the-art commercial and governmental off-the-shelf solutions that will enable the integration of AIT<br />
with AIS for data collection, keyless data entry, processing, storage, retrieval, transmission, and tracking of assets through the use of Radio Frequency<br />
Identification (RFID) technology. These funds provide technical engineering services, instruction and training, warranty, maintenance, documentation, and program<br />
management support. The modernized capabilities provided by moving from fragmented AIT and IT operations to a more consolidated enterprise solution will<br />
provide more efficient operations and optimize limited resources.<br />
Without funding, <strong>Army</strong> will not conform to OSD mandated AIT, RFID, WAWF and IUID policies. Currently, the intense data requirements require diverting labor<br />
and productivity to manually inputting data.<br />
Economic analysis not required. AIT and IUID are directed by OSD; therefore, an EA is not required for AIT and IUID implementation at AMC Industrial facilities.<br />
Reference policy memorandum, Acting DUSD (AT&L), 2 Oct 2003.<br />
EXHIBIT FUND 9b<br />
CAPITAL PURCHASE JUSTIFICATION<br />
81
<strong>Army</strong> <strong>Working</strong> <strong>Capital</strong> <strong>Fund</strong><br />
Fiscal Year (FY) 2014 Budget Estimates<br />
Industrial Operations<br />
<strong>Capital</strong> Purchase Justification<br />
($ in Millions)<br />
Software<br />
Line No Item Description<br />
Activity Identification Total Cost<br />
00-02 LMP<br />
Industrial Operations<br />
FY 2012 FY 2013 FY 2014<br />
Logistics Modernization Program (LMP) 48.960 79.650 75.523<br />
Total 48.960 79.650 75.523<br />
Narrative Justification:<br />
Logistics Modernization Program (LMP) leverages commercial market driven business process improvements. Although LMP is functional at each of AMC’s industrial<br />
facilities, it continues to require enhancements and upgrades to maintain superior industrial functionality and obtain auditable financial statements. Additionally, it is<br />
not yet integrated into overarching <strong>Army</strong> transformation efforts or extended into shop floor control activities. Work continues to achieve these goals. The budget<br />
includes the following LMP enhancements under the LMP Increment II:<br />
• Provides expanded Ammunition management capability; includes standardizing Automatic Identification Technology, centralized production status reporting, and<br />
extended supply network collaboration.<br />
• Automates the industrial base shop floor; includes electronic work instructions, elimination of manual processes, improved capacity planning and scheduling, Plant<br />
Equipment Maintenance, and Item Unique Identification capability.<br />
• Supports full integration of <strong>Army</strong> Logistics and <strong>Financial</strong> Enterprise from the shop floor to the top floor with increased efficiency and effectiveness.<br />
• Incorporates <strong>AWCF</strong> budgetary processes into the LMP system.<br />
ECONOMIC INDICATORS:<br />
Investment Cost $476,994.000 Present Value of Benefits: $ 1,287,000.000 Benefit to Investment Ra2.698<br />
Payback Period: 9.5 Yea<br />
82<br />
EXHIBIT FUND 9b<br />
CAPITAL PURCHASE JUSTIFICATION
<strong>Army</strong> <strong>Working</strong> <strong>Capital</strong> <strong>Fund</strong><br />
Fiscal Year (FY) 2014 Budget Estimates<br />
Industrial Operations<br />
<strong>Capital</strong> Purchase Justification<br />
($ in Millions)<br />
Minor Construction<br />
Total Cost<br />
Line No<br />
05-26<br />
Item Description<br />
Various Minor Construction
Approved Approved<br />
Project Project Approved Current Asset/<br />
FY12 Title Amount Reprogs Proj Cost Proj Cost Deficiency Explanation<br />
EQUIPMENT<br />
EQUIPMENT - Replacement<br />
<strong>Army</strong> <strong>Working</strong> <strong>Capital</strong> <strong>Fund</strong><br />
Fiscal Year (FY) 2014 Budget Estimates<br />
Industrial Operations<br />
<strong>Capital</strong> Budget Execution<br />
($ in Millions)<br />
FY12 DCRF Bridge Crane 0.000 2.440 2.440 2.440 0.000<br />
FY12 PMB Booth Airframes Cleaning 0.000 3.212 3.212 3.212 0.000<br />
FY12 FY11 Dynamometer 0.000 0.791 0.791 0.791 0.000<br />
FY12 dollars reprogrammed for FY11 equipment;<br />
obligation not included FY12 DFAS 1307 repor<br />
FY12 FY11 FTM1 & FTM 2 Test Stand 0.000 2.709 2.709 2.709 0.000<br />
FY12 dollars reprogrammed for FY11 equipment;<br />
obligation not included FY12 DFAS 1307 repor<br />
FY12 FY10 STTS 0.000 6.767 6.767 6.767 0.000<br />
FY12 dollars reprogrammed for FY10 equipment;<br />
obligation not included FY12 DFAS 1307 repor<br />
FY12 Paint Kitchen 0.000 0.485 0.485 0.485 0.000<br />
FY12 Electrical Discharge Machine (EDM) Replacement 0.000 0.411 0.411 0.411 0.000<br />
FY12 LM-STAR Test System 3.836 0.039 3.875 3.875 0.000<br />
FY12 Clean Room 0.564 (0.300) 0.264 0.264 0.000<br />
FY12 Paint Booth Replacement 3.869 0.086 3.955 3.955 0.000<br />
FY12 New Monorail System, Bldg 1180 0.400 0.130 0.530 0.530 0.000<br />
FY12 Bulldozer D8T CAT DEMIL 0.625 0.007 0.632 0.632 0.000<br />
FY12 Container Handler Truck, Lift 0.547 (0.047) 0.500 0.500 0.000<br />
FY12 Mobile Crane with Electromagnet 0.380 0.003 0.383 0.383 0.000<br />
FY12 5-Axis Machining Center 3.434 0.541 3.975 3.975 0.000<br />
FY12 CNC Vertical Turning Center 1.249 0.448 1.697 1.697 0.000<br />
FY12 Robotic Welder Building 108 0.370 (0.045) 0.325 0.325 0.000<br />
FY12 DGRC Media Blast Booth 2.903 (0.084) 2.819 2.819 0.000<br />
FY12 Hones 0.000 1.962 1.962 1.962 0.000<br />
FY12 Test Stand 0.000 1.336 1.336 1.336 0.000<br />
FY12 Hyd Test Stand 0.000 0.683 0.683 0.683 0.000<br />
FY12 Air blast System 0.000 0.999 0.999 0.999 0.000<br />
FY12 Metal Pre-processing 0.000 0.590 0.590 0.590 0.000<br />
FY12 Universal Grinder 0.000 1.533 1.533 1.533 0.000<br />
FY12 Plating Shop Conversion 0.000 2.080 2.080 2.080 0.000<br />
FY12 Rotary Blast 0.000 0.483 0.483 0.483 0.000<br />
FY12 Replace Component Paint Booth 0.320 0.218 0.538 0.538 0.000<br />
FY12 Robotic Coating System 4.174 0.687 4.861 4.861 0.000<br />
FY12 Climate Control for Building 315 0.724 0.000 0.724 0.724 0.000<br />
FY12 Upgrade Barrel Line Bldg 345 0.835 0.000 0.835 0.835 0.000<br />
FY12 Crossdive Transmission Test Stand 3.500 0.340 3.840 3.840 0.000<br />
FY12 Super Stacker Replacement 0.000 0.595 0.595 0.595 0.000<br />
FY12 Rebuild Heller Mills WV12168 and WV12169 0.750 0.000 0.750 0.750 0.000<br />
FY12 Rebuild 1000 Ton Hydraulic Press WV12269 0.675 0.281 0.956 0.956 0.000<br />
FY12 Rebuild Guide Bore WV12502 0.975 0.000 0.975 0.975 0.000<br />
FY12 New Pull Bore Machine, B35 0.000 2.385 2.385 2.385 0.000<br />
FY12 New Rapid Bore 0.000 1.361 1.361 1.361 0.000<br />
FY12 New Rapid Bore Machine 1.200 0.225 1.425 1.425 0.000<br />
FY12 Two New 26ft CNC Lathes, B35 0.000 4.348 4.348 4.348 0.000<br />
FY12 Automated Frame Blast & Paint Equipment 5.879 (5.879) 0.000 0.000 0.000<br />
84<br />
EXHIBIT FUND 9c<br />
CAPITAL BUDGET EXECUTION
Approved Approved<br />
Project Project Approved Current Asset/<br />
FY12 Title Amount Reprogs Proj Cost Proj Cost Deficiency Explanation<br />
EQUIPMENT<br />
<strong>Army</strong> <strong>Working</strong> <strong>Capital</strong> <strong>Fund</strong><br />
Fiscal Year (FY) 2014 Budget Estimates<br />
Industrial Operations<br />
<strong>Capital</strong> Budget Execution<br />
($ in Millions)<br />
EQUIPMENT - Replacement cont.<br />
FY12 New horizontal CNC Mill w/Swiveling Spindle 2.300 (2.300) 0.000 0.000 0.000<br />
FY12 Stryker Top Coat Paint System 3.172 (3.172) 0.000 0.000 0.000<br />
FY12 Enclose And AC Engine Rebuild Area 1.560 (1.560) 0.000 0.000 0.000<br />
FY12 Replace McLeod and Steel Bay 1.271 (1.271) 0.000 0.000 0.000<br />
FY12 VDATS Automated Test Station 1.876 (1.876) 0.000 0.000 0.000<br />
FY12 HVAC BCA FY11 Bldg 3, Bay 3 moved from FY11 0.818 (0.818) 0.000 0.000 0.000<br />
FY12 Rebuild Scharmann Mill WV12317 0.750 (0.750) 0.000 0.000 0.000<br />
FY12 Jig Grinder 1.637 (1.637) 0.000 0.000 0.000<br />
FY12 New Composite Winding Machine 2.500 (2.500) 0.000 0.000 0.000<br />
FY12 Electron Beam Welder 2.471 (2.471) 0.000 0.000 0.000<br />
FY12 New Inconel Furnace 1.650 (1.650) 0.000 0.000 0.000<br />
FY12 Rebuild Two S60 Omni Mills WV12342 and WV12343 1.400 (1.400) 0.000 0.000 0.000<br />
FY12 Replace Power Washers Bldg 345 1.847 (1.847) 0.000 0.000 0.000<br />
FY12 High Capacity Tool Room Lathe 0.297 (0.297) 0.000 0.000 0.000<br />
FY12 345 Assembly Line Conveyor System 1.100 (1.100) 0.000 0.000 0.000<br />
FY12 New Gantry Bed Mill 2.000 (2.000) 0.000 0.000 0.000<br />
EQUIPMENT<br />
Subtotal Replacement 63.858 5.171 69.029 69.029 0.000<br />
EQUIPMENT - Productivity<br />
FY12 Dynamic Components Production Equipment 10.348 1.070 11.418 11.418 0.000<br />
FY12 Aircraft Corrosion Control Equip 16.588 (2.301) 14.287 14.287 0.000<br />
FY12 Vacuum Furnace 0.999 (0.999) 0.000 0.000 0.000<br />
FY12 Horizontal Drilling and Boring Mill 2.352 0.980 3.332 3.332 0.000<br />
FY12 Blade Facility Productivity Equipment 0.000 0.402 0.402 0.402 0.000<br />
FY12 Stand-Alone Paint Booth 1.100 (0.245) 0.855 0.855 0.000<br />
FY12 Unit Load End of Aisle Picking, Bldg 370 ASRS 0.625 0.071 0.696 0.696 0.000<br />
FY12 Rough Terrain Container Handler 0.000 0.697 0.697 0.697 0.000<br />
FY12 CO2 Laser Cutter 0.000 1.287 1.287 1.287 0.000<br />
FY12 SCATS 0.000 0.669 0.669 0.669 0.000<br />
FY12 Wash Out Improvement Air Scrubber 0.000 0.890 0.890 0.890 0.000<br />
FY12 Terex Super stacker Container Handler 0.000 0.500 0.500 0.500 0.000<br />
FY12 Bomb Heat Treating System 1.387 0.265 1.652 1.652 0.000<br />
FY12 Refurbish 120MM Mortar Body Load B. 44-110 1.929 0.890 2.819 2.819 0.000<br />
FY12 Bio-Detectors Emergency Generators, B. 53-990 0.000 0.281 0.281 0.281 0.000<br />
FY12 Sandblasting System 0.000 0.400 0.400 0.400 0.000<br />
FY12 Grinding Machines 0.000 2.548 2.548 2.548 0.000<br />
EXHIBIT FUND 9c<br />
CAPITAL BUDGET EXECUTION<br />
85
Approved Approved<br />
Project Project Approved Current Asset/<br />
FY12 Title Amount Reprogs Proj Cost Proj Cost Deficiency Explanation<br />
EQUIPMENT<br />
EQUIPMENT - Productivity cont.<br />
FY12 X1410 Transmission 0.000 1.427 1.427 1.427 0.000<br />
FY12 Powertrain Claim Settlement 0.000 2.574 2.574 2.574 0.000 FY12 funds used to pay FY05 COE claim<br />
FY12 Aluminum Oxide Blast 0.423 0.543 0.966 0.966 0.000<br />
FY12 Abrasive Blaster - Twin Table 0.000 0.446 0.446 0.446 0.000<br />
FY12 Rapid Prototype Machine 0.000 0.470 0.470 0.470 0.000<br />
FY12 Structural Shape Processing Laser 0.000 1.650 1.650 1.650 0.000<br />
FY12 CNC Universal Grinder 1.400 0.258 1.658 1.658 0.000<br />
FY12 X-Ray Vehicle Scanner at CVO ACP 0.000 2.415 2.415 2.415 0.000<br />
FY12 Anti-Ice Valve Test Stands 0.810 (0.810) 0.000 0.000 0.000<br />
FY12 Drive-In Shot Blast 1.029 (1.029) 0.000 0.000 0.000<br />
FY12 Drive-In Wash Booth 0.560 (0.560) 0.000 0.000 0.000<br />
FY12 Robotic Welding-Modular 0.917 (0.917) 0.000 0.000 0.000<br />
FY12 7-Axis Horiz Mill 4.774 (4.774) 0.000 0.000 0.000<br />
FY12 Boring Mill 1.944 (1.944) 0.000 0.000 0.000<br />
FY12 Blast House 0.400 (0.400) 0.000 0.000 0.000<br />
FY12 Tube Laser 1.650 (1.650) 0.000 0.000 0.000<br />
FY12 Vertical Stretch Press 2.174 (2.174) 0.000 0.000 0.000<br />
FY12 Bridge Crane System Hanger 43 0.384 (0.384) 0.000 0.000 0.000<br />
FY12 Building 57 Dip Tanks 0.350 (0.350) 0.000 0.000 0.000<br />
FY12 RotorHead Control/Head Production Equipment 2.361 (2.361) 0.000 0.000 0.000<br />
FY12 Grit Blast System 0.710 (0.710) 0.000 0.000 0.000<br />
FY12 Remote Control HES 0.686 (0.686) 0.000 0.000 0.000<br />
FY12 3/4 Inch Shearing Machine 0.282 (0.282) 0.000 0.000 0.000<br />
FY12 Forging Press 0.588 (0.588) 0.000 0.000 0.000<br />
FY12 Various QWE Projects 7.000 (7.000) 0.000 0.000 0.000 Equates to FY12 $15M (DA)<br />
EQUIPMENT<br />
<strong>Army</strong> <strong>Working</strong> <strong>Capital</strong> <strong>Fund</strong><br />
Fiscal Year (FY) 2014 Budget Estimates<br />
Industrial Operations<br />
<strong>Capital</strong> Budget Execution<br />
($ in Millions)<br />
Subtotal Productivity 63.770 (9.431) 54.339 54.339 0.000<br />
EQUIPMENT - New Mission<br />
FY12 Various <strong>Capital</strong> Equipment - New Mission 0.000 0.000 0.000 0.000 0.000<br />
Subtotal New Mission 0.000 0.000 0.000 0.000 0.000<br />
EQUIPMENT - Environmental<br />
FY12 VOC Upgrade 0.525 (0.525) 0.000 0.000 0.000<br />
FY12 Airfield Rescue Firefighting Truck (ARFT) 0.739 0.110 0.849 0.849 0.000<br />
Subtotal Environmental 1.264 (0.415) 0.849 0.849 0.000<br />
Total Various <strong>Capital</strong> Equipment 128.892 (4.675) 124.217 124.217 0.000<br />
86<br />
EXHIBIT FUND 9c<br />
CAPITAL BUDGET EXECUTION
Approved Approved<br />
Project Project Approved Current Asset/<br />
FY12 Title Amount Reprogs Proj Cost Proj Cost Deficiency Explanation<br />
ADPE & TELECOMMUNICATIONS EQUIPMENT<br />
FY12 Miscellaneous ADPE
Approved Approved<br />
Project Project Approved Current Asset/<br />
FY12 Title Amount Reprogs Proj Cost Proj Cost Deficiency Explanation<br />
MINOR CONSTRUCTION<br />
<strong>Army</strong> <strong>Working</strong> <strong>Capital</strong> <strong>Fund</strong><br />
Fiscal Year (FY) 2014 Budget Estimates<br />
Industrial Operations<br />
<strong>Capital</strong> Budget Execution<br />
($ in Millions)<br />
FY12 Renovate Bldg S-392 0.000 0.441 0.441 0.441 0.000<br />
FY12 Renovate Bldg S-393 0.000 0.346 0.346 0.346 0.000<br />
FY12 TRMD Logistics Support Addition 0.000 0.519 0.519 0.519 0.000<br />
FY12 HVAC Bldg 2 Bay 1 0.000 0.746 0.746 0.746 0.000<br />
FY12 HVAC BCA FY13 0.742 0.000 0.742 0.742 0.000<br />
FY12 HVAC Forward Repair Bldg 2 Bay 6 (Bldg 2 RTC HVAC) 0.000 0.355 0.355 0.355 0.000<br />
FY12 Restroom Bldg 2 Bay 5 (Bldg 2 for ADAM Cell) 0.000 0.305 0.305 0.305 0.000<br />
FY12 Building 3 Restroom Improvements 0.572 (0.326) 0.246 0.246 0.000<br />
FY12 HVAC BCA Bldg 3, Bay 3 0.000 0.750 0.750 0.750 0.000<br />
FY12 Service Magazine for Demo Pit at ADMC 0.700 0.000 0.700 0.700 0.000<br />
FY12 Small Arms Ammo Magazine 0.700 0.000 0.700 0.700 0.000<br />
FY12 Propellant Thermal Treatment Facility 0.000 0.749 0.749 0.749 0.000<br />
FY12 Inert Storage 2350 0.000 0.629 0.629 0.629 0.000<br />
FY12 Magazine Support Facility 0.000 0.744 0.744 0.744 0.000<br />
FY12 Lunch and Locker Bldg 174 0.000 0.706 0.706 0.706 0.000<br />
FY12 Manufacturing Facility Upgrade Bldg 165 0.711 0.019 0.730 0.730 0.000<br />
FY12 Bldg 100 Addition 0.000 0.493 0.493 0.493 0.000<br />
FY12 Upgrade Fire Protection System, B. 33-570 0.496 (0.221) 0.275 0.275 0.000<br />
FY12 Carpenter Shop Addition, B. 34-930 0.000 0.614 0.614 0.614 0.000<br />
FY12 Upgrade bldg 594 0.000 0.457 0.457 0.457 0.000<br />
FY12 AEMD Opgs Building 0.000 0.743 0.743 0.743 0.000<br />
FY12 Vehicle Staging 0.000 0.733 0.733 0.733 0.000<br />
FY12 Fire Station Expansion 0.000 0.725 0.725 0.725 0.000<br />
FY12 Upgrade Old Small Arms Bldg 129 0.000 0.746 0.746 0.746 0.000<br />
FY12 Central Fire Alarm 0.000 0.719 0.719 0.719 0.000<br />
FY12 In-Process Storage Shed, Bldg 190 0.725 0.000 0.725 0.725 0.000<br />
FY12 Upgrade Vehicle Staging Area - Test Track 0.000 0.749 0.749 0.749 0.000<br />
FY12 Cover Area Between B/W Paint Booth 0.000 0.744 0.744 0.744 0.000<br />
FY12 Bldg 493 Security Fencing and Lighting 0.730 0.000 0.730 0.730 0.000<br />
FY12 Expand Building 106 (Pass & ID) Facilities, Restrooms & Parking 0.708 0.012 0.720 0.720 0.000<br />
FY12 Construct 7 Acre Hardstand 0.749 (0.001) 0.748 0.748 0.000<br />
FY12 Airfield Crash Crew Building 0.264 0.000 0.264 0.264 0.000<br />
FY12 Airfield Operations Building 0.396 0.000 0.396 0.396 0.000<br />
FY12 Truck Docks Offload Facility 0.000 0.644 0.644 0.644 0.000<br />
FY12 LAMS (Shelter) & Pad for EoFLCC Parts Storage 0.000 0.463 0.463 0.463 0.000<br />
FY12 Centralized Restrooms, Break rooms, & Offices in Warehouse Facility 0.000 0.296 0.296 0.296 0.000<br />
FY12 Replace Substation 2A1 Medium Voltage Switchgea 0.000 0.726 0.726 0.726 0.000<br />
FY12 Upgrade Fire Alarm Systems in Bldg 135 0.000 0.749 0.749 0.749 0.000<br />
FY12 Replace Underground Electrical Cables 0.000 0.274 0.274 0.274 0.000<br />
FY12 Upgrade Fire Alarm Systems in Bldg 136 0.000 0.501 0.501 0.501 0.000<br />
FY12 Upgrade Fire Alarm Protection System, B25 0.000 0.508 0.508 0.508 0.000<br />
88<br />
EXHIBIT FUND 9c<br />
CAPITAL BUDGET EXECUTION
<strong>Army</strong> <strong>Working</strong> <strong>Capital</strong> <strong>Fund</strong><br />
Fiscal Year (FY) 2014 Budget Estimates<br />
Industrial Operations<br />
<strong>Capital</strong> Budget Execution<br />
($ in Millions)<br />
Approved Approved<br />
Project Project Approved Current Asset/<br />
FY12 Title Amount Reprogs Proj Cost Proj Cost Deficiency Explanation<br />
MINOR CONSTRUCTION, cont.<br />
FY12 Upgrade Fire Alarm Sys, Strg and Lt Mfg 0.000 0.279 0.279 0.279 0.000<br />
FY12 Replace Substation 3A3A, B36 0.000 0.592 0.592 0.592 0.000<br />
FY12 Lightning, Break Room Upgrade Bldg 160 0.462 (0.462) 0.000 0.000 0.000<br />
FY12 Fire/Lightning/Break Room Upgrade Bldg 104 0.733 (0.733) 0.000 0.000 0.000<br />
FY12 Building 72A Addition (SMART-T) 0.749 (0.749) 0.000 0.000 0.000<br />
FY12 Tire Shop 0.501 (0.501) 0.000 0.000 0.000<br />
FY12 Infrastructure Improvements Building 3 0.747 (0.747) 0.000 0.000 0.000<br />
FY12 Upgrade Fire Protection System, B. 33-670 0.395 (0.395) 0.000 0.000 0.000<br />
FY12 Upgrade Fire Protection System, B. 32-610 0.548 (0.548) 0.000 0.000 0.000<br />
FY12 Heating Replacement Building 508 0.703 (0.703) 0.000 0.000 0.000<br />
FY12 Security Visitors Center Addition 0.749 (0.749) 0.000 0.000 0.000<br />
FY12 Construct North Pad Upgrade at Anniston 0.735 (0.735) 0.000 0.000 0.000<br />
FY12 Construct Service Magazine South Pad Complex 0.700 (0.700) 0.000 0.000 0.000<br />
FY12 Construct Inert Storage Building, ADMC 0.630 (0.630) 0.000 0.000 0.000<br />
FY12 Hot Salt Bath Cleaning Area, Bldg 409 0.723 (0.723) 0.000 0.000 0.000<br />
FY12 Building 213 Wash Rack Upgrade 0.633 (0.633) 0.000 0.000 0.000<br />
FY12 Dock Hardstand Area 0.748 (0.748) 0.000 0.000 0.000<br />
FY12 Administrative Building for HMMS Personne 0.749 (0.749) 0.000 0.000 0.000<br />
FY12 Support Equipment Division Storage Area 1.471 (1.471) 0.000 0.000 0.000<br />
FY12 Mail Facility 0.740 (0.740) 0.000 0.000 0.000<br />
FY12 Electrical System Upgrade 0.725 (0.725) 0.000 0.000 0.000<br />
FY12 Consolidated Equipment Maintenance Facility, Bldg 133 0.747 (0.747) 0.000 0.000 0.000<br />
FY12 Inert Storage Facility 0.604 (0.604) 0.000 0.000 0.000<br />
FY12 Defense Non-Tactical Generator And Rail Center 7.113 (7.113) 0.000 0.000 0.000<br />
FY12 Alteration to Building 531 0.744 (0.744) 0.000 0.000 0.000<br />
FY12 South Boundary Fencing 0.720 (0.720) 0.000 0.000 0.000<br />
FY12 Heat & Insulate Warehouse 0.550 (0.550) 0.000 0.000 0.000<br />
FY12 Provide Fire Protection System 0.500 (0.500) 0.000 0.000 0.000<br />
FY12 Build Battery Charging Station 0.158 (0.158) 0.000 0.000 0.000<br />
FY12 Construct Radiator Shop Facility 0.595 (0.595) 0.000 0.000 0.000<br />
FY12 Engine/Trans Equipment Maintenance Facility 0.740 (0.740) 0.000 0.000 0.000<br />
FY12 Stryker Topcoat Facility 0.741 (0.741) 0.000 0.000 0.000<br />
FY12 Power pack Mating Facility 0.725 (0.725) 0.000 0.000 0.000<br />
FY12 Various QWE Projects 8.000 (8.000) 0.000 0.000 0.000 Equates to FY12 $15M (DA)<br />
Subtotal Minor Construction 42.871 (17.850) 25.021 25.021 0.000<br />
TOTAL 250.513 (49.204) 201.309 201.309 0.000<br />
EXHIBIT FUND 9c<br />
CAPITAL BUDGET EXECUTION<br />
89
<strong>Army</strong> <strong>Working</strong> <strong>Capital</strong> <strong>Fund</strong><br />
Fiscal Year (FY) 2014 Budget Estimates<br />
Industrial Operations<br />
<strong>Capital</strong> Budget Execution<br />
($ in Millions)<br />
Project Approved<br />
Title Project Approved Current Asset/<br />
FY13 Amount Reprogs Proj Cost Proj Cost Deficiency Explanation<br />
EQUIPMENT 83.609 0.000 83.609 83.609 0.000<br />
FY13 EQUIPMENT-Replacement<br />
Various <strong>Capital</strong> Equipment - Replacement 40.953 0.000 40.953 40.953 0.000<br />
FY13 EQUIPMENT-Productivity<br />
Various <strong>Capital</strong> Equipment - Productivity 40.931 0.000 40.931 40.931 0.000<br />
FY13 EQUIPMENT - New Mission<br />
Various <strong>Capital</strong> Equipment - New Mission 0.000 0.000 0.000 0.000 0.000<br />
FY13 EQUIPMENT-Environmental<br />
Various <strong>Capital</strong> Equipment - Environmental 1.725 0.000 1.725 1.725 0.000<br />
ADPE & TELECOMMUNICATIONS EQUIPMENT 5.008 0.000 5.008 2.008 3.000<br />
FY13 Miscellaneous ADPE < $1M 2.008 0.000 2.008 2.008 0.000<br />
FY13 Automatic Identification Technology (AIT) 3.000 0.000 3.000 0.000 3.000<br />
SOFTWARE DEVLOPMENT 79.650 0.000 79.650 79.650 0.000<br />
FY13 <strong>Army</strong> Workload and Performance System (AWPS) 0.000 0.000 0.000 0.000 0.000<br />
FY13 Expanded Ammunition Functionality with LMP 0.000 0.000 0.000 0.000 0.000<br />
FY13 Defense Property Accounting System - Enhanced (DPAS-E) 0.000 0.000 0.000 0.000 0.000<br />
FY13 Logistics Modernization Program (LMP) 79.650 0.000 79.650 79.650 0.000<br />
FY13 Integration of AIT with LMP 0.000 0.000 0.000 0.000 0.000<br />
MINOR CONSTRUCTION 31.703 0.000 31.703 31.703 0.000<br />
FY13 Various Minor Construction
<strong>Army</strong> <strong>Working</strong> <strong>Capital</strong> <strong>Fund</strong><br />
Fiscal Year (FY) 2014 Budget Estimates<br />
Industrial Operations<br />
<strong>Capital</strong> Budget Execution<br />
($ in Millions)<br />
Approved Approved<br />
Project Project Approved Current Asset/<br />
FY14 Title Amount Reprogs Proj Cost Proj Cost Deficiency Explanation<br />
EQUIPMENT 74.950 0.000 74.950 74.950 0.000<br />
FY14 EQUIPMENT - Replacement<br />
Various <strong>Capital</strong> Equipment - Replacement 28.709 0.000 28.709 28.709 0.000<br />
FY14 EQUIPMENT - Productivity<br />
Various <strong>Capital</strong> Equipment - Productivity 46.241 0.000 46.241 46.241 0.000<br />
FY14 EQUIPMENT - New Mission<br />
Various <strong>Capital</strong> Equipment - New Mission 0.000 0.000 0.000 0.000 0.000<br />
FY14 EQUIPMENT-Environmental<br />
Various <strong>Capital</strong> Equipment - Environmental 0.000 0.000 0.000 0.000 0.000<br />
ADPE & TELECOMMUNICATIONS EQUIPMENT 0.000 0.000 0.000 0.000 0.000<br />
FY14 Miscellaneous ADPE < $1M 0.000 0.000 0.000 0.000 0.000<br />
FY14 Automatic Identification Technology (AIT) 0.000 0.000 0.000 0.000 0.000<br />
SOFTWARE DEVELOPMENT 75.523 0.000 75.523 75.523 0.000<br />
FY14 <strong>Army</strong> Workload and Performance System (AWPS) 0.000 0.000 0.000 0.000 0.000<br />
FY14 Expanded Ammunition Functionality with LMP 0.000 0.000 0.000 0.000 0.000<br />
FY14 Defense Property Accounting System - Enhanced (DPAS-E) 0.000 0.000 0.000 0.000 0.000<br />
FY14 Logistics Modernization Program (LMP) 75.523 0.000 75.523 75.523 0.000<br />
FY14 Integration of AIT with LMP 0.000 0.000 0.000 0.000 0.000<br />
MINOR CONSTRUCTION 27.594 0.000 27.594 27.594 0.000<br />
FY14 Various Minor Construction
This Page Intentionally Left Blank
Soldier’s Creed<br />
I am an American Soldier.<br />
I am a Warrior and a member of a team.<br />
I serve the people of the United States and live the <strong>Army</strong> Values.<br />
I will always place the mission first.<br />
I will never accept defeat.<br />
I will never quit.<br />
I will never leave a fallen comrade.<br />
I am disciplined, physically and mentally tough, trained and proficient in<br />
my warrior tasks and drills.<br />
I always maintain my arms, my equipment and myself.<br />
I am an expert and I am a professional.<br />
I stand ready to deploy, engage, and destroy the enemies of the<br />
United States of America in close combat.<br />
I am a guardian of freedom and the American way of life.<br />
I am an American Soldier.
This Page Intentionally Left Blank