Statistics - SLC Home Page
Statistics - SLC Home Page
Statistics - SLC Home Page

You also want an ePaper? Increase the reach of your titles
YUMPU automatically turns print PDFs into web optimized ePapers that Google loves.
Math 201-337-77<br />
<strong>Statistics</strong><br />
Test III (version a)<br />
7XHVGD\ 1RYHPEHU (d59)<br />
NAME: ___________________________________<br />
20<br />
For each of the following, make sure you carefully describe your solution by clearly identifying your data and<br />
using the correct notation. You are required to state the general formula for the confidence interval before<br />
you proceed. Keep at least 2 decimals in your calculations.<br />
1.<br />
2 points<br />
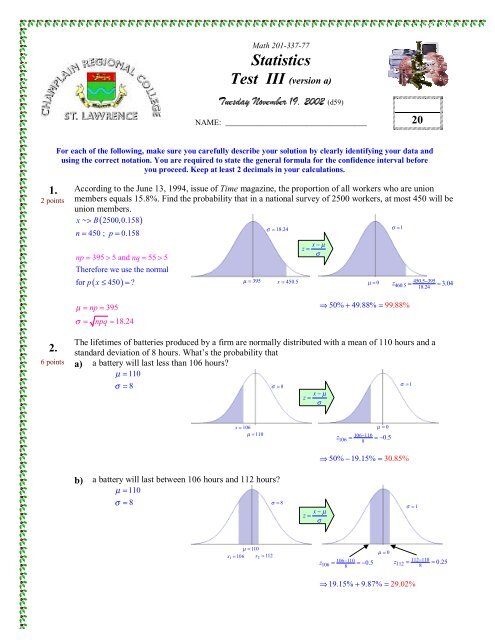
According to the June 13, 1994, issue of Time magazine, the proportion of all workers who are union<br />
members equals 15.8%. Find the probability that in a national survey of 2500 workers, at most 450 will be<br />
union members.<br />
x ~ > B( 2500,0.158)<br />
σ ≈ 18.24<br />
σ =1<br />
n = 450 ; p = 0.158<br />
np = 395 > 5 and nq<br />
= 55 > 5<br />
Therefore we use the normal<br />
for p ≤ 450 = <br />
( x )<br />
µ = 395<br />
x − µ<br />
z =<br />
σ<br />
x = 450.5<br />
µ = 0 z 450.5−395<br />
460.5 = ≈3.04<br />
18.24<br />
µ = np = 395<br />
σ = npq ≈18.24<br />
⇒ 50% + 49.88% = 99.88%<br />
The lifetimes of batteries produced by a firm are normally distributed with a mean of 110 hours and a<br />
2.<br />
standard deviation of 8 hours. What’s the probability that<br />
6 points a) a battery will last less than 106 hours<br />
µ = 110<br />
σ = 8<br />
σ = 8<br />
x − µ<br />
z =<br />
σ<br />
σ = 1<br />
x = 106<br />
µ = 110<br />
µ = 0<br />
z 106 110<br />
106 = − =−0.5<br />
8<br />
⇒50% − 19.15% = 30.85%<br />
b) a battery will last between 106 hours and 112 hours<br />
µ = 110<br />
σ = 8<br />
σ = 8<br />
x − µ<br />
z =<br />
σ<br />
σ = 1<br />
µ =110<br />
x 1 = 106 x 2 = 112<br />
z 106 110<br />
106 = − =−0.5<br />
8<br />
µ = 0<br />
z 112 110<br />
112 = − = 0.25<br />
8<br />
⇒ 19.15% + 9.87 % = 29.<br />
02%
c) The average of a sample of 36 batteries will last between 106 hours and 112 hours<br />
µ x = 110<br />
µ = 110<br />
8<br />
⇒<br />
σ<br />
8<br />
x = ≈1.33<br />
36<br />
σ = 8 σ x = ≈1.33<br />
x<br />
36<br />
− µ x<br />
z =<br />
σ x<br />
σ = 1<br />
x 1 = 106<br />
µ x = 110 x 2 = 112<br />
µ = 0<br />
z 106 110<br />
106 = − =−3.01<br />
1.33<br />
z 112 110<br />
112 = − = 1.50<br />
1.33<br />
⇒ 49.87% + 43. 32% = 93.19%<br />
3.<br />
2 points<br />
A random sample of 81 components is selected to determine the life expectancy of a certain type of<br />
electronic part. The sample mean life expectancy was 495 hours with a standard deviation of 64 hours. At<br />
the 95% level of confidence, estimate the true life expectancy of the components.<br />
n = 81 x −Z σ ˆ ≤ µ ≤ x + Z σˆ<br />
α<br />
2 x<br />
α<br />
2<br />
x = 495<br />
s s<br />
x −Z<br />
≤ µ ≤ x + Z<br />
=<br />
α<br />
α<br />
s 64<br />
2<br />
n<br />
2<br />
n<br />
64 64<br />
495 −1.96⋅ ≤ µ ≤ 495 + 1.96⋅<br />
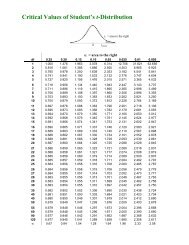
95% C.I. ⇒ Zα<br />
= 1.96 81 81<br />
2<br />
495 −13.94 ≤ µ ≤ 495 + 13.94<br />
481.06 ≤ µ ≤508.94<br />
x<br />
4.<br />
2 points<br />
The Automated Automaton Assembly Plant has had a large number of employees quit their jobs soon<br />
after they start employment. The personnel manager, Mr. Rowe Botts, would like to estimate the average<br />
stay with the company of each employee who quits. A random sample of 15 former employees’ records<br />
indicated that the average stay with the company was 54 days with a standard deviation of 16 days. If the<br />
average stay is approximately normal, construct a 99% confidence interval of the true population mean µ.<br />
n = 15 x −t σˆ<br />
≤ µ ≤ x + t σˆ<br />
α<br />
2 x<br />
α<br />
2<br />
x = 54<br />
s s<br />
x −t<br />
≤ µ ≤ x + t<br />
=<br />
α<br />
α<br />
s 16<br />
2<br />
n<br />
2<br />
n<br />
16 16<br />
54 −2.977⋅ ≤ µ ≤ 54 + 2.977⋅<br />
99% C.I. ⇒ tα<br />
= 2.977 15 15<br />
2<br />
54 −12.30≤ µ ≤ 54+<br />
12.30<br />
41.70 ≤ µ ≤ 66.30<br />
x<br />
5.<br />
2 points<br />
The Badd-Bolt Manufacturing Company selected a random sample of 300 bolts from production to<br />
estimate the percentage π of defectives. There were 30 defective bolts in the sample. What is the 90%<br />
confidence interval estimate of the percentage π of defective bolts for the whole production<br />
n = 300 p−Z σˆ<br />
≤π ≤ p+<br />
Z σˆ<br />
α<br />
2<br />
α p<br />
α<br />
2 2<br />
x = 30<br />
10⋅<br />
90 10⋅<br />
90<br />
30<br />
10% −1.645⋅ ≤π<br />
≤ 10% + 1.645⋅<br />
p = = 10%<br />
300<br />
300 300<br />
10% −2.85% ≤π<br />
≤ 10% + 2.85%<br />
90% C.I. ⇒ Z = 1.645 7.15% ≤ π ≤12. 8% 5<br />
p
6.<br />
2 points<br />
The Badd-Bolt Manufacturing Company selected a second random sample of 61 bolts in order to<br />
determine if a new process would improve the tolerance specification for the variation of bolt size. The<br />
current process has a standard deviation σ = 0.09 mm. If the 61 bolts produced with the new process had a<br />
variance of 0.0064 mm, construct a 90% confidence interval for the true production standard deviation σ<br />
of the new process (assuming the population is normally distributed). Is the new process better Explain.<br />
5%<br />
2<br />
χ L = 43.188<br />
2<br />
χ R = 79.082<br />
5%<br />
n = 61 2 2<br />
( n−1) s 2 ( n−1)<br />
s<br />
σ<br />
2 new<br />
current = 0.09<br />
≤σ<br />
≤<br />
2<br />
χR<br />
χL<br />
2<br />
Snew<br />
= 0.0064 60⋅0.0064 2 60⋅0.0064<br />
≤σ<br />
n ew ≤<br />
S = 0.08 79.082 43.188<br />
new<br />
90% C.I.<br />
new<br />
2<br />
new<br />
0.004855719 ≤σ<br />
≤0.008891358<br />
0.004855719 ≤σ<br />
≤ 0.008891358<br />
new<br />
0.0697 ≤σ<br />
≤0.<br />
0943<br />
Therefore we cannot guarantee that the new process is better since the confidence interval<br />
includes the current standard deviation.<br />
7.<br />
You are asked to conduct a study to determine the percentage of defective hammers produced by your<br />
plant. The study must be conducted so that there’s 95% probability that the results are within 3%.<br />
a)<br />
E = 3% 2<br />
Zα<br />
p 100 − p<br />
2<br />
95% C.I. ⇒ Z 1.96 n<br />
α =<br />
=<br />
2<br />
2<br />
E<br />
2<br />
=<br />
p( 100 − p)<br />
2<br />
E = Z<br />
3<br />
α<br />
2 n<br />
= 1067.11<br />
2<br />
Zα<br />
p( 100<br />
− p)<br />
2<br />
⇒ n =<br />
2<br />
E<br />
Sample Size = 1068<br />
( )<br />
( 1.96) 50( 50)<br />
b)<br />
E = 3% 2<br />
Zα<br />
p 100 − p<br />
2<br />
95% C.I. ⇒ Z 1.96 n<br />
α =<br />
=<br />
2<br />
2<br />
E<br />
2<br />
=<br />
p( 100 − p)<br />
2<br />
E = Z<br />
3<br />
α<br />
2 n<br />
= 349.5856<br />
2<br />
Zα<br />
p( 100<br />
− p)<br />
2<br />
⇒ n =<br />
2<br />
E<br />
Sample Size = 30 5<br />
( )<br />
( 1.96) 9( 91)<br />
%HVW RI /XFN <br />
6WHYH