TO STUDY THE FINANCIAL PERFORMANCE OF ... - Euroasiapub.org
TO STUDY THE FINANCIAL PERFORMANCE OF ... - Euroasiapub.org
TO STUDY THE FINANCIAL PERFORMANCE OF ... - Euroasiapub.org

You also want an ePaper? Increase the reach of your titles
YUMPU automatically turns print PDFs into web optimized ePapers that Google loves.
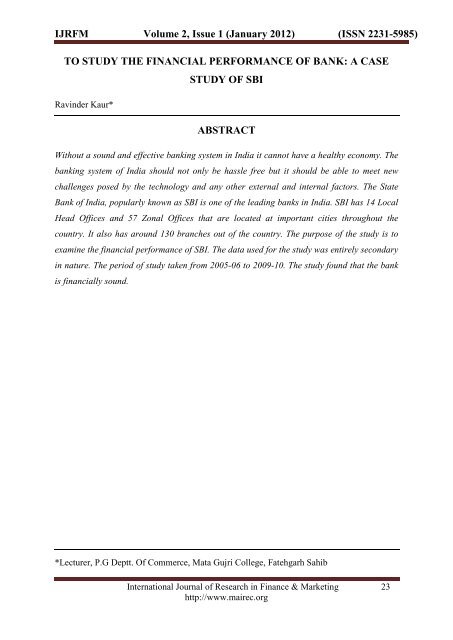
IJRFM Volume 2, Issue 1 (January 2012) (ISSN 2231-5985)<br />
<strong>TO</strong> <strong>STUDY</strong> <strong>THE</strong> <strong>FINANCIAL</strong> <strong>PERFORMANCE</strong> <strong>OF</strong> BANK: A CASE<br />
<strong>STUDY</strong> <strong>OF</strong> SBI<br />
Ravinder Kaur*<br />
ABSTRACT<br />
Without a sound and effective banking system in India it cannot have a healthy economy. The<br />
banking system of India should not only be hassle free but it should be able to meet new<br />
challenges posed by the technology and any other external and internal factors. The State<br />
Bank of India, popularly known as SBI is one of the leading banks in India. SBI has 14 Local<br />
Head Offices and 57 Zonal Offices that are located at important cities throughout the<br />
country. It also has around 130 branches out of the country. The purpose of the study is to<br />
examine the financial performance of SBI. The data used for the study was entirely secondary<br />
in nature. The period of study taken from 2005-06 to 2009-10. The study found that the bank<br />
is financially sound.<br />
*Lecturer, P.G Deptt. Of Commerce, Mata Gujri College, Fatehgarh Sahib<br />
International Journal of Research in Finance & Marketing 23<br />
http://www.mairec.<strong>org</strong>
IJRFM Volume 2, Issue 1 (January 2012) (ISSN 2231-5985)<br />
INTRODUCTION<br />
A bank is a financial institution that serves as a financial intermediary. Without a sound and<br />
effective banking system in India it cannot have a healthy economy. The banking system of<br />
India should not only be hassle free but it should be able to meet new challenges posed by the<br />
technology and any other external and internal factors. The State Bank of India, popularly<br />
known as SBI is one of the leading banks in India. The State Bank Group, with over 16,000<br />
branches provides a wide range of banking products through its vast network of branches in<br />
India and overseas, including products aimed at Non-Resident Indians (NRIs). The<br />
headquarter of SBI is at Mumbai. SBI has 14 Local Head Offices and 57 Zonal Offices that<br />
are located at important cities throughout the country. It also has around 130 branches out of<br />
the country. It has 5 subsidiary banks named as State Bank of Bikaner & Jaipur, State Bank<br />
of Hyderabad, State Bank of Mysore, State Bank of Patiala, and State Bank of Travancore.<br />
With an asset base of $352 billion and $285 billion in deposits, SBI is one of the largest<br />
financial institution in the world. It has a market share among Indian commercial banks of<br />
about 20% in deposits and loans. According to Forbes. State Bank of India is the 29th most<br />
reputed company in the world.<br />
History<br />
The roots of the State Bank of India rest in the first decade of 19th century, when the Bank of<br />
Calcutta later on renamed the Bank of Bengal, was established on 2 June 1806. The Bank of<br />
Bengal was one of three Presidency banks, the other two being the Bank of Bombay<br />
(incorporated on 15 April 1840) and the Bank of Madras (incorporated on 1 July 1843).<br />
With the result of the royal charters all three Presidency banks were incorporated as joint<br />
stock companies and received the exclusive right to issue paper currency in 1861 with the<br />
Paper Currency Act. They retained this right till the formation of the Reserve Bank of India.<br />
The Presidency banks amalgamated on 27 January 1921, and renamed Imperial Bank of<br />
India. The Imperial Bank of India remained a joint stock company<br />
The government of India nationalized the Imperial Bank of India in 1955, with the Reserve<br />
Bank of India taking a 60% stake, and renamed it the State Bank of India. This<br />
transformation from the Imperial Bank of India to the State Bank of India was given legal<br />
recognition in terms of an Act of the Parliament of India, which came into force from 1 July<br />
1955. In 1959, the government passed the State Bank of India (Subsidiary Banks) Act,<br />
International Journal of Research in Finance & Marketing 24<br />
http://www.mairec.<strong>org</strong>
IJRFM Volume 2, Issue 1 (January 2012) (ISSN 2231-5985)<br />
enabling the State Bank of India to take over eight former state-associated banks as its<br />
subsidiaries. On 13 September 2008, the State Bank of Saurashtra, one of its Subsidiary<br />
banks, merged with the State Bank of India. In 2008, the government took over the stake held<br />
by the Reserve Bank of India. Then on June 19, 2009 the SBI board approved the merger of<br />
its subsidiary, State Bank of Indore, with itself. SBI holds 98.3% in State Bank of Indore. But<br />
the process of merging of State Bank of Indore was completed by April 2010, and the SBI<br />
Indore Branches started functioning as SBI branches on 26 August 2010.<br />
NATIONALIZATION <strong>OF</strong> BANKS:<br />
The nationalization of banks in India took place in 1969 by Mrs. Indira Gandhi the then<br />
prime minister. It nationalized 14 banks then. These banks were mostly owned by<br />
businessmen and even managed by them. Before the steps of nationalization of Indian banks,<br />
only State Bank of India (SBI) was nationalized. It took place in July 1955 under the SBI Act<br />
of 1955. Nationalization of Seven State Banks of India (formed subsidiary) took place on<br />
19th July, 1960.<br />
RESEARCH METHODOLOGY<br />
Research is an art of scientific investigation. In other word research is a scientific and<br />
systematic search for pertinent information on a specific topic. The logic behind taking<br />
research methodology into consideration is that one can have knowledge about the method<br />
and procedure adopted for achievement of objectives of the project. With the adoption of this<br />
others can evaluate the results also. Its main aim is to keep the researchers on the right track.<br />
The methodology adopted for studying the objectives was to know the performance of<br />
STATE BANK <strong>OF</strong> INDIA. So keeping in view the nature of requirements of the study to<br />
collect all the relevant information regarding the performance of the bank. Secondary data<br />
has been collected and the guide in the <strong>org</strong>anization was consulted at many times.<br />
OBJECTIVE <strong>OF</strong> <strong>STUDY</strong>:<br />
The following are main objectives of study:<br />
To study the profitability of State Bank of India.<br />
International Journal of Research in Finance & Marketing 25<br />
http://www.mairec.<strong>org</strong>
IJRFM Volume 2, Issue 1 (January 2012) (ISSN 2231-5985)<br />
To examine the financial performance of SBI.<br />
SCOPE <strong>OF</strong> <strong>STUDY</strong>:<br />
The present study has been undertaken to measure and evaluate the performance SBI. The<br />
study covers the period of 5 years that is from year 2005-06 to year 2009-2010.<br />
DATA COLLECTION:<br />
For the purpose of study secondary data has been collected. The secondary data has been<br />
collected from year 2005-06 to 2009-10. Secondary data is the data which is available in<br />
readymade form and which is already used by people for some purposes. There may be<br />
various sources of secondary data such as-newspapers, magazines, journals, books, reports,<br />
documents and other published information.<br />
LIMITATION <strong>OF</strong> <strong>THE</strong> <strong>STUDY</strong>:<br />
Due to constraints of time and resources, the study is likely to suffer from certain limitations.<br />
Some of these are mentioned here under so that the findings of the study may be understood<br />
in a proper perspective.<br />
The limitations of the study are:<br />
‣ The study is based on the secondary data and the limitation of using secondary data<br />
may affect the results.<br />
‣ The secondary data was taken from the annual reports of the SBI. It may be possible<br />
that the data shown in the annual reports may be window dressed which does not<br />
show the actual position of the bank.<br />
Financial analysis is mainly done in order to judge the growth, profitability and financial<br />
soundness of the bank but diagnosing the information contained in the financial statements.<br />
Financial analysis is done to identify the financial strengths and weaknesses of banks by<br />
properly establishing relationship between the items of profit and loss account. It helps in<br />
better understanding of bank’s financial position and growth and performance by analyzing<br />
the financial statements with various tools and evaluating the relationship between various<br />
elements of financial statements.<br />
The term “financial statement analysis” includes both “analysis” and “interpretation”. The<br />
term “analysis” is used to mean the generalization of data given in the financial statements by<br />
International Journal of Research in Finance & Marketing 26<br />
http://www.mairec.<strong>org</strong>
IJRFM Volume 2, Issue 1 (January 2012) (ISSN 2231-5985)<br />
systematic arrangements and classification of data and “interpretation” means explaining the<br />
meaning and significance of the data so simplified. However both analysis and interpretation<br />
are interlinked and complimentary to each other.<br />
For this purpose the following parameters have been studied.<br />
1. Credit Deposit Ratio<br />
2. Staff Expenses to Total Expenses<br />
3. Staff Expenses to Total Operating Expenses<br />
4. Interest Expenses to Total Expenses<br />
5. Overhead Expenses to Total Expenses<br />
6. Interest Income to Total Income<br />
7. Other Income to Total Income<br />
8. Percentage Change in Deposits<br />
9. Percentage Change in Advances<br />
10. Percentage Change in Operating Profits<br />
Credit-Deposit Ratio is the proportion of loan-assets created by a bank from the deposits<br />
received. Credits are the loans and advances granted by the bank. In other words it is the<br />
amount lent by the bank to a person or an <strong>org</strong>anization which is recovered of later on. Interest<br />
is charges from the borrower. Deposit is the amount accepted by bank from the savers and<br />
interest is paid to them.<br />
Table 1.1<br />
Credit Deposit Ratio<br />
(Rs. in billions)<br />
Year Advances\Credit Deposits Ratio of Credit Deposit<br />
2005-06 2023.74 3670.48 55.13<br />
2006-07 2618.01 3800.46 68.88<br />
2007-08 3373.36 4355.21 77.45<br />
2008-09 4168.95 5324.05 77.57<br />
2009-10 5425.03 7420.73 73.10<br />
MEAN 70.42<br />
CGR 5.80<br />
Source: Calculated from the Annual Reports of SBI<br />
International Journal of Research in Finance & Marketing 27<br />
http://www.mairec.<strong>org</strong>
IJRFM Volume 2, Issue 1 (January 2012) (ISSN 2231-5985)<br />
Fig. No. 1.1<br />
Credit Deposit Ratio<br />
Percentage<br />
90<br />
80<br />
70<br />
60<br />
50<br />
40<br />
30<br />
20<br />
10<br />
0<br />
77.45 77.57<br />
68.88<br />
73.1<br />
55.13<br />
2005-06 2006-07 2007-08 2008-09 2009-10<br />
Year<br />
Table 1.2 depicts that over the course of 5 periods of study the mean of Credit Deposit Ratio<br />
was 70.42 per cent and Compound Growth Rate was 5.80 per cent. In the year 2005-06<br />
Credit Deposit Ratio was 55.13 per cent and it increased to 77.57 per cent in the year 2008-09<br />
but in 2009-10 it decreased to 73.10 per cent.<br />
Staff Expenses to Total Expenses represent the expenses incurred on staff in<br />
proportion to the total expenses. Staff expenses is the amount spent by the bank on its<br />
employees in form of salaries, commission, bonus, perks, fringe benefits etc. Total expenses<br />
include the amount spent in the form of staff expenses, interest expenses, overhead expenses<br />
and other operating expenses etc.<br />
Table 1.2<br />
Staff Expenses to Total Expenses<br />
billions)<br />
(Rs. in<br />
Year Staff Expenses Total Expenses Ratio of Staff Expenses to Total<br />
Expenses<br />
2005-06 69.07 285.57 24.18<br />
2006-07 81.23 321.15 25.29<br />
2007-08 79.33 352.61 24.49<br />
2008-09 77.86 445.38 17.48<br />
International Journal of Research in Finance & Marketing 28<br />
http://www.mairec.<strong>org</strong>
IJRFM Volume 2, Issue 1 (January 2012) (ISSN 2231-5985)<br />
2009-10 97.47 585.64 16.64<br />
MEAN 21.61<br />
CGR -7.20<br />
Source: Calculated from the Annual Reports of SBI<br />
Fig. No. 1.2<br />
Staff Expenses to Total Expenses<br />
Ratio of Staff Expenses to Total Expenses<br />
Percentage<br />
30<br />
25<br />
20<br />
15<br />
10<br />
5<br />
0<br />
24.18 25.29 24.49<br />
17.48 16.64<br />
2005-06 2006-07 2007-08 2008-09 2009-10<br />
Year<br />
Table 1.2 represents that the mean of Staff Expenses to Total Expenses was 21.61 per cent<br />
and Compound Growth Rate was negative i.e. 7.20 per cent. In the year 2005-06 ratio of<br />
Staff Expenses to Total Expenses was 24.18 per cent and in 2006 -07 it was increased to<br />
25.29 per cent. After that it showed a decreasing trend over the period of study and arrived at<br />
16.64 per cent in the year 2009-10.<br />
Staff Expenses to Total Operating Expenses shows the expenses incurred on staff<br />
in proportion to the total operating expenses. Staff expenses is the amount spent by the bank<br />
on its employees in form of salaries, commission, bonus, perks, fringe benefits etc. Total<br />
Operating expenses are those expenses which are incurred to carry out day to day activities in<br />
the <strong>org</strong>anization such as payroll, sales commission, rent, repairs, depreciation, taxes etc.<br />
These are not directly associated with manufacturing.<br />
International Journal of Research in Finance & Marketing 29<br />
http://www.mairec.<strong>org</strong>
IJRFM Volume 2, Issue 1 (January 2012) (ISSN 2231-5985)<br />
Table 1.3<br />
billions)<br />
Staff Expenses to Total Operating Expenses<br />
(Rs. in<br />
Year Staff Expenses Total operating<br />
Expenses<br />
Ratio of Staff Expenses to Total<br />
operating Expenses<br />
2005-06 69.07 100.74 68.56<br />
2006-07 81.23 117.25 69.27<br />
2007-08 79.33 118.24 67.09<br />
2008-09 77.86 126.09 61.74<br />
2009-10 97.47 156.49 62.28<br />
MEAN 65.78<br />
CGR -1.90<br />
Source: Calculated from the Annual Reports of SBI<br />
Fig. No. 1.3<br />
Staff Expences to Total Operating<br />
Expenses<br />
Percentage<br />
70<br />
68<br />
66<br />
64<br />
62<br />
60<br />
58<br />
56<br />
68.56<br />
69.27<br />
67.09<br />
61.74 62.28<br />
2005-06 2006-07 2007-08 2008-09 2009-10<br />
Year<br />
Table 1.3 presents that the mean of Staff Expenses to Total Operating Expenses was 65.78<br />
per cent and Compound Growth Rate was negative i.e. 1.90 per cent. In the year 2005-06<br />
ratio of Staff Expenses to Total Operating Expenses was 68.56 per cent and it increased to<br />
69.27 per cent in the year 2006-07 but in 2007-08 and 2008-09 it decreased to 67.09 per cent<br />
and 61.74 per cent respectively. In the year 2009-10 it increased to 62.28 per cent.<br />
International Journal of Research in Finance & Marketing 30<br />
http://www.mairec.<strong>org</strong>
IJRFM Volume 2, Issue 1 (January 2012) (ISSN 2231-5985)<br />
Interest Expenses to Total Expenses reveals the expenses incurred on interest in<br />
proportion to total expenses. Banks take deposits from savers and pay interest on these<br />
accounts. This payment of interest is known as interest expenses. Total expenses include the<br />
amount spent in the form of staff expenses, interest expenses, overhead expenses and other<br />
operating expenses etc.<br />
Table 1.4<br />
Interest Expenses to Total Expenses<br />
(Rs. in billions)<br />
Year Interest Expenses Total Expenses Ratio of Interest Expenses to Total<br />
Expenses<br />
2005-06 184.83 285.57 64.72<br />
2006-07 203.90 321.15 63.49<br />
2007-08 234.37 352.61 66.46<br />
2008-09 319.29 445.38 71.68<br />
2009-10 429.15 585.64 73.27<br />
MEAN 67.92<br />
CGR 2.51<br />
Source: Calculated from the Annual Reports of SBI<br />
Fig. No. 1.4<br />
Interest Expenses to Total Expenses<br />
Percentage<br />
76<br />
74<br />
72<br />
70<br />
68<br />
66<br />
64<br />
62<br />
60<br />
58<br />
73.27<br />
71.68<br />
66.46<br />
64.72<br />
63.49<br />
2005-06 2006-07 2007-08 2008-09 2009-10<br />
Year<br />
International Journal of Research in Finance & Marketing 31<br />
http://www.mairec.<strong>org</strong>
IJRFM Volume 2, Issue 1 (January 2012) (ISSN 2231-5985)<br />
Table 1.4 reveals that over the course of 5 periods of study the mean of Interest Expenses to<br />
Total Expenses was 64.72 per cent and Compound Growth Rate was 2.51 per cent. In the<br />
year 2005-06 Ratio of Interest Expenses to Total Expenses was 64.72 per cent. It decreased to<br />
63.49 in 2006-07. After that it showed an increasing trend over the period of study and<br />
arrived at 73.27 per cent in the year 2009-10<br />
Overhead Expenses to Total Expenses represent the proportion of overhead<br />
expenses to total expenses. Overhead expenses are those costs which are not easily traceable<br />
to a specific job or process. These include rent or mortgage payments, utilities, insurance on<br />
plant and equipment, phone, costs of meeting government regulations, and other<br />
administrative salaries and expenses. Total expenses include the amount spent in the form of<br />
staff expenses, interest expenses, overhead expenses and other operating expenses etc.<br />
Table 1.5<br />
billions)<br />
Overhead Expenses to Total Expenses<br />
(Rs. in<br />
Year Overhead Expenses Total Expenses Ratio of Overhead Expenses to<br />
Total Expenses<br />
2005-06 31.67 285.57 11.09<br />
2006-07 36.02 321.15 11.21<br />
2007-08 38.91 352.61 11.03<br />
2008-09 48.23 445.38 10.82<br />
2009-10 59.01 585.64 10.07<br />
MEAN 10.86<br />
CGR -2.09<br />
Source: Calculated from the Annual Reports of SBI<br />
Fig. No. 1.5<br />
International Journal of Research in Finance & Marketing 32<br />
http://www.mairec.<strong>org</strong>
IJRFM Volume 2, Issue 1 (January 2012) (ISSN 2231-5985)<br />
Overhead Expenses to Total<br />
Expenses<br />
Ratio of Interest Expenses to Overhead Expenses<br />
Percentasge<br />
11.5<br />
11<br />
10.5<br />
10<br />
11.09<br />
11.21<br />
11.03<br />
10.82<br />
10.07<br />
9.5<br />
2005-06 2006-07 2007-08 2008-09 2009-10<br />
Year<br />
Table 1.5 discloses that the mean of Overhead Expenses to Total Expenses was 10.86 per<br />
cent and Compound Growth Rate was negative i.e. 2.09 per cent. In the year 2005-06 ratio of<br />
Overhead Expenses to Total Expenses was 11.09 per cent and it increased to 11.21 per cent in<br />
2006-07. After that it showed a decreasing trend and reached to 10.07 per cent in the year<br />
2009-10.<br />
Interest Income to Total Income shows the proportionate contribution of interest<br />
income in total income. Banks lend money in the form of loans and advances to the<br />
borrowers and receive interest on it. This receipt of interest is called interest income. Total<br />
income includes interest income, non-interest income and operating income.<br />
Table 1.6<br />
Interest Income to Total Income<br />
(Rs. in billions)<br />
Year Interest Income Total Income Ratio of Interest Income to Total<br />
Income<br />
2005-06 324.28 395.48 81.99<br />
2006-07 359.80 434.15 82.87<br />
2007-08 394.91 452.60 87.25<br />
2008-09 489.50 576.45 84.91<br />
2009-10 637.88 764.79 83.40<br />
MEAN 84.08<br />
CGR 0.34<br />
Source: Calculated from the Annual Reports of SBI<br />
International Journal of Research in Finance & Marketing 33<br />
http://www.mairec.<strong>org</strong>
IJRFM Volume 2, Issue 1 (January 2012) (ISSN 2231-5985)<br />
Fig. No. 1.6<br />
Interest Income to Total Income<br />
Percentage<br />
88<br />
86<br />
84<br />
82<br />
80<br />
78<br />
Ratio of Interest Income to Total Income<br />
87.25<br />
84.91<br />
81.99<br />
82.87<br />
83.4<br />
2005-06 2006-07 2007-08 2008-09 2009-10<br />
Year<br />
Table 1.6 depicts that over the course of 5 periods of study the mean of Interest Income to<br />
Total Income was 84.08 per cent and Compound Growth Rate was 0.34 per cent. In the year<br />
2005-06 Ratio of Interest Income to Total Income was 81.99 per cent and it showed an<br />
increasing trend for next two years and reached to 87.25 per cent in 2007-08 but after that it<br />
was decreased continuously and reached to 83.40 per cent in the year 2009-10.<br />
Other income to total income reveals the proportionate share of other income in total<br />
income. Other income includes non-interest income and operating income. Total income<br />
includes interest income, non-interest income and operating income.<br />
Table 1.7<br />
Other Income to Total Income<br />
(Rs. in billions)<br />
Year Other Income Total Income Ratio of Other Income to Total<br />
Income<br />
2005-06 71.20 395.48 18.00<br />
2006-07 74.35 434.15 17.12<br />
2007-08 57.69 452.60 12.74<br />
2008-09 86.95 576.45 15.08<br />
2009-10 126.91 764.79 16.59<br />
MEAN 15.90<br />
CGR -1.62<br />
Source: Calculated from the Annual Reports of SBI<br />
International Journal of Research in Finance & Marketing 34<br />
http://www.mairec.<strong>org</strong>
IJRFM Volume 2, Issue 1 (January 2012) (ISSN 2231-5985)<br />
Fig. No. 1.7<br />
Other Income to Total Income<br />
Ratio of Other Income to Total Income<br />
Percentage<br />
20<br />
15<br />
10<br />
5<br />
18<br />
17.12<br />
12.74<br />
15.08<br />
16.59<br />
0<br />
2005-06 2006-07 2007-08 2008-09 2009-10<br />
Year<br />
Table 1.7 shows that the mean of Other Income to Total Income was 15.90 per cent and<br />
Compound Growth Rate was negative i.e. 1.62 per cent. In the year 2005-06 Ratio of Other<br />
Income to Total Income was 18 per cent but after that it decreased for next two years and<br />
reached to 12.74 per cent in 2007-08 and then it showed an increasing trend and reached to<br />
16.59 per cent in the year 2009-10<br />
Deposits: Deposit is the amount accepted by bank from the savers in the form of current<br />
deposits, savings deposits and fixed deposits and interest is paid to them.<br />
Table 1.8<br />
Percentage Change in Deposits<br />
(Rs. in billions)<br />
Year Deposits % Change In Deposits<br />
2005-06 3670.48 ------<br />
2006-07 3800.46 3.54<br />
2007-08 4355.21 14.59<br />
2008-09 5374.05 23.39<br />
2009-10 7420.73 38.08<br />
MEAN 4924.18<br />
CGR 15.12<br />
Source: Calculated from the Annual Reports of SBI<br />
International Journal of Research in Finance & Marketing 35<br />
http://www.mairec.<strong>org</strong>
IJRFM Volume 2, Issue 1 (January 2012) (ISSN 2231-5985)<br />
Fig. No. 1.8<br />
Change In Deposits<br />
Percentage<br />
40<br />
35<br />
30<br />
25<br />
20<br />
15<br />
10<br />
5<br />
0<br />
% Change In Deposits<br />
23.39<br />
14.59<br />
0<br />
3.54<br />
2006-07 2007-08 2008-09 2009-10<br />
38.08<br />
Year<br />
Table 1.8 presents that the mean of Deposits was 4924.18 per cent and Compound Growth<br />
Rate was 15.12 per cent. Table also shows the per cent Change in Deposits over the period of<br />
5 years. In the year 2006-07 Deposits were increased by 3.54 per cent and after that it showed<br />
the increasing trend over the whole period of study. In the year 2009-10 deposits were<br />
increased by 38.08 per cent<br />
Advances: Advances is the credit facility granted by the bank. In other words it is the<br />
amount borrowed by a person from the Bank. It is also known as ‘Credit’ granted where the<br />
money is disbursed and recovery of which is made later on.<br />
Table 1.9<br />
Percentage Change in Advances (Rs. in billions)<br />
Year Advances % Change In Advances<br />
2005-06 2023.74 ------<br />
2006-07 2618.01 29.36<br />
2007-08 3373.36 28.85<br />
2008-09 4168.95 23.58<br />
2009-10 5425.03 30.12<br />
MEAN 3521.81<br />
CGR 21.79<br />
Source: Calculated from the Annual Reports of SBI<br />
International Journal of Research in Finance & Marketing 36<br />
http://www.mairec.<strong>org</strong>
IJRFM Volume 2, Issue 1 (January 2012) (ISSN 2231-5985)<br />
Fig. No. 1.9<br />
Change In Advances<br />
% Change In Advances<br />
Percentage<br />
35<br />
30<br />
25<br />
20<br />
15<br />
10<br />
5<br />
0<br />
0<br />
29.36 28.85<br />
23.58<br />
30.12<br />
2006-07 2007-08 2008-09 2009-10<br />
Year<br />
Table 1.9 reveals that the mean of Advances was 3521.81 per cent and Compound Growth<br />
Rate was 21.79 per cent. Table also shows the per cent Change in Advances over the whole<br />
period of study. In the year 2006-07 Advances were increased by 29.36 per cent and in 2007-<br />
08 these were increased (again) by 28.85 per cent but in the year 2008-09 deposits were<br />
decreased by 23.58 per cent and after that these were increased by 30.12 per cent in 2009-10<br />
Operating profits are also known as "earnings before interest and tax" (EBIT). These are<br />
the profits earned from the normal course of business operations. It does not include any<br />
profit earned from the firm's investments and the effects of interest and taxes.<br />
Table 1.10<br />
Percentage Change in Operating Profits (Rs. in billions)<br />
Year Operating Profits % Change In Operating<br />
Profits<br />
2005-06 109.91 ------<br />
2006-07 112.99 2.80<br />
2007-08 100.00 11.49<br />
2008-09 131.07 31.07<br />
2009-10 179.15 36.68<br />
MEAN 126.24<br />
CGR 10.36<br />
Source: Calculated from the Annual Reports of SBI<br />
International Journal of Research in Finance & Marketing 37<br />
http://www.mairec.<strong>org</strong>
IJRFM Volume 2, Issue 1 (January 2012) (ISSN 2231-5985)<br />
Fig. No. 1.10<br />
Change In Operating Profits<br />
% Change In Operating Profits<br />
Percentage<br />
40<br />
35<br />
30<br />
25<br />
20<br />
15<br />
10<br />
5<br />
0<br />
0<br />
2.8<br />
11.49<br />
31.07<br />
36.68<br />
2006-07 2007-08 2008-09 2009-10<br />
Year<br />
Table 1.9 discloses that the mean of Operating Profits was 126.24 per cent and Compound<br />
Growth Rate was 10.36 per cent. This table also discloses the per cent Change in Operating<br />
Profits over the course of 5 periods. In the year 2006-07 Operating Profits were increased by<br />
2.80 per cent and in 2007-08 these were decreased by 11.49 per cent but after that it showed<br />
an increasing trend and increased by 36.68 per cent in the year 2009-10.<br />
Findings<br />
The major findings of the study are:<br />
The study found that the CGR of Credit Deposit Ratio was 5.80 per cent and CGR of Staff<br />
Expenses to Total Expenses was negative in the year 2006-07 and mean of Staff Expenses to<br />
Total Expenses was 21.61 per cent. In the year 2006-07 Ratio of Interest Expenses to Total<br />
Expenses was decreased from 64.72 to 63.49 per cent. Afterwards it showed an increasing<br />
trend over the period of study The CGR of Overhead Expenses to Total Expenses was<br />
negative. The CGR and mean of Interest Income to Total Income was 0.34 per cent and 84.08<br />
per cent respectively. The average mean of Other Income to Total Income was 15.90 per cent.<br />
The study revealed that the deposits of the bank were increasing at increasing rate and<br />
advances were increasing at decreasing rate up to the year 2008-09 and same was increased<br />
in the year 2009-10.The operating profits of the bank were decreased by 11.49 per cent and<br />
increased afterwards.<br />
International Journal of Research in Finance & Marketing 38<br />
http://www.mairec.<strong>org</strong>
IJRFM Volume 2, Issue 1 (January 2012) (ISSN 2231-5985)<br />
CONCLUSION<br />
The study concludes that the SBI is one of the leading banks in India. The interest expense is<br />
more as compared to operating expense in SBI. Out of total income the major share of<br />
income is expanded on interest paid. The operating efficiency of SBI is better .So there is a<br />
need to control the operating expenses to increase the operational efficiency.<br />
BIBLIOGRAPHY<br />
Reports<br />
1. Annual reports of State Bank of India from year 2005-06 to 2009-10<br />
WEBSITES<br />
1. http://www.statebankofindia.com/<br />
2. www.sbibank.com<br />
International Journal of Research in Finance & Marketing 39<br />
http://www.mairec.<strong>org</strong>