9. Pension scheme Defined contribution plans The Group ... - Savills
9. Pension scheme Defined contribution plans The Group ... - Savills
9. Pension scheme Defined contribution plans The Group ... - Savills

You also want an ePaper? Increase the reach of your titles
YUMPU automatically turns print PDFs into web optimized ePapers that Google loves.
<strong>Savills</strong> plc Report and Accounts 2011 63<br />
Our business<br />
Our governance<br />
Our results<br />
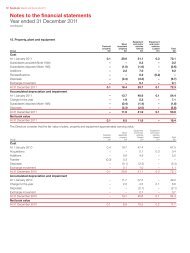
<strong>9.</strong> <strong>Pension</strong> <strong>scheme</strong><br />
<strong>Defined</strong> <strong>contribution</strong> <strong>plans</strong><br />
<strong>The</strong> <strong>Group</strong> operates the <strong>Savills</strong> UK <strong>Group</strong> Personal <strong>Pension</strong> Plan, a defined <strong>contribution</strong> <strong>scheme</strong>, a number of defined <strong>contribution</strong><br />
individual pension <strong>plans</strong> and a Mandatory Provident Fund Scheme in Hong Kong, to which it contributes. <strong>The</strong> total pension charges in<br />
respect of these <strong>plans</strong> were £16.5m (2010: £14.0m). <strong>The</strong> amount outstanding as at 31 December 2011 in relation to defined <strong>contribution</strong><br />
<strong>scheme</strong>s is £0.3m (2010: £0.2m).<br />
<strong>Defined</strong> benefit plan<br />
<strong>The</strong> <strong>Pension</strong> Plan of <strong>Savills</strong> (the ‘Plan’) provided final salary pension benefits to some employees, but was closed with regard to future<br />
service-based benefit accrual with effect from 31 March 2010. From 1 April 2010, pension benefits for former employees of the Plan<br />
are provided through the <strong>Group</strong>’s defined <strong>contribution</strong> Personal <strong>Pension</strong> Plan.<br />
<strong>The</strong> assets of the <strong>scheme</strong> are held separately from those of the <strong>Group</strong>, and invested in managed funds units. <strong>The</strong> <strong>contribution</strong>s are<br />
determined by an independent qualified actuary on the basis of triennial valuations.<br />
A full actuarial valuation was carried out as at 31 March 2010 and has been updated to 31 December 2011 by a qualified independent<br />
actuary. <strong>The</strong> assumptions which have the most significant effect on the results of the valuation are those relating to the rate of return on<br />
investments pre-retirement, the rates of increase in salaries and the post-retirement investment return. <strong>The</strong> valuation showed that the<br />
market value of the <strong>scheme</strong>’s assets was £10<strong>9.</strong>6m and that the actuarial value of those assets represented 80% of the benefits that had<br />
accrued to members, after allowing for expected future increases in earnings. <strong>The</strong> <strong>scheme</strong> has been closed to new joiners for pension<br />
benefits since 1 April 2000.<br />
Principal assumptions at 31 December 2011 2010<br />
Expected return on plan assets<br />
– Equities 7.80% 8.10%<br />
– Gilts 2.50% 4.00%<br />
– Bonds 4.70% 5.20%<br />
– Property 6.80% 7.10%<br />
– Diversified growth funds 7.50% 7.80%<br />
– Other 0.50% 0.50%<br />
Expected rate of salary increases 4.50% 4.50%<br />
Rate of increase to pensions in payment<br />
– accrued before 6 April 1997 3.00% 3.00%<br />
– accrued after 5 April 1997 3.10% 3.60%<br />
– accrued after 5 April 2005 2.30% 2.40%<br />
Rate of increase to pensions in deferment<br />
– accrued before 6 April 2001 5.00% 5.00%<br />
– accrued after 5 April 2001 2.80% 2.90%<br />
– accrued after 5 April 2009 2.20% 2.50%<br />
Discount rate 4.90% 5.50%<br />
Inflation assumption 3.10% 3.60%<br />
Using post-retirement mortality assumptions, the assured life expectations on retirement at age 60 (2010: 60) are as follows:<br />
<strong>Group</strong><br />
2011 2010<br />
Retiring today – Male 88.1 88.1<br />
– Female 8<strong>9.</strong>2 8<strong>9.</strong>1<br />
Retiring in 20 years – Male 8<strong>9.</strong>5 8<strong>9.</strong>5<br />
– Female 90.8 90.8<br />
Sensitivity analysis of the discount rate:<br />
Change in assumption Increase by 0.5% p.a. (2010: decrease by 0.5% p.a.)<br />
Impact on liabilities Decrease by 10.7% (2010: increase by 12%)<br />
<strong>Group</strong>
64 <strong>Savills</strong> plc Report and Accounts 2011<br />
Notes to the financial statements<br />
Year ended 31 December 2011<br />
continued<br />
<strong>9.</strong> <strong>Pension</strong> <strong>scheme</strong> continued<br />
<strong>The</strong> amounts recognised in the statement of financial position are as follows:<br />
2011<br />
£m<br />
<strong>Group</strong><br />
2010<br />
£m<br />
2011<br />
£m<br />
Company<br />
2010<br />
£m<br />
Fair value of plan assets 12<strong>9.</strong>0 11<strong>9.</strong>5 7.1 6.6<br />
Present value of funded obligations (164.6) (141.8) (<strong>9.</strong>1) (7.8)<br />
Deficit (35.6) (22.3) (2.0) (1.2)<br />
Related deferred tax asset 8.9 6.1 0.5 0.3<br />
Net liability (26.7) (16.2) (1.5) (0.9)<br />
<strong>The</strong> amounts recognised in the income statement:<br />
Current service cost – 0.9<br />
Interest cost 7.7 7.9<br />
Expected return on plan assets (8.7) (7.9)<br />
Total included in staff costs (1.0) 0.9<br />
All net actuarial gains or losses for each year are recognised in full in the year in which they are incurred in the statement of comprehensive<br />
income.<br />
Change in defined benefit obligation:<br />
Present value of defined benefit obligation at start of year 141.8 141.2<br />
Current service cost – 0.9<br />
Interest cost 7.7 7.9<br />
Plan participants <strong>contribution</strong>s – 0.3<br />
Actuarial loss/(gain) 16.1 (7.2)<br />
Benefits paid (1.0) (1.3)<br />
Present value of defined benefit obligation at end of year 164.6 141.8<br />
Change in plan assets:<br />
Fair value of plan assets at start of year 11<strong>9.</strong>5 103.5<br />
Expected return on plan assets 8.7 7.9<br />
Actuarial (loss)/gain (4.2) 3.3<br />
Employer <strong>contribution</strong>s 6.0 5.8<br />
Plan participants <strong>contribution</strong>s – 0.3<br />
Benefits paid (1.0) (1.3)<br />
Fair value of plan assets at end of year 12<strong>9.</strong>0 11<strong>9.</strong>5<br />
<strong>The</strong> actual return on plan assets was £4.5m (2010: £11.2m). <strong>The</strong> overall expected return on assets is determined as the weighted average<br />
of the expected returns on each separate asset class shown below. <strong>The</strong> expected return on plan assets is determined by the expected<br />
rate of return over the remaining life of the related liabilities held by the <strong>scheme</strong>. <strong>The</strong> expected rate of return on equities is based on market<br />
expectations of dividend yields and price earnings ratios. Expected returns on bonds are based on gross redemption yields as at the<br />
reporting date.<br />
2011<br />
£m<br />
2011<br />
£m<br />
2011<br />
£m<br />
<strong>Group</strong><br />
2010<br />
£m<br />
<strong>Group</strong><br />
2010<br />
£m<br />
<strong>Group</strong><br />
2010<br />
£m
<strong>Savills</strong> plc Report and Accounts 2011 65<br />
Our business<br />
Our governance<br />
Our results<br />
<strong>9.</strong> <strong>Pension</strong> <strong>scheme</strong> continued<br />
<strong>The</strong> amounts recognised in the consolidated statement of comprehensive income:<br />
Actuarial losses brought forward (27.1) (37.6)<br />
Net actuarial (loss)/gain for the year (20.3) 10.5<br />
Accumulated net actuarial losses (47.4) (27.1)<br />
<strong>The</strong> major categories of assets as a percentage of total plan assets are as follows:<br />
2011 2010<br />
Equities 48% 51%<br />
Gilts – 4%<br />
Bonds 31% 23%<br />
Property 2% 3%<br />
Diversified Growth Funds 18% 19%<br />
Cash 1% –<br />
Total 100% 100%<br />
No plan assets are the <strong>Group</strong>’s own financial instruments or property occupied or used by the <strong>Group</strong>.<br />
Amounts for the current and previous four years are as follows:<br />
Plan assets 12<strong>9.</strong>0 11<strong>9.</strong>5 103.5 85.9 103.4<br />
<strong>Defined</strong> benefit obligation (164.6) (141.8) (141.2) (110.5) (113.4)<br />
Deficit (35.6) (22.3) (37.7) (24.6) (10.0)<br />
Experience (loss)/gain on plan liabilities (1%) 2% 2% 1% (5%)<br />
Experience (loss)/gain on plan assets (3%) 3% 8% (35%) (4%)<br />
<strong>The</strong> <strong>Group</strong> expects to contribute £7.0m to its pension plan in the period to 31 December 2012 (2011: £6.0m). <strong>The</strong> Company expects to<br />
contribute £0.4m (2011: £0.3m).<br />
10. Finance income and costs<br />
Bank interest receivable 1.1 0.9<br />
Fair value gain – interest rate swaps 0.3 0.3<br />
Finance income 1.4 1.2<br />
Bank interest payable (1.3) (2.2)<br />
Finance costs (1.3) (2.2)<br />
Net finance costs 0.1 (1.0)<br />
2011<br />
£m<br />
2010<br />
£m<br />
2009<br />
£m<br />
2011<br />
£m<br />
2008<br />
£m<br />
2011<br />
£m<br />
<strong>Group</strong><br />
2010<br />
£m<br />
2007<br />
£m<br />
<strong>Group</strong><br />
2010<br />
£m