2012 Sustainability Report - Executive Summary - Waste Management
2012 Sustainability Report - Executive Summary - Waste Management
2012 Sustainability Report - Executive Summary - Waste Management

Create successful ePaper yourself
Turn your PDF publications into a flip-book with our unique Google optimized e-Paper software.
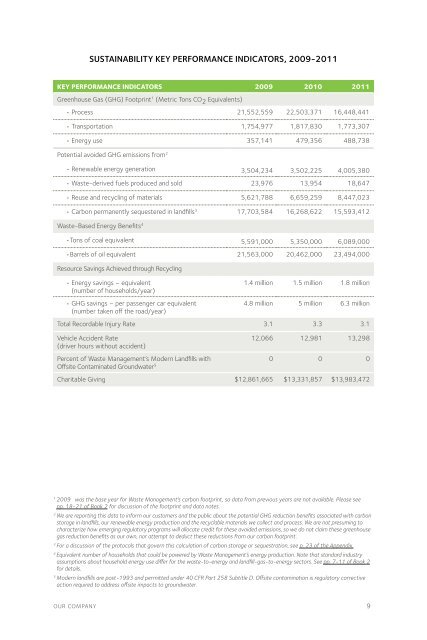
<strong>Sustainability</strong> Key Performance Indicators, 2009-2011<br />
Key Performance Indicators 2009 2010 2011<br />
Greenhouse Gas (GHG) Footprint 1 (Metric Tons CO 2 Equivalents)<br />
• Process 21,552,559 22,503,371 16,448,441<br />
• Transportation 1,754,977 1,817,830 1,773,307<br />
• Energy use 357,141 479,356 488,738<br />
Potential avoided GHG emissions from 2<br />
• Renewable energy generation 3,504,234 3,502,225 4,005,380<br />
• <strong>Waste</strong>-derived fuels produced and sold 23,976 13,954 18,647<br />
• Reuse and recycling of materials 5,621,788 6,659,259 8,447,023<br />
• Carbon permanently sequestered in landfills 3 17,703,584 16,268,622 15,593,412<br />
<strong>Waste</strong>-Based Energy Benefits 4<br />
•Tons of coal equivalent 5,591,000 5,350,000 6,089,000<br />
•Barrels of oil equivalent 21,563,000 20,462,000 23,494,000<br />
Resource Savings Achieved through Recycling<br />
• Energy savings – equivalent<br />
(number of households/year)<br />
• GHG savings – per passenger car equivalent<br />
(number taken off the road/year)<br />
1.4 million 1.5 million 1.8 million<br />
4.8 million 5 million 6.3 million<br />
Total Recordable Injury Rate 3.1 3.3 3.1<br />
Vehicle Accident Rate<br />
(driver hours without accident)<br />
12,066 12,981 13,298<br />
Percent of <strong>Waste</strong> <strong>Management</strong>’s Modern Landfills with<br />
0 0 0<br />
Offsite Contaminated Groundwater 5<br />
Charitable Giving $12,861,665 $13,331,857 $13,983,472<br />
1<br />
2009 was the base year for <strong>Waste</strong> <strong>Management</strong>’s carbon footprint, so data from previous years are not available. Please see<br />
pp. 18-21 of Book 2 for discussion of the footprint and data notes.<br />
2<br />
We are reporting this data to inform our customers and the public about the potential GHG reduction benefits associated with carbon<br />
storage in landfills, our renewable energy production and the recyclable materials we collect and process. We are not presuming to<br />
characterize how emerging regulatory programs will allocate credit for these avoided emissions, so we do not claim these greenhouse<br />
gas reduction benefits as our own, nor attempt to deduct these reductions from our carbon footprint.<br />
3<br />
For a discussion of the protocols that govern this calculation of carbon storage or sequestration, see p. 23 of the Appendix.<br />
4<br />
Equivalent number of households that could be powered by <strong>Waste</strong> <strong>Management</strong>’s energy production. Note that standard industry<br />
assumptions about household energy use differ for the waste-to-energy and landfill-gas-to-energy sectors. See pp. 7-11 of Book 2<br />
for details.<br />
5<br />
Modern landfills are post-1993 and permitted under 40 CFR Part 258 Subtitle D. Offsite contamination is regulatory corrective<br />
action required to address offsite impacts to groundwater.<br />
our company 9