2012 Sustainability Report - Executive Summary - Waste Management
2012 Sustainability Report - Executive Summary - Waste Management
2012 Sustainability Report - Executive Summary - Waste Management

Create successful ePaper yourself
Turn your PDF publications into a flip-book with our unique Google optimized e-Paper software.
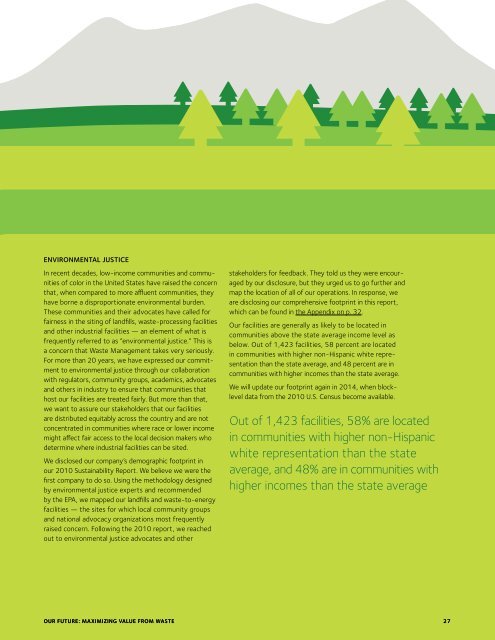
Environmental Justice<br />
In recent decades, low-income communities and communities<br />
of color in the United States have raised the concern<br />
that, when compared to more affluent communities, they<br />
have borne a disproportionate environmental burden.<br />
These communities and their advocates have called for<br />
fairness in the siting of landfills, waste-processing facilities<br />
and other industrial facilities — an element of what is<br />
frequently referred to as “environmental justice.” This is<br />
a concern that <strong>Waste</strong> <strong>Management</strong> takes very seriously.<br />
For more than 20 years, we have expressed our commitment<br />
to environmental justice through our collaboration<br />
with regulators, community groups, academics, advocates<br />
and others in industry to ensure that communities that<br />
host our facilities are treated fairly. But more than that,<br />
we want to assure our stakeholders that our facilities<br />
are distributed equitably across the country and are not<br />
concentrated in communities where race or lower income<br />
might affect fair access to the local decision makers who<br />
determine where industrial facilities can be sited.<br />
We disclosed our company’s demographic footprint in<br />
our 2010 <strong>Sustainability</strong> <strong>Report</strong>. We believe we were the<br />
first company to do so. Using the methodology designed<br />
by environmental justice experts and recommended<br />
by the EPA, we mapped our landfills and waste-to-energy<br />
facilities — the sites for which local community groups<br />
and national advocacy organizations most frequently<br />
raised concern. Following the 2010 report, we reached<br />
out to environmental justice advocates and other<br />
stakeholders for feedback. They told us they were encouraged<br />
by our disclosure, but they urged us to go further and<br />
map the location of all of our operations. In response, we<br />
are disclosing our comprehensive footprint in this report,<br />
which can be found in the Appendix on p. 32.<br />
Our facilities are generally as likely to be located in<br />
communities above the state average income level as<br />
below. Out of 1,423 facilities, 58 percent are located<br />
in communities with higher non-Hispanic white representation<br />
than the state average, and 48 percent are in<br />
communities with higher incomes than the state average.<br />
We will update our footprint again in 2014, when blocklevel<br />
data from the 2010 U.S. Census become available.<br />
Out of 1,423 facilities, 58% are located<br />
in communities with higher non-Hispanic<br />
white representation than the state<br />
average, and 48% are in communities with<br />
higher incomes than the state average<br />
OUR FUTURE: maximizing value from waste 27