XIV â Estimating µ (large samples) SOLUTIONS - SLC Home Page
XIV â Estimating µ (large samples) SOLUTIONS - SLC Home Page
XIV â Estimating µ (large samples) SOLUTIONS - SLC Home Page

You also want an ePaper? Increase the reach of your titles
YUMPU automatically turns print PDFs into web optimized ePapers that Google loves.
MATHEMATICS 201-510-LW<br />
Business Statistics<br />
Martin Huard<br />
Fall 2008<br />
<strong>XIV</strong> – <strong>Estimating</strong> µ (<strong>large</strong> <strong>samples</strong>)<br />
<strong>SOLUTIONS</strong><br />
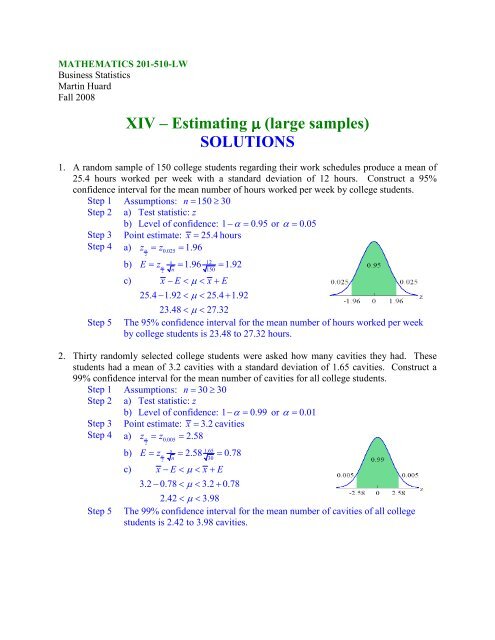
1. A random sample of 150 college students regarding their work schedules produce a mean of<br />
25.4 hours worked per week with a standard deviation of 12 hours. Construct a 95%<br />
confidence interval for the mean number of hours worked per week by college students.<br />
Step 1 Assumptions: n = 150 ≥ 30<br />
Step 2 a) Test statistic: z<br />
b) Level of confidence: 1− α = 0.95 or α = 0.05<br />
Step 3 Point estimate: x = 25.4 hours<br />
Step 4 a) zα = z 0.025<br />
= 1.96<br />
Step 5<br />
b)<br />
c)<br />
2<br />
s<br />
E = = 1.96 = 1.92<br />
z α<br />
2<br />
n<br />
12<br />
150<br />
x − E < µ < x + E<br />
25.4 − 1.92 < µ < 25.4 + 1.92<br />
23.48 < µ < 27.32<br />
The 95% confidence interval for the mean number of hours worked per week<br />
by college students is 23.48 to 27.32 hours.<br />
2. Thirty randomly selected college students were asked how many cavities they had. These<br />
students had a mean of 3.2 cavities with a standard deviation of 1.65 cavities. Construct a<br />
99% confidence interval for the mean number of cavities for all college students.<br />
Step 1 Assumptions: n = 30 ≥ 30<br />
Step 2 a) Test statistic: z<br />
b) Level of confidence: 1− α = 0.99 or α = 0.01<br />
Step 3 Point estimate: x = 3.2 cavities<br />
Step 4 a) zα = z 0.005<br />
= 2.58<br />
Step 5<br />
b)<br />
c)<br />
2<br />
s<br />
E = = 2.58 = 0.78<br />
z α<br />
2<br />
n<br />
1.65<br />
30<br />
x − E < µ < x + E<br />
3.2 − 0.78 < µ < 3.2 + 0.78<br />
2.42 < µ < 3.98<br />
The 99% confidence interval for the mean number of cavities of all college<br />
students is 2.42 to 3.98 cavities.
Math 510<br />
<strong>XIV</strong> – <strong>Estimating</strong> µ (<strong>large</strong> <strong>samples</strong>) - Solutions<br />
3. How <strong>large</strong> are math classes in CEGEP’s A random sample of 100 math classes had a mean<br />
of 28.3 students, with a standard deviation of 4.5 students. Construct a 92% confidence<br />
interval for the mean class size for all CEGEP math classes.<br />
Step 1 Assumptions: n = 100 ≥ 30<br />
Step 2 a) Test statistic: z<br />
b) Level of confidence: 1− α = 0.92 or α = 0.08<br />
Step 3 Point estimate: x = 28.3 students<br />
Step 4 a) zα = z 0.04<br />
= 1.75<br />
Step 5<br />
b)<br />
c)<br />
2<br />
s<br />
E = = 1.75 = 0.79<br />
z α<br />
2<br />
n<br />
4.5<br />
100<br />
x − E < µ < x + E<br />
28.3 − 0.79 < µ < 28.3+<br />
0.79<br />
27.51< µ < 29.09<br />
The 92% confidence interval for the mean class size for all CEGEP math<br />
classes is 27.51 to 29.09 students.<br />
4. A survey of Canadians planning a summer vacation in 2008 revealed a mean planned<br />
expenditure of $3048. Assume that this mean is based on a random sample of 300 Canadians<br />
who were planning summer vacations in 2008 and that the sample standard deviation was<br />
$710. Construct a 99% confidence interval for the mean planned expenditure by all<br />
Canadians taking a summer vacation in 2008.<br />
Step 1 Assumptions: n = 300 ≥ 30<br />
Step 2 a) Test statistic: z<br />
b) Level of confidence: 1− α = 0.99 or α = 0.01<br />
Step 3 Point estimate: x = 3048$<br />
Step 4 a) zα = z 0.005<br />
= 2.58<br />
Step 5<br />
b)<br />
c)<br />
2<br />
s<br />
E = = 2.58 = 105.76<br />
z α<br />
2<br />
n<br />
710<br />
300<br />
x − E < µ < x + E<br />
3048 − 105.76 < µ < 3048 + 105.76<br />
2942.24 < µ < 3153.76<br />
The 99% confidence interval for the mean planned expenditure by all<br />
Canadians taking a summer vacation in 2002 is $2942.24 to $3153.76.<br />
Fall 2008 Martin Huard 2
Math 510<br />
<strong>XIV</strong> – <strong>Estimating</strong> µ (<strong>large</strong> <strong>samples</strong>) - Solutions<br />
5. Do people who stop smoking tend to gain weight A study (later published in a medical<br />
journal) was undertaken to answer this question. The authors of this study collected data on<br />
a random sample of 315 men over the age of 35 who had quit smoking during the past 10<br />
years and found that these men had gained an average of 5.28 kilograms since quitting<br />
smoking with a standard deviation of 0.59 kilogram. Construct a 98% confidence interval for<br />
the corresponding population mean.<br />
Step 1 Assumptions: n = 315 ≥ 30<br />
Step 2 a) Test statistic: z<br />
b) Level of confidence: 1− α = 0.98 or α = 0.02<br />
Step 3 Point estimate: x = 5.28 kg<br />
Step 4 a) zα = z 0.01<br />
= 2.33<br />
Step 5<br />
b)<br />
c)<br />
2<br />
s<br />
E = = 2.33 = 0.077<br />
z α<br />
2<br />
n<br />
0.59<br />
315<br />
x − E < µ < x + E<br />
5.28 − 0.077 < µ < 5.28 + 0.077<br />
5.203 < µ < 5.357<br />
The 98% confidence interval for the mean weight gain by men over the age of<br />
35 who had quit smoking during the past 10 years is 5.203 to 5.357 kg.<br />
6. The CAA estimated that Canadians planned to spend an average of 4.8 nights away on<br />
vacation in 2007. Suppose that this mean was based on a sample of 500 Canadians who<br />
planned vacations and that the sample standard deviation was 1.5 nights. Make a 97%<br />
confidence interval for the mean length of vacations Canadians planned in 2007.<br />
Step 1 Assumptions: n = 500 ≥ 30<br />
Step 2 a) Test statistic: z<br />
b) Level of confidence: 1− α = 0.97 or α = 0.03<br />
Step 3 Point estimate: x = 4.8 days<br />
Step 4 a) zα = z 0.015<br />
= 2.17<br />
Step 5<br />
b)<br />
c)<br />
2<br />
s<br />
E = = 2.17 = 0.15<br />
z α<br />
2<br />
n<br />
1.5<br />
500<br />
x − E < µ < x + E<br />
4.8 − 0.15 < µ < 4.8 + 0.15<br />
4.65 < µ < 4.95<br />
The 97% confidence interval for the mean length of vacations Canadians<br />
planned in 2002 is 4.65 to 4.95 days.<br />
Fall 2008 Martin Huard 3
Math 510<br />
<strong>XIV</strong> – <strong>Estimating</strong> µ (<strong>large</strong> <strong>samples</strong>) - Solutions<br />
7. A random sample of 60 night school students’ ages is obtained in order to estimate the mean<br />
age of night school students. If the sample mean is 25.3 years and the sample variance 16,<br />
find a 95% confidence interval for the mean age of night school students.<br />
Step 1 Assumptions: n = 60 ≥ 30<br />
Step 2 c) Test statistic: z<br />
d) Level of confidence: 1− α = 0.95 or α = 0.05<br />
Step 3 Point estimate: x = 25.3 years old<br />
Step 4 d) zα = z 0.025<br />
= 1.96<br />
e)<br />
f)<br />
2<br />
s<br />
E = = 1.96 = 1.01<br />
z α<br />
2<br />
n<br />
4<br />
60<br />
x − E < µ < x + E<br />
25.3 − 1.01< µ < 25.3+<br />
1.01<br />
24.29 < µ < 26.31<br />
Step 5 The 95% confidence interval for the mean age of night school students is 24.29<br />
to 26.31 years old.<br />
8. A high-tech company wants to estimate the mean number of years of college education its<br />
employees have completed. A good estimate of the standard deviation for the mean number<br />
of years of college is 1.0. How <strong>large</strong> a sample needs to be taken to estimate µ to within one<br />
quarter of a year with 99% confidence<br />
1− α = 0.99 α = 0.01<br />
z<br />
α<br />
2<br />
= z = 2.58<br />
0.005<br />
2<br />
2<br />
⎛ zα<br />
s ⎞ 2.58 1<br />
2<br />
⎛ ⋅ ⎞<br />
n = = = 106.2<br />
⎜ ⎜ ⎟<br />
E ⎟<br />
⎝ ⎠ ⎝ 0.25 ⎠<br />
Thus 107 employees.<br />
9. A researcher wants to determine a 95% confidence interval for the mean number of hours<br />
that high school students spend doing homework per week. A preliminary study showed that<br />
the standard deviation for hours spent per week by all high school students doing homework<br />
is 0.7. How <strong>large</strong> a sample should the researcher select so that the estimate will be within<br />
0.15 hours of the population mean<br />
1− α = 0.95 α = 0.05<br />
z<br />
α<br />
2<br />
= z = 1.96<br />
0.025<br />
2<br />
2<br />
⎛ zα<br />
s ⎞ 1.96 0.7<br />
2<br />
⎛ ⋅ ⎞<br />
n = = = 83.7<br />
⎜ ⎜ ⎟<br />
E ⎟<br />
⎝ ⎠ ⎝ 0.15 ⎠<br />
Thus 84 high school students<br />
Fall 2008 Martin Huard 4
Math 510<br />
<strong>XIV</strong> – <strong>Estimating</strong> µ (<strong>large</strong> <strong>samples</strong>) - Solutions<br />
10. A department store manager wants to estimate at a 90% confidence level the mean amount<br />
spent by all customers at this store. From an earlier study, the manager knows that the<br />
standard deviation of amounts spent by customers at this store is $27. What sample size<br />
should he choose so that the estimate is within $3 of the population mean<br />
1− α = 0.90 α = 0.10<br />
z<br />
α<br />
2<br />
= z = 1.645<br />
0.05<br />
2<br />
2<br />
⎛ zα<br />
s ⎞ 1.645 27<br />
2<br />
⎛ ⋅ ⎞<br />
n = = = 219.1<br />
⎜ ⎜ ⎟<br />
E ⎟<br />
⎝ ⎠ ⎝ 3 ⎠<br />
Thus 220 customers.<br />
Fall 2008 Martin Huard 5