features vector for personal identification based on iris texture
features vector for personal identification based on iris texture
features vector for personal identification based on iris texture

You also want an ePaper? Increase the reach of your titles
YUMPU automatically turns print PDFs into web optimized ePapers that Google loves.
FEATURES VECTOR FOR PERSONAL<br />
IDENTIFICATION BASED ON IRIS TEXTURE<br />
R. P. Moreno<br />
Departamento de Engenharia Elétrica<br />
EESC - USP<br />
Av. Trabalhador Sãocarlense, 400<br />
São Carlos / SP – Brasil<br />
raphael@digmotor.com.br<br />
A. G<strong>on</strong>zaga<br />
Departamento de Engenharia Elétrica<br />
EESC - USP<br />
Av. Trabalhador Sãocarlense, 400<br />
São Carlos / SP – Brasil<br />
adils<strong>on</strong>@sel.eesc.sc.usp.br<br />
Abstract<br />
This work presents a biometric method <str<strong>on</strong>g>for</str<strong>on</strong>g> <str<strong>on</strong>g>identificati<strong>on</strong></str<strong>on</strong>g> <str<strong>on</strong>g>vector</str<strong>on</strong>g> building <str<strong>on</strong>g>based</str<strong>on</strong>g> <strong>on</strong><br />
human <strong>iris</strong> <str<strong>on</strong>g>features</str<strong>on</strong>g>. The proposed work is <str<strong>on</strong>g>based</str<strong>on</strong>g> <strong>on</strong> <strong>iris</strong> <strong>texture</strong> <str<strong>on</strong>g>features</str<strong>on</strong>g> analysis and<br />
extracti<strong>on</strong>. The work is divided in 3 steps. In the first, the eye image is preprocessed<br />
and Hough Trans<str<strong>on</strong>g>for</str<strong>on</strong>g>m <str<strong>on</strong>g>for</str<strong>on</strong>g> circles does the <strong>iris</strong> localizati<strong>on</strong> and segmentati<strong>on</strong>. In the<br />
sec<strong>on</strong>d step, the <strong>iris</strong> <str<strong>on</strong>g>features</str<strong>on</strong>g> in<str<strong>on</strong>g>for</str<strong>on</strong>g>mati<strong>on</strong> is extracted by a sec<strong>on</strong>d order statistical<br />
approach, using the Haralick’s <strong>texture</strong> <str<strong>on</strong>g>features</str<strong>on</strong>g> as classificati<strong>on</strong> parameters. Finally in<br />
the last step, the in<str<strong>on</strong>g>for</str<strong>on</strong>g>mati<strong>on</strong> is saved in a feature <str<strong>on</strong>g>vector</str<strong>on</strong>g> that can be used <str<strong>on</strong>g>for</str<strong>on</strong>g> <strong>iris</strong><br />
recogniti<strong>on</strong>.<br />
Keywords: Haralick, pattern recogniti<strong>on</strong>, biometrics, <strong>iris</strong>, <strong>texture</strong>.<br />
1 Introducti<strong>on</strong><br />
Biometry is the group of automatic methods used in people recogniti<strong>on</strong>, <str<strong>on</strong>g>based</str<strong>on</strong>g> in physiological or<br />
behavioral <str<strong>on</strong>g>features</str<strong>on</strong>g>. Examples of behavioral <str<strong>on</strong>g>features</str<strong>on</strong>g> are signature, gait, voice, etc. Examples of<br />
physiological <str<strong>on</strong>g>features</str<strong>on</strong>g> are fingerprint, face, <strong>iris</strong>, hand geometry, the veins in ocular retina, etc. One<br />
of the biometric advantages, if it is compared with c<strong>on</strong>venti<strong>on</strong>al methods, is the possibility of<br />
identify, authenticate and localize people without requiring that they carry cards or memorize<br />
passwords [1].<br />
Recently, the number of studies and researches in <strong>iris</strong> recogniti<strong>on</strong> has increased significantly. This<br />
crescent increase happens because, in <str<strong>on</strong>g>identificati<strong>on</strong></str<strong>on</strong>g> systems, <strong>iris</strong> is more efficient, stable and<br />
accurate than the others biometric <str<strong>on</strong>g>features</str<strong>on</strong>g> [2].<br />
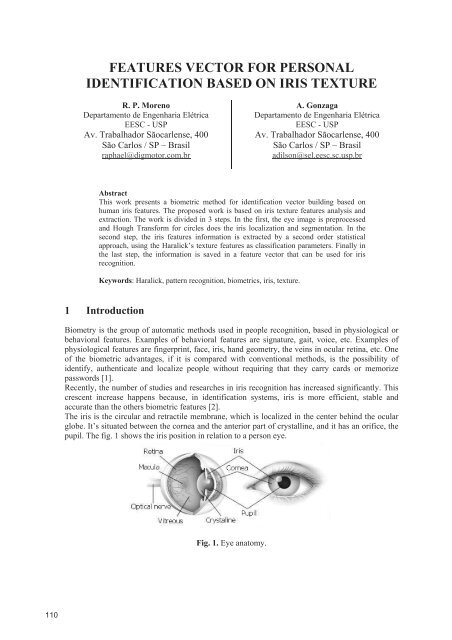
The <strong>iris</strong> is the circular and retractile membrane, which is localized in the center behind the ocular<br />
globe. It’s situated between the cornea and the anterior part of crystalline, and it has an orifice, the<br />
pupil. The fig. 1 shows the <strong>iris</strong> positi<strong>on</strong> in relati<strong>on</strong> to a pers<strong>on</strong> eye.<br />
Fig. 1. Eye anatomy.<br />
110
R. M. Moreno; A. G<strong>on</strong>zaga<br />
Formed by a multi-layer structure, the <strong>iris</strong> has a very complex color and shape pattern. It can be<br />
observed in fig. 2.<br />
Fig. 2. Iris structure seen in a fr<strong>on</strong>tal sector.<br />
The human <strong>iris</strong> possibility of been used as a biometric signature was first suggested by<br />
ophthalmologists [3]. They verified, through clinical experience, that each <strong>iris</strong> had a very detailed<br />
<strong>texture</strong>.<br />
Recogniti<strong>on</strong> biometric systems <str<strong>on</strong>g>based</str<strong>on</strong>g> <strong>on</strong> <strong>iris</strong> study are possible because of some <str<strong>on</strong>g>features</str<strong>on</strong>g>. The most<br />
important of them is the <strong>iris</strong> uniqueness, which is a result of the chaotic organizati<strong>on</strong> of its patterns,<br />
established by the initial c<strong>on</strong>diti<strong>on</strong>s in the embry<strong>on</strong>ic genetic, [4]. The probability of two people<br />
having the same <strong>iris</strong> pattern is estimated in <strong>on</strong>e in 10 78 people. As written in [5], the right and left<br />
eyes of the same pers<strong>on</strong> have different <strong>texture</strong> patterns.<br />
Another important feature is the <strong>iris</strong> stability. A normal <strong>iris</strong> is usually lubricated and preserved by<br />
the cornea and aqueous humor, becoming <strong>on</strong>e of the most protected organs in a human body.<br />
Besides, the localizati<strong>on</strong>, size, shape and orientati<strong>on</strong> remain stable and fixed from about <strong>on</strong>e year of<br />
age throughout life [6].<br />
2 Iris localizati<strong>on</strong><br />
The <strong>iris</strong> localizati<strong>on</strong> in an image is the task of find a ring situated between the pupil and the<br />
sclera. It is equivalent to finding n<strong>on</strong>-c<strong>on</strong>centric circles which determinate the internal and<br />
external borders of the ring. The method used in this work finds the center coordinate and<br />
the ray of the pupil, which is the internal border of the <strong>iris</strong>, through the Hough Trans<str<strong>on</strong>g>for</str<strong>on</strong>g>m<br />
(HT) <str<strong>on</strong>g>for</str<strong>on</strong>g> circles [7].<br />
Compared with all others parts in the image, the pupil is much darker. So, after the applicati<strong>on</strong> of a<br />
threshold, followed by an edge detector, the image will be ready to the Hough Trans<str<strong>on</strong>g>for</str<strong>on</strong>g>m<br />
technique.<br />
The width of the <strong>iris</strong> ring used is fixed, separating just the <strong>iris</strong> regi<strong>on</strong> near the pupil.<br />
Due to partial <strong>iris</strong> occlusi<strong>on</strong> by the eyelid and eyelashes, the upper part of the <strong>iris</strong> ring was removed<br />
and it is not used in the algorithm sequence. The fig. 3 shows an original image (a) and the same<br />
image after the <strong>iris</strong> localizati<strong>on</strong> (b).<br />
111
R. M. Moreno; A. G<strong>on</strong>zaga<br />
Fig. 3. (a) Original image. (b) Segmented <strong>iris</strong>.<br />
After the pupil and c<strong>on</strong>sequently the <strong>iris</strong> localizati<strong>on</strong>, the system becomes robust to the pupil size<br />
and the positi<strong>on</strong> of the eye in the image.<br />
3 Haralick’s <str<strong>on</strong>g>features</str<strong>on</strong>g><br />
In this work, it is proposed an <strong>iris</strong> feature extracti<strong>on</strong> methodology <str<strong>on</strong>g>based</str<strong>on</strong>g> in the Haralick’s approach<br />
[8]. It uses sec<strong>on</strong>d order statistics, by analyzing the relative positi<strong>on</strong> of the image pixels. Through<br />
this method, distinct images with equal first order histograms still can be differentiated.<br />
The sec<strong>on</strong>d order statistical measures are d<strong>on</strong>e in probabilities’ distributi<strong>on</strong>s or co-occurrence<br />
matrixes. These matrixes (GLCM – gray level co-occurrence matrix) are bi-dimensi<strong>on</strong>al<br />
representati<strong>on</strong>s showing the spatial occurrence organizati<strong>on</strong> of the gray levels in an image. They<br />
represent a bi-dimensi<strong>on</strong>al histogram of the gray levels, where fixed spatial relati<strong>on</strong> separates<br />
couples of pixels, defining the directi<strong>on</strong> and distance (d,) from a referenced pixel to its neighbor.<br />
To build these matrixes, the couple of pixels’ variati<strong>on</strong> is d<strong>on</strong>e in the following angles: 0°, 45°, 90°<br />
e 135°, originating four distinct co-occurrence matrixes.<br />
After computing the co-occurrence matrixes, several sec<strong>on</strong>d orders statistical calculus can be<br />
calculated, including the Haralick’s <str<strong>on</strong>g>features</str<strong>on</strong>g>. These are the <str<strong>on</strong>g>features</str<strong>on</strong>g> used in this work:<br />
<br />
<br />
<br />
<br />
<br />
Sec<strong>on</strong>d Angular Moment (SAM): measures the local homogeneity of gray levels in an<br />
image. The SAM equati<strong>on</strong> is given by:<br />
SAM <br />
n 1 n1<br />
i 0<br />
i0<br />
2<br />
P<br />
( i,<br />
j,<br />
d , )<br />
<br />
C<strong>on</strong>trast: it measures the local quantity of gray levels in an image. The C<strong>on</strong>trast<br />
equati<strong>on</strong> is given by:<br />
n<br />
1n<br />
<br />
<br />
1 2<br />
C<strong>on</strong>trast ( i j)<br />
P(<br />
i,<br />
j,<br />
d,<br />
)<br />
(2)<br />
i 0 i 0<br />
Entropy: also called as dispersi<strong>on</strong> degree of the gray levels, it measures together with<br />
the SAM, the homogeneity in an image. The Entropy equati<strong>on</strong> is given by:<br />
Entropy <br />
n<br />
<br />
1 n1<br />
i0<br />
i<br />
0<br />
P(<br />
i,<br />
j,<br />
d,<br />
<br />
(1)<br />
) log2 P(<br />
i,<br />
j,<br />
d,<br />
)<br />
<br />
(3)<br />
Inverse Difference Moment (IDM): The IDM equati<strong>on</strong> is given by:<br />
n<br />
<br />
1 n1<br />
i0<br />
i0<br />
1<br />
IDM <br />
P(<br />
i,<br />
j,<br />
d,<br />
)<br />
2<br />
(4)<br />
1<br />
( i j)<br />
Correlati<strong>on</strong>: it represents the linearity dependence of gray levels in an image. The<br />
Correlati<strong>on</strong> equati<strong>on</strong> is given by:<br />
112
R. M. Moreno; A. G<strong>on</strong>zaga<br />
Where,<br />
n n<br />
1<br />
i j P i j d x<br />
y<br />
Correlati<strong>on</strong><br />
i<br />
i<br />
1<br />
( , , , ) <br />
<br />
0 0<br />
(5)<br />
x<br />
y<br />
<br />
n<br />
1n<br />
<br />
<br />
1<br />
x i P(<br />
i,<br />
j,<br />
d,<br />
)<br />
i 0 i 0<br />
, n<br />
1n<br />
<br />
<br />
1<br />
y j P(<br />
i,<br />
j,<br />
d,<br />
)<br />
i 0 i 0<br />
n<br />
1n<br />
<br />
<br />
1 2<br />
n<br />
x<br />
i P(<br />
i,<br />
j,<br />
d,<br />
) x , 1n<br />
<br />
i 0 i 0<br />
<br />
1 2<br />
y<br />
j P(<br />
i,<br />
j,<br />
d,<br />
) y<br />
i 0 i 0<br />
And, x and y represent the mean in X and Y directi<strong>on</strong>, and y and y represent the<br />
variance.<br />
4 Feature <str<strong>on</strong>g>vector</str<strong>on</strong>g><br />
In this work, the segmented <strong>iris</strong> is divided into six sectors having the same size, as showed in fig. 4.<br />
The number of sectors was defined to increase the classifying method efficiency through the<br />
<strong>texture</strong> <str<strong>on</strong>g>features</str<strong>on</strong>g>.<br />
Fig. 4. Segmented <strong>iris</strong> divided in six sectors.<br />
For each sector, the five Haralick’s <str<strong>on</strong>g>features</str<strong>on</strong>g> are calculated resulting in a feature <str<strong>on</strong>g>vector</str<strong>on</strong>g> with 30<br />
values. This <str<strong>on</strong>g>vector</str<strong>on</strong>g> will be saved in the database or used in an <str<strong>on</strong>g>identificati<strong>on</strong></str<strong>on</strong>g> or authenticati<strong>on</strong><br />
process.<br />
5 Image database<br />
The image database used to test the algorithm, CASIA versi<strong>on</strong> 1.0 [9], was developed by the Iris<br />
Recogniti<strong>on</strong> Research Group - Nati<strong>on</strong>al Laboratory of Pattern Recogniti<strong>on</strong> (NLPR) from the<br />
Institute of Automati<strong>on</strong>, Chinese Academy of Sciences. The dataset has images with 256 gray<br />
levels, and resoluti<strong>on</strong> of 320x280 pixels, captured through a digital optical sensor also developed<br />
by the NLPR. There are 756 images of 108 eyes from 80 people.<br />
In this dataset, seven images were taken from each <strong>iris</strong>, in two different moments. In the first <strong>on</strong>e,<br />
three images were taken and in the sec<strong>on</strong>d moment, <strong>on</strong>e m<strong>on</strong>th later, more four images were taken.<br />
6 Tests and results<br />
The algorithm finds the proximity of two <strong>iris</strong>es calculating the normalized Euclidian distance of the<br />
two <str<strong>on</strong>g>features</str<strong>on</strong>g> <str<strong>on</strong>g>vector</str<strong>on</strong>g>s, as described in equati<strong>on</strong> 6.<br />
( A,<br />
B)<br />
30 <br />
i 1<br />
<br />
<br />
2<br />
A i B i<br />
Ai<br />
D (6)<br />
113
R. M. Moreno; A. G<strong>on</strong>zaga<br />
The fig. 5 shows an example of the distance calculus between an <strong>iris</strong> and the others 107 resting in<br />
the database.<br />
Fig. 5. Euclidian distance example.<br />
For each comparis<strong>on</strong> between two <strong>iris</strong>es' images, the algorithm returns a number. To show if the<br />
<str<strong>on</strong>g>vector</str<strong>on</strong>g>s are from the same <strong>iris</strong>, the algorithm compare the value returned with a t (threshold) value,<br />
previous established. With this in<str<strong>on</strong>g>for</str<strong>on</strong>g>mati<strong>on</strong>, it's possible to evaluate the system accuracy varying<br />
the t value and building the ROC curve (receiver operating characteristic).<br />
To build the ROC curve, it was generated a dataset with the mean feature <str<strong>on</strong>g>vector</str<strong>on</strong>g> taken from each<br />
<strong>on</strong>e of the 108 <strong>iris</strong>es of the database. The mean <str<strong>on</strong>g>vector</str<strong>on</strong>g>s were obtained calculating the means am<strong>on</strong>g<br />
the seven <str<strong>on</strong>g>features</str<strong>on</strong>g> <str<strong>on</strong>g>vector</str<strong>on</strong>g>s from each image of the same <strong>iris</strong>.<br />
After that, <str<strong>on</strong>g>for</str<strong>on</strong>g> each t value it was d<strong>on</strong>e an authenticati<strong>on</strong> try between each database image and the<br />
others 107 <strong>iris</strong>es. As the database has 756 images, 81648 authenticati<strong>on</strong> tries were d<strong>on</strong>e. During the<br />
authenticati<strong>on</strong> tries, the number of false accepted (FA) and false rejected (FR) were found. The<br />
Table 1 and the figure 6 show the FA and FR probability's distributi<strong>on</strong> with the t variati<strong>on</strong>.<br />
Table 1. False accepted probability, P (FA) and false rejected probability, P (FR).<br />
t P (FA) P (FR)<br />
0,00 100,000% 0,000%<br />
0,05 47,153% 3,571%<br />
0,10 43,496% 3,704%<br />
0,15 39,726% 4,101%<br />
0,20 35,634% 4,762%<br />
0,25 31,469% 6,085%<br />
0,30 27,150% 7,011%<br />
0,35 22,927% 7,804%<br />
0,40 18,671% 9,392%<br />
0,45 14,532% 11,243%<br />
0,50 10,673% 13,889%<br />
0,55 7,347% 17,989%<br />
0,60 4,604% 22,354%<br />
0,65 2,479% 27,910%<br />
0,70 1,024% 35,185%<br />
0,75 0,307% 47,222%<br />
0,80 0,066% 62,963%<br />
0,85 0,002% 78,704%<br />
114
0,90 0,000% 94,577%<br />
0,95 0,000% 100,000%<br />
R. M. Moreno; A. G<strong>on</strong>zaga<br />
Fig. 6. False accept probability, P (FA) and false reject probability, P (FR).<br />
The ROC curve, which represents the system accuracy, is showed in fig. 7 and was built with the<br />
P (FA) e P (FR) values showed in figure 6.<br />
C<strong>on</strong>clusi<strong>on</strong><br />
Fig. 7. ROC curve.<br />
The ROC curve analysis validates the Haralick’s <str<strong>on</strong>g>features</str<strong>on</strong>g> <str<strong>on</strong>g>for</str<strong>on</strong>g> using as a biometric feature extracti<strong>on</strong><br />
of human being, because they can reproduce the <strong>iris</strong> unique feature. Also, it is possible to c<strong>on</strong>clude<br />
that the way chosen to divide the <strong>iris</strong> ring is an efficient method to obtain a uni<str<strong>on</strong>g>for</str<strong>on</strong>g>m <strong>texture</strong> regi<strong>on</strong>.<br />
Another important point is that in the majority of the cases, the false accepted and the false rejected<br />
were obtained due to some kind of fail in the <strong>iris</strong> image. The partial occlusi<strong>on</strong> and the lack of focus<br />
were the principal fail reas<strong>on</strong>s. Fig. 8 shows an eye image with the <strong>iris</strong> very obstructed, what turns<br />
its <str<strong>on</strong>g>identificati<strong>on</strong></str<strong>on</strong>g> a hard job.<br />
115
R. M. Moreno; A. G<strong>on</strong>zaga<br />
Fig. 8. Partial occlusi<strong>on</strong> of the <strong>iris</strong>.<br />
The <str<strong>on</strong>g>identificati<strong>on</strong></str<strong>on</strong>g> also becomes difficult when the images, used to build the mean feature <str<strong>on</strong>g>vector</str<strong>on</strong>g>,<br />
have many differences.<br />
References<br />
[1] Negin, M. et al. (2000). An <strong>iris</strong> biometric system <str<strong>on</strong>g>for</str<strong>on</strong>g> public and <str<strong>on</strong>g>pers<strong>on</strong>al</str<strong>on</strong>g> use. IEEE, p.70-75.<br />
[2] Jain, A.K. et al. (1999). Pers<strong>on</strong>al Identificati<strong>on</strong> in a network society. Norwell, MA - Kluwer.<br />
[3] Adler, F.H. (1965). Physiology of the eye: Clinical applicati<strong>on</strong>. The C. V. Mosby Company, 4a<br />
edição, L<strong>on</strong>dres.<br />
[4] Daugman, J. (1993). High c<strong>on</strong>fidence visual recogniti<strong>on</strong> of pers<strong>on</strong>s by a test of statistical<br />
independence. IEEE Transacti<strong>on</strong>s <strong>on</strong> Pattern Analysis and Machine Intelligence, v.15, no.<br />
11, p.1148-1161.<br />
[5] El-Balkry, H.M. (2001). Human <strong>iris</strong> detecti<strong>on</strong> using fast cooperative modular neural nets.<br />
Neural works, Proceedings of Internati<strong>on</strong>al Joint C<strong>on</strong>ference <strong>on</strong> IJCNN’01, v.1, p.577-582.<br />
[6] Willians, G.O. (1997). Iris recogniti<strong>on</strong> technology. IEEE AES Systems Magazine, abril 1997,<br />
p.23-29.<br />
[7] Haralick, R.M.; Shanmugan, M.K. (1973). Computer classificati<strong>on</strong> of reservoir sandst<strong>on</strong>es.<br />
IEEE Transacti<strong>on</strong>s <strong>on</strong> Geoscience Electr<strong>on</strong>ics, v.11, no. 4, p.171-177, Oct.<br />
[8] Hough, P.V.C. (1962). Methods and means <str<strong>on</strong>g>for</str<strong>on</strong>g> recognizing complex patterns. U.S. Patent<br />
3.069.654.<br />
[9] CASIA. Iris Image Database versão 1.0, http://www.sinobiometrics.com.<br />
116