The Role of Rheology in Polymer Extrusion - Polydynamics, Inc.
The Role of Rheology in Polymer Extrusion - Polydynamics, Inc.
The Role of Rheology in Polymer Extrusion - Polydynamics, Inc.

Create successful ePaper yourself
Turn your PDF publications into a flip-book with our unique Google optimized e-Paper software.
John Vlachopoulos<br />
Department <strong>of</strong> Chemical Eng<strong>in</strong>eer<strong>in</strong>g<br />
McMaster University<br />
Hamilton, Ontario, Canada<br />
E-mail: vlachopj@mcmaster.ca<br />
David Strutt<br />
<strong>Polydynamics</strong>, <strong>Inc</strong>.<br />
Hamilton, Ontario, Canada<br />
<strong>The</strong> <strong>Role</strong> <strong>of</strong> <strong>Rheology</strong> <strong>in</strong> <strong>Polymer</strong> <strong>Extrusion</strong><br />
1.0 <strong>Rheology</strong><br />
<strong>Rheology</strong> is the science <strong>of</strong> deformation and flow <strong>of</strong> materials [1]. <strong>The</strong> Society <strong>of</strong><br />
<strong>Rheology</strong>'s Greek motto "Panta Rei" translates as "All th<strong>in</strong>gs flow." Actually, all materials do<br />
flow, given sufficient time. What makes polymeric materials <strong>in</strong>terest<strong>in</strong>g <strong>in</strong> this context is the<br />
fact that their time constants for flow are <strong>of</strong> the same order <strong>of</strong> magnitude as their process<strong>in</strong>g<br />
times for extrusion, <strong>in</strong>jection mold<strong>in</strong>g and blow mold<strong>in</strong>g. In very short process<strong>in</strong>g times, the<br />
polymer may behave as a solid, while <strong>in</strong> long process<strong>in</strong>g times the material may behave as a<br />
fluid. This dual nature (fluid-solid) is referred to as viscoelastic behavior.<br />
1.1 Viscosity and Melt Flow Index<br />
Viscosity is the most important flow property. It represents the resistance to flow.<br />
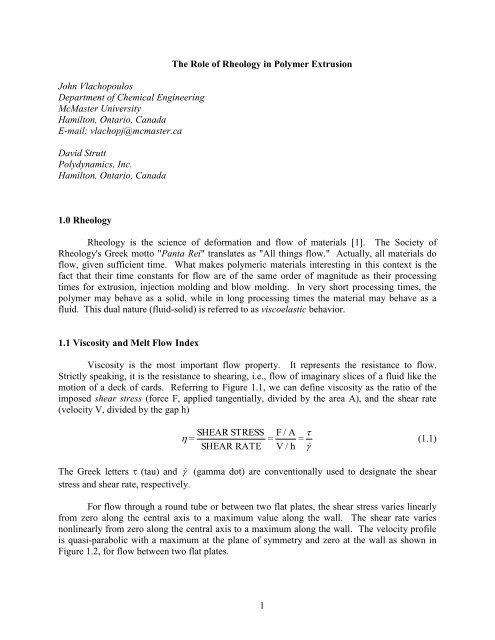
Strictly speak<strong>in</strong>g, it is the resistance to shear<strong>in</strong>g, i.e., flow <strong>of</strong> imag<strong>in</strong>ary slices <strong>of</strong> a fluid like the<br />
motion <strong>of</strong> a deck <strong>of</strong> cards. Referr<strong>in</strong>g to Figure 1.1, we can def<strong>in</strong>e viscosity as the ratio <strong>of</strong> the<br />
imposed shear stress (force F, applied tangentially, divided by the area A), and the shear rate<br />
(velocity V, divided by the gap h)<br />
SHEAR STRESS F / A <br />
= = =<br />
(1.1)<br />
SHEAR RATE V / h <br />
<strong>The</strong> Greek letters (tau) and (gamma dot) are conventionally used to designate the shear<br />
stress and shear rate, respectively.<br />
For flow through a round tube or between two flat plates, the shear stress varies l<strong>in</strong>early<br />
from zero along the central axis to a maximum value along the wall. <strong>The</strong> shear rate varies<br />
nonl<strong>in</strong>early from zero along the central axis to a maximum along the wall. <strong>The</strong> velocity pr<strong>of</strong>ile<br />
is quasi-parabolic with a maximum at the plane <strong>of</strong> symmetry and zero at the wall as shown <strong>in</strong><br />
Figure 1.2, for flow between two flat plates.<br />
1
Figure 1.1. Simple shear flow.<br />
Figure 1.2. Velocity, shear rate and shear stress pr<strong>of</strong>iles for flow between two flat plates.<br />
2
<strong>The</strong> viscosity <strong>in</strong> SI is reported <strong>in</strong> units <strong>of</strong> Pas (Pascalsecond). Before the <strong>in</strong>troduction <strong>of</strong><br />
SI, poise was the most frequently used unit (1 Pas = 10 poise). Here are some other useful<br />
conversion factors.<br />
1 Pas = 1.45 10 -4 lb f s/<strong>in</strong> 2 = 0.67197 lb m /s ft = 2.0886 10 -2 lb f s/ft 2<br />
<strong>The</strong> viscosity <strong>of</strong> water is 10 –3 Pas while the viscosity <strong>of</strong> most polymer melts under<br />
extrusion conditions may vary from 10 2 Pas to 10 5 Pas. <strong>The</strong> shear stress is measured <strong>in</strong> units <strong>of</strong><br />
Pa = (N/m 2 ) or psi (pounds (lb f ) per square <strong>in</strong>ch) and the shear rate <strong>in</strong> reciprocal seconds (s –1 ).<br />
One remarkable property <strong>of</strong> polymeric liquids is their shear-th<strong>in</strong>n<strong>in</strong>g behavior (also<br />
known as pseudo-plastic behavior). If we <strong>in</strong>crease the rate <strong>of</strong> shear<strong>in</strong>g (i.e., extrude faster<br />
through a die), the viscosity becomes smaller, as shown <strong>in</strong> Figure 1.3. This reduction <strong>of</strong><br />
viscosity is due to molecular alignments and disentanglements <strong>of</strong> the long polymer cha<strong>in</strong>s. As<br />
one author said <strong>in</strong> a recent article: "polymers love shear." <strong>The</strong> higher the shear rate, the easier it<br />
is to force polymers to flow through dies and process equipment. Dur<strong>in</strong>g s<strong>in</strong>gle-screw extrusion,<br />
shear rates may reach 200 s –1 <strong>in</strong> the screw channel near the barrel wall, and much higher between<br />
the flight tips and the barrel. At the lip <strong>of</strong> the die the shear rate can be as high as 1000 s –1 . Low<br />
shear rate on a die wall implies slow movement <strong>of</strong> the polymer melt over the metal surface.<br />
Some die designers try to design dies for cast film or blown film operations not hav<strong>in</strong>g wall<br />
shear rates less than, say 10 s –1 , to prevent potential hang-ups <strong>of</strong> the molten material. When the<br />
wall shear stress exceeds 0.14 MPa, sharksk<strong>in</strong> (i.e. surface mattness) occurs <strong>in</strong> capillary<br />
viscometer measurements us<strong>in</strong>g various HDPE grades. At very high shear rates, a flow<br />
<strong>in</strong>stability known as melt fracture occurs [2, 3].<br />
Melt Index (MI), Melt Flow Index (MFI), or Melt Flow Rate (MFR) (for polypropylene)<br />
refers to the grams per 10 m<strong>in</strong>utes pushed out <strong>of</strong> a die <strong>of</strong> prescribed dimensions accord<strong>in</strong>g to an<br />
ASTM Standard [4] under the action <strong>of</strong> a specified load as shown <strong>in</strong> Figure 1.4. For PE (ASTM<br />
D-1238) the load is 2.16 kg and the die dimensions are D = 2.095 mm and L = 8 mm. <strong>The</strong><br />
experiment is carried out at 190°C. For the PP, the same load and die dimensions are used, but<br />
the experiment is carried out at 230°C.<br />
Under the conditions <strong>of</strong> melt <strong>in</strong>dex measurement with a 2.16 kg load, the wall shear<br />
stress can be calculated to be w = 1.94 10 4 Pa (= 2.814 psi) and the wall shear rate<br />
approximately = (1838/) MI where is the melt density <strong>in</strong> kg/m 3 . Assum<strong>in</strong>g = 766<br />
kg/m 3 for a typical PE melt, we get = 2.4 MI. Low melt <strong>in</strong>dex means a high-molecularweight,<br />
highly viscous polymer. A high melt <strong>in</strong>dex means low-molecular-weight, low viscosity<br />
polymer. When the melt <strong>in</strong>dex is less than 1, the material is said to have a fractional melt <strong>in</strong>dex.<br />
Such materials are used for film extrusion. Most extrusion PE grades seldom exceed MI = 12;<br />
however, for <strong>in</strong>jection mold<strong>in</strong>g, MI is usually <strong>in</strong> the range <strong>of</strong> 5–100.<br />
Viscosity can be measured by either capillary or rotational viscometers. In capillary<br />
viscometers, the shear stress is determ<strong>in</strong>ed from the pressure applied by a piston. <strong>The</strong> shear rate<br />
is determ<strong>in</strong>ed from the flow rate.<br />
3
Figure 1.3. Newtonian and shear-th<strong>in</strong>n<strong>in</strong>g viscosity behavior.<br />
Figure 1.4. Schematic <strong>of</strong> a melt <strong>in</strong>dexer.<br />
4
Pcap<br />
w = shear stress<br />
(1.2)<br />
L/R<br />
4 Q<br />
= apparent shear rate<br />
(1.3)<br />
a 3<br />
R<br />
where P cap is pressure drop, L is capillary length, R is radius, and Q the volume flow rate.<br />
<strong>The</strong> apparent shear rate corresponds to Newtonian behavior (constant viscosity fluids). A<br />
correction is necessary (Rab<strong>in</strong>owitsch correction) for shear th<strong>in</strong>n<strong>in</strong>g fluids. For the power-law<br />
model, the true (Rab<strong>in</strong>owitsch corrected) shear rate becomes<br />
3 n + 1 4 Q<br />
= (1.4)<br />
3<br />
4 n R<br />
This means that for a material with power-law <strong>in</strong>dex n = 0.4 (very common), the relation<br />
between apparent and true shear rate is<br />
<br />
true<br />
= 1.375 <br />
(1.5)<br />
apparent<br />
When capillaries are relatively short (L/R < 50), the Bagley correction is necessary to<br />
account for the excess pressure drop P e at the capillary entry. <strong>The</strong> Bagley correction is usually<br />
expressed as<br />
n<br />
B<br />
Pe<br />
(1.6)<br />
2<br />
where n B may vary from 0 to perhaps 20 when polymeric materials are extruded near the critical<br />
stress for sharksk<strong>in</strong>. For a Newtonian fluid the value for n B is 0.587.<br />
<strong>The</strong> Bagley corrected shear stress becomes<br />
w<br />
Pcap<br />
+ Pe<br />
w =<br />
(1.7)<br />
L <br />
2 + nB<br />
R <br />
To apply the Bagley correction, measurements with at least two capillaries are needed.<br />
<strong>The</strong> shear th<strong>in</strong>n<strong>in</strong>g behavior is frequently expressed by the power-law model<br />
n -1<br />
= m <br />
(1.8)<br />
5
where m is the consistency and n the power-law exponent. For n = 1, the Newtonian model<br />
(constant viscosity) is obta<strong>in</strong>ed. <strong>The</strong> smaller the value <strong>of</strong> n, the more shear-th<strong>in</strong>n<strong>in</strong>g the polymer.<br />
<strong>The</strong> usual range <strong>of</strong> power-law exponent values is between 0.8 (for PC) and 0.2 (for rubber<br />
compounds). For various grades <strong>of</strong> PE, the range is 0.3 < n < 0.6. <strong>The</strong> consistency has values <strong>in</strong><br />
the usual range <strong>of</strong> 1000 Pas n (some PET res<strong>in</strong>s) to 100,000 Pas n for highly viscous rigid PVC.<br />
This power-law model gives a good fit <strong>of</strong> viscosity data at high shear rates but not at low shear<br />
rates (because as goes to zero, the viscosity goes to <strong>in</strong>f<strong>in</strong>ity).<br />
An approximate calculation <strong>of</strong> both m and n can be carried out by us<strong>in</strong>g two values <strong>of</strong> the<br />
melt <strong>in</strong>dex (MI and HLMI). MI refers to standard weight <strong>of</strong> 2.16 kg and HLMI to “High Load”<br />
melt <strong>in</strong>dex (frequently 10 kg or 21.6 kg). By manipulat<strong>in</strong>g the appropriate equations for pressure<br />
drop, shear stress and flow rate, we have [1]:<br />
log( HL) log( LL )<br />
Power law exponent n <br />
log( HLMI ) log( MI )<br />
8982 (<br />
LL )<br />
Consistency m <br />
n<br />
1838<br />
<br />
MI <br />
<br />
(1.9)<br />
where LL is the standard load (usually 2.16 kg) and HL the high load (usually 10 kg or 21.6 kg).<br />
range:<br />
Two other models are frequently used for better fitt<strong>in</strong>g <strong>of</strong> data over the entire shear rate<br />
Carreau-Yasuda<br />
<br />
<br />
n-1<br />
a<br />
= 1 + ( ) a<br />
(1.10)<br />
o<br />
where o is the viscosity at zero shear and , a, and n are fitted parameters.<br />
Cross model<br />
<br />
o<br />
1 + ( )<br />
=<br />
1-n<br />
(1.11)<br />
where o is the zero shear viscosity and and n are fitted parameters.<br />
With rotational viscometers (cone-and-plate or parallel plate), the shear stress is<br />
determ<strong>in</strong>ed from the applied torque and the shear rate from the rotational speed and the gap<br />
where the fluid is sheared.<br />
Capillary viscometers are usually used for the shear rate range from about 2 s –1 to<br />
perhaps 3000 s –1 . Rotational viscometers are usually used for the range 10 –2 to about 5 s –1 . At<br />
higher rotational speeds, secondary flows and <strong>in</strong>stabilities may occur which <strong>in</strong>validate the simple<br />
6
shear assumption. For more <strong>in</strong>formation about viscosity measurements, the reader is referred to<br />
Macosko [2].<br />
<strong>The</strong> viscosity <strong>of</strong> polymer melts varies with temperature <strong>in</strong> an exponential manner<br />
= ref<br />
exp (- b T)<br />
(1.12)<br />
<strong>The</strong> value <strong>of</strong> the temperature sensitivity coefficient b ranges from about 0.01 to 0.1 °C -1 . For<br />
common grades <strong>of</strong> polyolef<strong>in</strong>s, we may assume that b = 0.015. This means that for a<br />
temperature <strong>in</strong>crease T = 10°C (18°F), the viscosity decreases by 14%.<br />
<strong>The</strong> effects <strong>of</strong> various factors on viscosity are summarized <strong>in</strong> Figure 1.5 follow<strong>in</strong>g<br />
Cogswell [3]. L<strong>in</strong>ear narrow molecular weight distribution polymers (e.g. metallocenes) are<br />
more viscous than their broad distribution counterparts. Fillers may <strong>in</strong>crease viscosity (greatly).<br />
Pressure results <strong>in</strong> an <strong>in</strong>crease <strong>in</strong> viscosity (negligible under usual extrusion conditions). Various<br />
additives are available and are designed to decrease viscosity. <strong>The</strong> zero shear viscosity <strong>in</strong>creases<br />
dramatically with the weight average molecular weight:<br />
3.4<br />
= const Mw<br />
(1.13)<br />
o<br />
For some metallocene PE with long cha<strong>in</strong> branch<strong>in</strong>g, the exponent might be much higher<br />
(perhaps 6.0).<br />
In the above discussion <strong>of</strong> viscosity measurements, the assumption is made that the noslip<br />
condition on the die wall is valid. This is, however, not always the case. In fact, at shear<br />
stress levels <strong>of</strong> about 0.1 MPa for PE, slip occurs. Wall slip is related to the sharksk<strong>in</strong><br />
phenomenon [5]. Wall slip is measured by the Mooney method [6] <strong>in</strong> which the apparent shear<br />
rate (4Q / R 3 ) is plotted aga<strong>in</strong>st 1/R for several capillaries hav<strong>in</strong>g different radii. In the absence<br />
<strong>of</strong> slip, the plot is horizontal. <strong>The</strong> slope <strong>of</strong> the l<strong>in</strong>e is equal to 4 (slip velocity).<br />
1.2 Extensional Viscosity and Melt Strength<br />
Extensional (or elongational) viscosity is the resistance <strong>of</strong> a fluid to extension. While it is<br />
difficult to imag<strong>in</strong>e stretch<strong>in</strong>g <strong>of</strong> a low viscosity fluid like water, polymer melts exhibit<br />
measurable amounts <strong>of</strong> resistance. In fact, about 100 years ago, Trouton measured the resistance<br />
to stretch<strong>in</strong>g and shear<strong>in</strong>g <strong>of</strong> stiff liquids, <strong>in</strong>clud<strong>in</strong>g pitch, and found that the ratio <strong>of</strong> extensional<br />
to shear viscosity is equal to 3.<br />
e<br />
= 3<br />
<br />
(1.14)<br />
This relation, known as the Trouton ratio, is valid for all Newtonian fluids and has a<br />
rigorous theoretical basis besides Trouton's experiments.<br />
7
Figure 1.5. <strong>The</strong> <strong>in</strong>fluence <strong>of</strong> various parameters on polymer viscosity.<br />
Figure 1.6. Extensional and shear viscosity as a function <strong>of</strong> stretch and shear rate, respectively.<br />
8
Measurement <strong>of</strong> elongational viscosity is considerably more difficult than measurement<br />
<strong>of</strong> shear viscosity. One <strong>of</strong> the devices used <strong>in</strong>volves extrusion from a capillary and subsequent<br />
stretch<strong>in</strong>g with the help <strong>of</strong> a pair <strong>of</strong> rollers. <strong>The</strong> maximum force required to break the extruded<br />
strand is referred to as melt strength. In practice, the terms extensional viscosity and melt<br />
strength are sometimes confused. Extensional viscosity is a function <strong>of</strong> the stretch rate ( ), as<br />
shown <strong>in</strong> Figure 1.6, and compared to the shear viscosity. Melt strength is more <strong>of</strong> an<br />
eng<strong>in</strong>eer<strong>in</strong>g measure <strong>of</strong> resistance to extension. Several extrusion processes <strong>in</strong>volve extension,<br />
such as film blow<strong>in</strong>g, melt sp<strong>in</strong>n<strong>in</strong>g and sheet or film draw<strong>in</strong>g. <strong>The</strong> stretch rates <strong>in</strong> film blow<strong>in</strong>g<br />
can exceed 10 s –1 , while <strong>in</strong> entry flows from a large reservoir <strong>in</strong>to a smaller diameter capillary,<br />
the maximum stretch rate is likely to be one order <strong>of</strong> magnitude lower than the maximum wall<br />
shear rate (e.g. <strong>in</strong> capillary viscometry, approximately <br />
max<br />
100 s -1 for <br />
max<br />
1000 s -1 ).<br />
Frequently the extensional viscosity is plotted as a function <strong>of</strong> stretch<strong>in</strong>g time (<strong>in</strong>creas<strong>in</strong>g)<br />
without reach<strong>in</strong>g a steady value (stra<strong>in</strong> harden<strong>in</strong>g).<br />
<strong>The</strong> excess pressure encountered <strong>in</strong> flow from a large reservoir to a smaller diameter<br />
capillary is due to elongational viscosity. In fact, Cogswell [3] has developed a method for<br />
measurement <strong>of</strong> elongational viscosity e from excess pressure drop P e (i.e., the Bagley<br />
correction):<br />
9( n 1) Pe<br />
e<br />
<br />
2<br />
32<br />
2<br />
4<br />
at <br />
3( n 1) P<br />
2<br />
<br />
<br />
e<br />
2<br />
(1.15)<br />
Shear and extensional viscosity measurements reveal that LLDPE (which is l<strong>in</strong>ear) is<br />
"stiffer" than LDPE (branched) <strong>in</strong> shear, but "s<strong>of</strong>ter" <strong>in</strong> extension. In extension, the l<strong>in</strong>ear<br />
LLDPE cha<strong>in</strong>s slide by without gett<strong>in</strong>g entangled. However, the long branches <strong>of</strong> the LDPE<br />
cha<strong>in</strong>s result <strong>in</strong> significantly larger resistance <strong>in</strong> extension. In the film blow<strong>in</strong>g process, LDPE<br />
bubbles exhibit more stability because <strong>of</strong> their high extensional viscosity. Typical LDPE and<br />
LLDPE behavior <strong>in</strong> shear and extension is shown <strong>in</strong> Figure 1.7. LDPE is <strong>of</strong>ten blended with<br />
LLDPE to improve the melt strength and consequently bubble stability <strong>in</strong> film blow<strong>in</strong>g. Most PP<br />
grades are known to exhibit very low melt strength. However, recent advances <strong>in</strong> polymer<br />
chemistry have led to the production <strong>of</strong> some high-melt-strength PP grades.<br />
1.3 Normal Stresses and Extrudate Swell<br />
Stress is def<strong>in</strong>ed as force divided by the area on which it acts. It has units <strong>of</strong> lb f /<strong>in</strong> 2 (psi)<br />
<strong>in</strong> the British system or N/m 2 (Pascal, Pa) <strong>in</strong> SI. When a force is act<strong>in</strong>g tangentially on a surface,<br />
the correspond<strong>in</strong>g stress is referred to as shear stress. When a force is perpendicular (normal) to<br />
a surface, it is termed normal stress. Pressure is a normal stress. When a fluid is forced to flow<br />
through a conduit, it is acted upon by the normal (pressure) forces and it exerts both normal and<br />
shear (stress) forces on the conduit walls. For flow through a planar die as shown <strong>in</strong> Figure 1.2,<br />
the shear stress is zero at the midplane and maximum at the wall, while the correspond<strong>in</strong>g<br />
velocity pr<strong>of</strong>ile is quasi-parabolic. Weissenberg discovered <strong>in</strong> the 1940s that polymer solutions<br />
9
Figure 1.7. Schematic representation <strong>of</strong> LDPE and LLDPE behavior <strong>in</strong> shear and extension.<br />
Figure 1.8. (a) Rod climb<strong>in</strong>g (Weissenberg) effect <strong>in</strong> polymeric fluids, (b) extrudate swell.<br />
11
and melts, when subjected to shear<strong>in</strong>g, tend to develop normal stresses that are unequal <strong>in</strong> the x<br />
(direction <strong>of</strong> flow), y and z (normal directions). But, why are these elusive forces generated<br />
Because the flow process results <strong>in</strong> anisotropies <strong>in</strong> the microstructure <strong>of</strong> the long molecular<br />
cha<strong>in</strong>s <strong>of</strong> polymers. Any further explanation <strong>of</strong> the physical orig<strong>in</strong> <strong>of</strong> normal stresses is likely to<br />
be controversial. Here is perhaps an oversimplification: shear<strong>in</strong>g means motion <strong>of</strong> a fluid <strong>in</strong> a<br />
slice-by-slice manner. If the imag<strong>in</strong>ary slices were made <strong>of</strong> an extensible elastic material (like<br />
slices <strong>of</strong> rubber), shear<strong>in</strong>g would also result <strong>in</strong> extension <strong>in</strong> the flow direction and uneven<br />
compression <strong>in</strong> the other two directions. So, when an (elastic) polymer solution or melt is forced<br />
to flow, it is less compressed <strong>in</strong> the direction <strong>of</strong> flow than <strong>in</strong> the other two normal directions.<br />
<strong>The</strong> so-called First Normal Stress Difference N 1 is def<strong>in</strong>ed as the normal stress <strong>in</strong> the<br />
direction <strong>of</strong> the flow ( xx<br />
) m<strong>in</strong>us the perpendicular ( <br />
yy<br />
)<br />
<strong>The</strong> Second Normal Stress Difference is<br />
N 1 = xx -<br />
yy<br />
(1.16)<br />
N 2 = yy-<br />
zz<br />
(1.17)<br />
Experiments show that N 1 is positive for usual polymers (i.e. extensive, while the compressive<br />
pressure forces are negative). N 2 is negative and <strong>of</strong> the order <strong>of</strong> 20% <strong>of</strong> N 1 for most common<br />
polymers.<br />
<strong>The</strong> normal stress differences can be very large <strong>in</strong> high-shear-rate extrusion. Some<br />
authors suggest a variation for the normal stress difference at the wall <strong>in</strong> the form<br />
N b 1w<br />
= A w<br />
(1.18)<br />
<strong>The</strong> stress ratio<br />
N<br />
1w<br />
S R =<br />
(1.19)<br />
2 w<br />
can reach a value <strong>of</strong> 10 or more at the onset <strong>of</strong> melt fracture.<br />
<strong>The</strong> rod-climb<strong>in</strong>g (Weissenberg) effect observed (Figure 1.8 (a)) when a cyl<strong>in</strong>der rotates<br />
<strong>in</strong> a polymeric liquid is due to some sort <strong>of</strong> "strangulation" force exerted by the extended<br />
polymer cha<strong>in</strong>s, which results <strong>in</strong> an upward movement normal to the direction <strong>of</strong> rotation<br />
(normal stress difference). <strong>The</strong> extrudate swell phenomenon [7] (see Figure 1.8 (b)) is due<br />
ma<strong>in</strong>ly to the contraction <strong>of</strong> exit<strong>in</strong>g polymer that is under extension <strong>in</strong> the die. <strong>The</strong> uneven<br />
compression <strong>in</strong> the various directions results <strong>in</strong> a number <strong>of</strong> unusual flow patterns and<br />
<strong>in</strong>stabilities. <strong>The</strong> secondary flow patterns observed by Dooley and co-workers [8] are due to the<br />
second normal stress difference. Bird et al. [9] <strong>in</strong> their book state: "A fluid that's<br />
macromolecular is really quite weird, <strong>in</strong> particular the big normal stresses the fluid possesses<br />
give rise to effects quite spectacular."<br />
12
<strong>The</strong> phenomenon <strong>of</strong> extrudate swell (also known as die swell) has been studied by several<br />
researchers. While the primary mechanism is release <strong>of</strong> normal stresses at the exit, other effects<br />
are also important. <strong>The</strong> amount <strong>of</strong> swell is largest for zero length dies (i.e. orifices). It decreases<br />
for the same throughput with the length <strong>of</strong> the die due to fad<strong>in</strong>g memory as the residence time <strong>in</strong><br />
the die <strong>in</strong>creases. Even Newtonian fluids exhibit some swell upon exit<strong>in</strong>g dies (13% for round<br />
extrudates, 19% for planar extrudates). This is due to streaml<strong>in</strong>e rearrangement at the exit. <strong>The</strong><br />
amount <strong>of</strong> swell can be <strong>in</strong>fluenced by thermal effects due to viscosity differences between the<br />
walls and center <strong>of</strong> a die. Maximum thermal swell can be obta<strong>in</strong>ed when a hot polymer flows<br />
through a die hav<strong>in</strong>g colder walls. Swell ratio <strong>of</strong> about 5% on top <strong>of</strong> other mechanisms can be<br />
obta<strong>in</strong>ed from temperature differences.<br />
Several attempts have been made to predict extrudate swell numerically through<br />
equations relat<strong>in</strong>g the swell ratio d/D (extrudate diameter / die diameter) to the first normal stress<br />
difference at the wall N 1w . Based on the theory <strong>of</strong> rubber elasticity, the follow<strong>in</strong>g is obta<strong>in</strong>ed [7]<br />
N<br />
4<br />
2<br />
d d<br />
1w<br />
2 <br />
w 3<br />
2<br />
3<br />
1<br />
2<br />
<br />
<br />
<br />
<br />
(1.20)<br />
D D <br />
<br />
<br />
<br />
Based on stress release for a Maxwell fluid exit<strong>in</strong>g from a die, Tanner’s equation applies [7]<br />
N<br />
6<br />
d <br />
1w<br />
2 2 w <br />
0.13<br />
1<br />
1<br />
2<br />
<br />
<br />
<br />
(1.21)<br />
<br />
D <br />
Although Equation 1.21 has a more rigorous derivation and theoretical basis, the rubber<br />
elasticity theory (Equation 1.20) gives better predictions.<br />
1.4 Stress Relaxation and Dynamic Measurements<br />
After cessation <strong>of</strong> flow, the stresses become immediately zero for small molecule<br />
(Newtonian) fluids like water or glycer<strong>in</strong>. For polymer melts, the stresses decay exponentially<br />
after cessation <strong>of</strong> flow. Stress relaxation can be measured <strong>in</strong> a parallel plate or a cone-and-plate<br />
rheometer by apply<strong>in</strong>g a given shear rate level (rotation speed/gap) and measur<strong>in</strong>g the stress<br />
decay after the rotation is brought to an abrupt stop. Such tests, however, are not performed<br />
rout<strong>in</strong>ely because <strong>of</strong> experimental limitations.<br />
Dynamic measurements <strong>in</strong>volve the response <strong>of</strong> a material to an imposed s<strong>in</strong>usoidal<br />
stress or stra<strong>in</strong> on a parallel plate or cone-and-plate <strong>in</strong>strument. A perfectly elastic material that<br />
behaves like a steel spr<strong>in</strong>g, by imposition <strong>of</strong> extension (stra<strong>in</strong>), would develop stresses that<br />
would be <strong>in</strong>-phase with the stra<strong>in</strong>, because<br />
τ<br />
γ<br />
stress = modulus (G) stra<strong>in</strong><br />
(1.22)<br />
13
However, for a Newtonian fluid subjected to a s<strong>in</strong>usoidal stra<strong>in</strong>, the stress and stra<strong>in</strong> will not be<br />
<strong>in</strong>-phase because <strong>of</strong> the time derivative (stra<strong>in</strong> rate) <strong>in</strong>volved<br />
= <br />
(1.23)<br />
d d<br />
= = ( <br />
o<br />
s<strong>in</strong> t)= <br />
o<br />
d t d<br />
= s<strong>in</strong> ( t + 90)<br />
o<br />
cos t<br />
(1.24)<br />
where is frequency <strong>of</strong> oscillation. That is, a Newtonian fluid would exhibit 90 phase<br />
difference between stress and stra<strong>in</strong>. <strong>Polymer</strong>ic liquids that are partly viscous and partly elastic<br />
(viscoelastic) will be 0 90 out <strong>of</strong> phase.<br />
We can def<strong>in</strong>e<br />
storage<br />
<strong>in</strong> - phasestress<br />
G' ω<br />
=<br />
modulus<br />
(1.25)<br />
maximum stra<strong>in</strong><br />
(elastic part)<br />
loss<br />
out - <strong>of</strong> - phasestress<br />
G" ω<br />
=<br />
modulus<br />
(1.26)<br />
maximum stra<strong>in</strong><br />
(viscous part)<br />
where ranges usually from 0.01 to 10 3 rad/s. Larger G implies more elasticity. Further, we<br />
can def<strong>in</strong>e<br />
G"<br />
' = thedynamic viscosity<br />
(1.27)<br />
<br />
G<br />
" =<br />
<br />
(1.28)<br />
and the magnitude <strong>of</strong> the complex viscosity<br />
*<br />
1/ 2<br />
2 2<br />
| | =( <br />
+ "<br />
)<br />
(1.29)<br />
An empirical relationship called the "Cox-Merz rule" states that the shear rate<br />
dependence <strong>of</strong> the steady state viscosity is equal to the frequency dependence <strong>of</strong> the complex<br />
viscosity * , that is<br />
( ) = | * ( ) |<br />
(1.30)<br />
14
<strong>The</strong> usefulness <strong>of</strong> this rule, which holds for most polymers, is that while steady measurements <strong>of</strong><br />
shear viscosity are virtually impossible above 5 s –1 with rotational <strong>in</strong>struments, the dynamic<br />
measurements can easily be carried out up to 500 rad/s (corresponds to = 500 s –1 ) or even<br />
higher. Thus, the full range <strong>of</strong> viscosity needed <strong>in</strong> extrusion can be covered.<br />
Some typical results <strong>in</strong>volv<strong>in</strong>g narrow and broad molecular-weight-distribution samples<br />
are shown <strong>in</strong> Figure 1.9. <strong>The</strong> relative behavior <strong>of</strong> G versus can be used to identify whether a<br />
sample is <strong>of</strong> narrow or broad molecular weight distribution [6]. In fact, from the "crossover<br />
po<strong>in</strong>t" where G = G, it is possible to get a surpris<strong>in</strong>gly good estimate <strong>of</strong> the polydispersity<br />
M w /M n for PP [10].<br />
1.5 Constitutive Equations<br />
<strong>The</strong>se are relations between stresses and stra<strong>in</strong>s (deformations). In its simplest form, the<br />
Newtonian equation is<br />
where is viscosity and = du/dy, the shear rate.<br />
fluid<br />
For a shear th<strong>in</strong>n<strong>in</strong>g material <strong>of</strong> the power-law type, we have<br />
where m is consistency and n the power-law exponent.<br />
= <br />
(1.31)<br />
n-1<br />
n<br />
= = m = m <br />
(1.32)<br />
However, the above expressions, when <strong>in</strong>serted <strong>in</strong>to the equation <strong>of</strong> conservation <strong>of</strong><br />
momentum, cannot predict viscoelastic effects such as normal stresses, stress relaxation or<br />
extrudate swell. <strong>The</strong> simplest way to develop viscoelastic constitutive equations is to comb<strong>in</strong>e a<br />
model for an elastic solid<br />
with that for a Newtonian fluid<br />
= G <br />
(1.33)<br />
solid<br />
= <br />
flui d<br />
(1.34)<br />
By differentiat<strong>in</strong>g Equation 1.33 and add<strong>in</strong>g the two stra<strong>in</strong> rates, we get<br />
or<br />
<br />
+ = <br />
G <br />
(1.35)<br />
15
Figure 1.9. Storage modulus G and dynamic viscosity * behavior <strong>of</strong> broad and narrow<br />
molecular weight distribution polymers.<br />
Figure 1.10. Reptation model <strong>of</strong> polymer cha<strong>in</strong> motion.<br />
16
= has dimensions <strong>of</strong> time (relaxation constant).<br />
G<br />
<br />
+ = <br />
(1.36)<br />
G<br />
+ = <br />
(1.37)<br />
This is known as the Maxwell model. Viscoelastic models must be expressed <strong>in</strong> three<br />
dimensions and <strong>in</strong> a proper mathematical frame <strong>of</strong> reference that moves and deforms with the<br />
fluid. <strong>The</strong> result is a very complicated expression <strong>in</strong>volv<strong>in</strong>g dozens <strong>of</strong> derivatives [11,12].<br />
<strong>The</strong> most powerful constitutive equation is the so-called K-BKZ <strong>in</strong>tegral model that<br />
<strong>in</strong>volves more than two dozen experimentally fitted parameters (see, for example: Mitsoulis<br />
[13]). Current trends <strong>in</strong>volve the development <strong>of</strong> models based on macromolecular motions. De<br />
Gennes proposed the snake-like motion <strong>of</strong> polymer cha<strong>in</strong>s called reptation, illustrated <strong>in</strong> Figure<br />
1.10. Based on the reptation concept, Doi and Edwards [2] developed a constitutive equation<br />
which leaves much to be desired before it can be used for prediction <strong>of</strong> viscoelastic flow<br />
phenomena. Several attempts have been made to fix the Doi-Edwards theory. <strong>The</strong> most<br />
prom<strong>in</strong>ent researcher <strong>in</strong> the area is G. Marrucci (see, for example: Marrucci and Ianniruberto<br />
[14]).<br />
<strong>The</strong> most talked about viscoelastic model recently is the Pom-Pom polymer model,<br />
developed by T.C.B. McLeish and R.G. Larson [15]. <strong>The</strong> motivation for its development was<br />
that the K-BKZ equation fails to predict the observed degree <strong>of</strong> stra<strong>in</strong> harden<strong>in</strong>g <strong>in</strong> planar<br />
extension when the kernel functions are adjusted to fit the observed degree <strong>of</strong> stra<strong>in</strong> s<strong>of</strong>ten<strong>in</strong>g <strong>in</strong><br />
shear. <strong>The</strong> failure to describe the rheology <strong>of</strong> long-cha<strong>in</strong> branched polymers suggests that some<br />
new molecular <strong>in</strong>sight is needed <strong>in</strong>to the nonl<strong>in</strong>ear relaxation processes that occur <strong>in</strong> such melts<br />
under flow. <strong>The</strong> Pom-Pom model uses an H-polymer structure, <strong>in</strong> which molecules conta<strong>in</strong> just<br />
two branch po<strong>in</strong>ts <strong>of</strong> chosen functionality – a “backbone” which l<strong>in</strong>ks two pom-poms <strong>of</strong> q arms<br />
each, as shown <strong>in</strong> Figure 1.11.<br />
<strong>The</strong> Pom-Pom model exhibits rheological behavior remarkably similar to that <strong>of</strong><br />
branched commercial melts like LDPE. It shows stra<strong>in</strong> harden<strong>in</strong>g <strong>in</strong> extension and stra<strong>in</strong><br />
s<strong>of</strong>ten<strong>in</strong>g <strong>in</strong> shear. It can describe both planar and uniaxial extension. <strong>The</strong> constitutive equation<br />
is <strong>in</strong>tegro-differential. For successful application at least 32 parameters must be obta<strong>in</strong>ed by<br />
fitt<strong>in</strong>g experimental rheological data. Of course, best fitt<strong>in</strong>g 32 or more parameters <strong>of</strong> a<br />
complicated constitutive equation is a mathematical challenge <strong>of</strong> its own.<br />
Model<strong>in</strong>g <strong>of</strong> the viscoelastic behavior <strong>of</strong> polymers has always been a very controversial<br />
subject. <strong>The</strong> viscoelastic constitutive equations have contributed towards the understand<strong>in</strong>g <strong>of</strong><br />
the various mechanisms <strong>of</strong> deformation and flow, but unfortunately have not provided us with<br />
quantitative predictive power. Very <strong>of</strong>ten the predictions depend on the model used for the<br />
computations and are not corroborated with experimental observations. Some viscoelastic flow<br />
problems can be solved with the appropriate constitutive equations, but this is still an area <strong>of</strong><br />
academic research with limited practical applications at the moment.<br />
17
Figure 1.11. Pom-Pom polymer model idealized molecules.<br />
Figure 1.12. LLDPE extrudates obta<strong>in</strong>ed from a capillary at apparent shear rates <strong>of</strong> 37, 112, 750<br />
and 2250 s -1 .<br />
18
1.6 Sharksk<strong>in</strong>, Melt Fracture and Die Lip Build-Up<br />
<strong>The</strong> term sharksk<strong>in</strong> refers to the phenomenon <strong>of</strong> loss <strong>of</strong> surface gloss <strong>of</strong> an extrudate, also<br />
sometimes termed surface mattness. <strong>The</strong> surface usually exhibits a repetitious wavy or ridged<br />
pattern perpendicular to the flow direction. It occurs at a critical stress level <strong>of</strong> at least 0.14 MPa<br />
(21 psi) for most common polymers extruded through capillary dies. With some additives,<br />
lubricants, process<strong>in</strong>g aids or die coat<strong>in</strong>gs, the onset <strong>of</strong> sharksk<strong>in</strong> can be shifted to a higher shear<br />
stress level, with values up to 0.5 MPa be<strong>in</strong>g reported.<br />
<strong>The</strong> prevail<strong>in</strong>g po<strong>in</strong>t <strong>of</strong> view is that sharksk<strong>in</strong> orig<strong>in</strong>ates near the die exit and is due to<br />
stick-slip phenomena. A critical shear stress near the exit <strong>in</strong> conjunction with a critical<br />
acceleration results <strong>in</strong> sk<strong>in</strong> rupture <strong>of</strong> the extrudate [16,17]. <strong>The</strong>re was some disagreement over<br />
whether slip between the polymer and the die wall causes or helps avoid sharksk<strong>in</strong> [18].<br />
However, it is now believed that it is slip which helps to postpone sharksk<strong>in</strong> to higher flow rates.<br />
Good adherence is also thought to be potentially beneficial, but stick-slip is always detrimental.<br />
M<strong>in</strong>ute amounts <strong>of</strong> (expensive) fluorocarbon polymers are used as process<strong>in</strong>g aids with<br />
LLDPE. <strong>The</strong> proposed mechanism is that they deposit on the die surface and allow cont<strong>in</strong>uous<br />
slip. More recently boron nitride has been <strong>in</strong>troduced for the same purpose [19]. Other remedies<br />
for postpon<strong>in</strong>g the onset <strong>of</strong> sharksk<strong>in</strong> to higher throughput rates <strong>in</strong>volve reduc<strong>in</strong>g the wall shear<br />
stress by heat<strong>in</strong>g the die lips to reduce the polymer viscosity and by modify<strong>in</strong>g the die exit to<br />
<strong>in</strong>clude a small exit angle (flar<strong>in</strong>g).<br />
At higher throughput rates, extrudates usually become highly distorted and the pressure<br />
<strong>in</strong> a capillary viscometer shows significant fluctuations. This phenomenon is known as gross<br />
melt fracture.<br />
Figure 1.12 shows LLDPE extrudates for <strong>in</strong>creas<strong>in</strong>g shear rates, illustrat<strong>in</strong>g the<br />
progression from smooth surface to sharksk<strong>in</strong> and then melt fracture [20]. It is possible with<br />
some polymers to obta<strong>in</strong> melt fractured extrudates without sharksk<strong>in</strong>, i.e. the surface rema<strong>in</strong>s<br />
smooth and glossy but overall the extrudate is distorted.<br />
Proposed mechanisms for melt fracture <strong>in</strong>clude entry flow vortex <strong>in</strong>stability, elastic<br />
<strong>in</strong>stability dur<strong>in</strong>g flow <strong>in</strong> the die land for stress ratios greater than about 10 (see Equation 1.19),<br />
stick-slip phenomena and other <strong>in</strong>teractions between the polymer and the metal die wall.<br />
Probably more than one mechanism is responsible.<br />
Die lip build-up (also known as die drool) refers to the gradual formation <strong>of</strong> an <strong>in</strong>itially<br />
liquid deposit at the edge <strong>of</strong> the die exit which solidifies and grows and may partially obstruct<br />
the flow <strong>of</strong> the extruded product and/or cause defective extrudate surface. Depend<strong>in</strong>g on the<br />
severity <strong>of</strong> the problem, cont<strong>in</strong>uous extrusion must be <strong>in</strong>terrupted every few hours or days and<br />
the solid deposit removed from the die lips. <strong>The</strong> causative mechanisms are not really known.<br />
Observations suggest that the formation <strong>of</strong> die lip build-up is not cont<strong>in</strong>uous but <strong>in</strong>termittent.<br />
T<strong>in</strong>y droplets <strong>of</strong> material come out <strong>of</strong> the die or perhaps from a ruptur<strong>in</strong>g extrudate surface.<br />
Some studies suggest that the build-up is rich <strong>in</strong> lower molecular weight polymer fractions,<br />
waxes and other additives [21].<br />
19
Remedies for reduc<strong>in</strong>g die lip build-up <strong>in</strong>clude repair<strong>in</strong>g miss<strong>in</strong>g plat<strong>in</strong>g and surface<br />
imperfections from die lips, remov<strong>in</strong>g moisture from the feed material, lower<strong>in</strong>g the extrudate<br />
temperature and add<strong>in</strong>g stabilizer to the res<strong>in</strong>. Fluorocarbon process<strong>in</strong>g aids will sometimes also<br />
be helpful, as they are with sharksk<strong>in</strong>. <strong>The</strong> melt fracture remedy <strong>of</strong> small die exit angles (flar<strong>in</strong>g)<br />
is also known to reduce build-up, for polyethylenes and polycarbonate.<br />
1.7 Rheological Problems <strong>in</strong> Coextrusion<br />
1.7.1 Layer-To-Layer Non-Uniformity<br />
Layer non-uniformity <strong>in</strong> coextrusion flows is caused ma<strong>in</strong>ly by the tendency <strong>of</strong> the less<br />
viscous polymer to go to the region <strong>of</strong> high shear (i.e. the wall) thereby produc<strong>in</strong>g encapsulation.<br />
Figure 1.13 illustrates this phenomenon for rod and slit dies [22]. Complete encapsulation is<br />
possible for extremely long dies (this is not encountered <strong>in</strong> coextrusion practice). Differences <strong>in</strong><br />
wall adhesion and viscoelastic characteristics <strong>of</strong> polymers are also contribut<strong>in</strong>g factors. Weak<br />
secondary flows caused by viscoelastic effects (from the second normal stress difference) have<br />
been demonstrated to produce layer non-uniformities even <strong>in</strong> coextrusion <strong>of</strong> different colored<br />
streams <strong>of</strong> the same polymer [23]. Reduction <strong>of</strong> this defect can be achieved by choos<strong>in</strong>g<br />
materials with the smallest possible differences <strong>in</strong> viscosity and viscoelasticity (G, G, extrudate<br />
swell), or by chang<strong>in</strong>g the stream temperatures to br<strong>in</strong>g the polymer viscosities closer to one<br />
another.<br />
Layer non-uniformity can also arise <strong>in</strong> feedblock cast film coextrusion, <strong>in</strong> which melt<br />
streams are merged <strong>in</strong>to a s<strong>in</strong>gle stream <strong>in</strong> a feedblock prior to enter<strong>in</strong>g the flat die for form<strong>in</strong>g.<br />
Uneven flow leakage from the flat die manifold to the downstream sections <strong>of</strong> the die can lead to<br />
encapsulation <strong>of</strong> the more viscous polymer by the less viscous, or even the reverse! <strong>The</strong><br />
technique <strong>of</strong> feedblock pr<strong>of</strong>il<strong>in</strong>g is used to counteract the natural tendency for encapsulation<br />
from viscosity differences. This <strong>in</strong>volves contour<strong>in</strong>g the feedblock flow passages for regions <strong>of</strong><br />
high or low volumetric throughput, as shown <strong>in</strong> Figure 1.14. Feedblock pr<strong>of</strong>il<strong>in</strong>g comb<strong>in</strong>ed with<br />
elim<strong>in</strong>ation <strong>of</strong> uneven flow leakage from the feed<strong>in</strong>g section <strong>of</strong> a flat die (or the use <strong>of</strong> this<br />
leakage to counteract the natural tendency for encapsulation) can be used to produce layer-tolayer<br />
uniformity <strong>in</strong> the extrudate. <strong>The</strong> problem is much more complex <strong>in</strong> coextrusion <strong>of</strong> many<br />
layers, as pr<strong>of</strong>il<strong>in</strong>g for one layer will disrupt the other layers. <strong>The</strong> <strong>in</strong>fluence <strong>of</strong> a feedblock design<br />
change is virtually impossible to predict at present, even with the use <strong>of</strong> the most powerful 3-D<br />
f<strong>in</strong>ite element flow simulation packages on powerful supercomputers.<br />
1.7.2 Interfacial Instability<br />
Interfacial <strong>in</strong>stability <strong>in</strong> coextrusion refers to two common types <strong>of</strong> defects consist<strong>in</strong>g <strong>of</strong><br />
highly irregular or sometimes regular wav<strong>in</strong>ess which appears <strong>in</strong> coextruded structures at the<br />
polymer/polymer <strong>in</strong>terface. <strong>The</strong> effect is to significantly reduce the optical quality <strong>of</strong> coextruded<br />
film. It is an <strong>in</strong>ternal defect, which dist<strong>in</strong>guishes it from sharksk<strong>in</strong>, which is a surface defect.<br />
20
Figure 1.13. Layer-to-layer flow rearrangement as a function <strong>of</strong> time.<br />
Figure 1.14. Feedblock pr<strong>of</strong>il<strong>in</strong>g and the resultant effects.<br />
21
<strong>The</strong> most frequently encountered type <strong>of</strong> <strong>in</strong>terfacial <strong>in</strong>stability is zig-zag (also known as<br />
die-land) <strong>in</strong>stability, which appears as chevrons po<strong>in</strong>t<strong>in</strong>g <strong>in</strong> the flow direction. It is <strong>in</strong>itiated <strong>in</strong><br />
the die land and is characterized by a critical <strong>in</strong>terfacial shear stress, <strong>in</strong> the range <strong>of</strong> 30 kPa to 80<br />
kPa (roughly ¼ to ½ <strong>of</strong> the critical wall shear stress level for sharksk<strong>in</strong>). Figure 1.15 shows the<br />
effect <strong>of</strong> this <strong>in</strong>stability on film clarity [24]. This problem can arise even if adjacent layers are <strong>of</strong><br />
the same material. <strong>The</strong> mechanism responsible has not been conclusively identified. Apparently<br />
there is amplification <strong>of</strong> certa<strong>in</strong> disturbance wavelengths under high stress conditions [25].<br />
Viscoelasticity is probably a contribut<strong>in</strong>g factor, i.e. the value <strong>of</strong> <strong>in</strong>terfacial normal stress<br />
difference is important. Unfortunately this is impossible to measure and difficult to calculate<br />
accurately. <strong>The</strong> most reliable means <strong>of</strong> diagnos<strong>in</strong>g zig-zag <strong>in</strong>stability at present is to calculate<br />
<strong>in</strong>terfacial shear stress us<strong>in</strong>g simulation s<strong>of</strong>tware.<br />
Zig-zag <strong>in</strong>stability problems are remedied by reduc<strong>in</strong>g <strong>in</strong>terfacial shear stresses. <strong>The</strong><br />
follow<strong>in</strong>g actions are beneficial:<br />
decrease the total output rate (this reduces stresses everywhere)<br />
<strong>in</strong>crease the sk<strong>in</strong> layer thickness (this will shift the <strong>in</strong>terface away from the wall<br />
where the shear stress is maximum)<br />
decrease the viscosity <strong>of</strong> the sk<strong>in</strong> layer, i.e. by rais<strong>in</strong>g its temperature or by us<strong>in</strong>g a<br />
less viscous polymer (this reduces stresses everywhere)<br />
<strong>in</strong>crease the die gap (this reduces stresses everywhere)<br />
Viscosity match<strong>in</strong>g <strong>of</strong> layers is a popular remedy that does NOT always work. In fact, as<br />
recommended above, it is <strong>of</strong>ten advisable to <strong>in</strong>tentionally mismatch the viscosities by us<strong>in</strong>g a<br />
low viscosity res<strong>in</strong> for the sk<strong>in</strong> layer.<br />
<strong>The</strong> less common type <strong>of</strong> <strong>in</strong>terfacial <strong>in</strong>stability is “wave” pattern <strong>in</strong>stability, which<br />
appears as a tra<strong>in</strong> <strong>of</strong> parabolas spann<strong>in</strong>g the width <strong>of</strong> the sheet and oriented <strong>in</strong> the flow direction.<br />
It occurs when a fast mov<strong>in</strong>g polymer stream merges with a much slower mov<strong>in</strong>g stream <strong>in</strong> a<br />
coextrusion feedblock. When the sk<strong>in</strong> layer is th<strong>in</strong> relative to the second layer (i.e. the skew <strong>of</strong><br />
the coextruded structure is small), the wave <strong>in</strong>stability can be more pronounced. Large<br />
differences <strong>in</strong> extensional viscosities between adjacent layers can also make the defect more<br />
likely, as can large extensional viscosity <strong>of</strong> the sk<strong>in</strong> layer. <strong>The</strong> <strong>in</strong>stability is aggravated by<br />
whatever flow or geometrical asymmetries might be present <strong>in</strong> the feedblock and die. As well,<br />
dies with larger lateral expansion ratios (die lip width divided by manifold entry width) and<br />
longer channel lengths (from feed slot vanes to die manifold) are more susceptible [26].<br />
1.8 Troubleshoot<strong>in</strong>g With the Help <strong>of</strong> <strong>Rheology</strong><br />
Rheological measurements (viscosity, elongational viscosity, G and G) can be used for<br />
(a) material characterization, (b) determ<strong>in</strong>ation <strong>of</strong> processability, and (c) as <strong>in</strong>put data for<br />
computer simulations [1].<br />
In material characterization, rheology has an advantage over other methods because <strong>of</strong> its<br />
sensitivity to certa<strong>in</strong> aspects <strong>of</strong> the structure such as the high molecular weight tail and<br />
branch<strong>in</strong>g. Also, <strong>in</strong> many <strong>in</strong>stances, rheological characterization can be a lot faster than other<br />
methods such as GPC.<br />
22
Figure 1.15. <strong>The</strong> effect <strong>of</strong> <strong>in</strong>terfacial <strong>in</strong>stability on contact clarity <strong>of</strong> coextruded films (top)<br />
versus see-through clarity (bottom).<br />
Figure 1.16. Simulation prediction <strong>of</strong> pressure build-up <strong>in</strong> extruder.<br />
23
With careful rheological measurements, it is possible to determ<strong>in</strong>e whether, or under<br />
what conditions, a material will be processable. Blend ratios, or additive quantities necessary to<br />
facilitate process<strong>in</strong>g can be determ<strong>in</strong>ed. Many problems can be avoided by a thorough<br />
rheological characterization, before the material is <strong>in</strong>troduced <strong>in</strong>to the extruder hopper. For the<br />
relative benefits <strong>of</strong> on-l<strong>in</strong>e, <strong>in</strong>-l<strong>in</strong>e or <strong>of</strong>f-l<strong>in</strong>e rheometry, the reader is referred to Kelly et al.<br />
[27].<br />
Rheological measurements are absolutely necessary as <strong>in</strong>put for computer simulations.<br />
<strong>The</strong> viscosity must be measured over the shear rate range that is anticipated <strong>in</strong> the real process,<br />
and then fitted to a proper model (power-law, Carreau-Yasuda or Cross). Figure 1.16 shows a<br />
prediction <strong>of</strong> pressure build-up <strong>in</strong> an extruder made us<strong>in</strong>g viscosity data [28]. Other<br />
measurements are necessary, whenever viscoelastic simulations are undertaken.<br />
<strong>Rheology</strong> is used for troubleshoot<strong>in</strong>g purposes <strong>in</strong> a great variety <strong>of</strong> situations. Here are<br />
some frequently encountered ones:<br />
Processability <strong>of</strong> material A versus material B. A frequently asked question from rheology<br />
consultants is: "Materials A and B have the same Melt Index (MI), virtually identical viscosity<br />
curves and virtually identical molecular weight distributions (measured by Gel Permeation<br />
Chromatography (GPC)). Yet, they behave very differently <strong>in</strong> extrusion through the same<br />
mach<strong>in</strong>e. Why" <strong>The</strong> reason is that processability is <strong>of</strong>ten determ<strong>in</strong>ed by small amounts <strong>of</strong> high<br />
molecular weight fractions or branch<strong>in</strong>g which are not detectable by conventional GPC methods<br />
and do not cause any measurable differences <strong>in</strong> MI or the viscosity curve. To detect the<br />
differences it is recommended that G and G be determ<strong>in</strong>ed and compared. Occasionally, first<br />
normal stress difference measurements (N 1 ) might be necessary, and s<strong>in</strong>ce these are difficult and<br />
expensive, extrudate swell measurements are recommended. Larger G, N 1 or extrudate swell<br />
implies the presence <strong>of</strong> a higher-molecular-weight tail. For process<strong>in</strong>g <strong>in</strong>volv<strong>in</strong>g extension<br />
(blown film, melt sp<strong>in</strong>n<strong>in</strong>g, sheet and film draw<strong>in</strong>g), measurements <strong>of</strong> extensional viscosity (or<br />
melt strength) are recommended.<br />
F<strong>in</strong>al product properties are poor. <strong>The</strong>se may <strong>in</strong>clude impact resistance, optics, warpage,<br />
brittleness, etc. Aga<strong>in</strong>, rheological measurements may have to be carried out on samples from<br />
the raw material and from the f<strong>in</strong>al product for comparison purposes. This is aimed at detect<strong>in</strong>g<br />
any degradation or other modification that might have occurred dur<strong>in</strong>g extrusion.<br />
Material is prone to sharksk<strong>in</strong>. Determ<strong>in</strong>e the viscosity <strong>of</strong> material at the process<strong>in</strong>g temperature<br />
(<strong>in</strong> the lip region). Materials that are not very shear th<strong>in</strong>n<strong>in</strong>g are prone to sharksk<strong>in</strong> at relatively<br />
low throughput rates. To reduce shear stress, <strong>in</strong>crease die temperature or use additives that<br />
promote slippage (e.g. fluorocarbon polymers).<br />
Bubble <strong>in</strong>stability <strong>in</strong> film blow<strong>in</strong>g. One <strong>of</strong> the causes might be low melt strength <strong>of</strong> the material.<br />
Measure extensional viscosity and/or melt strength. Compare with other materials that show<br />
better bubble stability. Choose a higher melt strength material. <strong>Inc</strong>rease cool<strong>in</strong>g to lower bubble<br />
temperature and thereby <strong>in</strong>crease melt strength.<br />
24
Draw resonance <strong>in</strong> melt sp<strong>in</strong>n<strong>in</strong>g or draw<strong>in</strong>g <strong>of</strong> cast film. Draw resonance refers to periodic<br />
diameter or thickness variation. Low-elasticity materials are more prone to this type <strong>of</strong><br />
<strong>in</strong>stability. Measure G and choose more elastic res<strong>in</strong> grades (higher G).<br />
Poor blend<strong>in</strong>g <strong>of</strong> two polymers. When the viscosity difference between two polymers to be<br />
blended is large (say, over five times), blend<strong>in</strong>g is difficult because the shear stress exerted by<br />
the matrix on the higher viscosity dispersed phase is not large enough to cause breakup. Use a<br />
matrix <strong>of</strong> higher viscosity or an extensional flow mixer [1].<br />
1.9 Conclud<strong>in</strong>g Remarks<br />
<strong>Polymer</strong> res<strong>in</strong>s are frequently sold on the basis <strong>of</strong> density and Melt Index (MI).<br />
However, MI is only just one po<strong>in</strong>t on an (apparent) viscosity curve. Plastics extrusion <strong>in</strong>volves<br />
shear rates usually up to 1000 s –1 , and viscosity measurements are called for to determ<strong>in</strong>e the<br />
shear th<strong>in</strong>n<strong>in</strong>g behavior. For the analysis <strong>of</strong> some processes, knowledge <strong>of</strong> extensional viscosity<br />
and/or melt strength may be needed. <strong>The</strong> level <strong>of</strong> elasticity is <strong>in</strong>dicated by the normal stress<br />
differences and dynamic modulus measurements (G and G.<br />
<strong>Rheology</strong> is an excellent tool for materials characterization and miscellaneous<br />
troubleshoot<strong>in</strong>g purposes. However, understand<strong>in</strong>g <strong>of</strong> the problem is absolutely necessary for<br />
the successful application <strong>of</strong> rheological methods for p<strong>in</strong>po<strong>in</strong>t<strong>in</strong>g the root causes <strong>of</strong> various<br />
extrusion defects.<br />
25
1.10 References<br />
1. J. Vlachopoulos and J.R. Wagner (eds.), <strong>The</strong> SPE Guide on <strong>Extrusion</strong> Technology and<br />
Troubleshoot<strong>in</strong>g, Society <strong>of</strong> Plastics Eng<strong>in</strong>eers, Brookfield CT (2001).<br />
2. C.W. Macosko, <strong>Rheology</strong>: Pr<strong>in</strong>ciples, Measurements and Applications, VCH Publishers,<br />
New York (1994).<br />
3. F.N. Cogswell, <strong>Polymer</strong> Melt <strong>Rheology</strong>, Woodhead Publish<strong>in</strong>g, Cambridge, England (1996).<br />
4. A.V. Chenoy and D.R. Sa<strong>in</strong>i, <strong>The</strong>rmoplastic Melt <strong>Rheology</strong> and Process<strong>in</strong>g, Marcel Dekker,<br />
New York (1996).<br />
5. S.G. Hatzikiriakos, Polym. Eng. Sci., 34, 1441 (1994).<br />
6. J.M. Dealy and K.F. Wissbrun, Melt <strong>Rheology</strong> and Its <strong>Role</strong> <strong>in</strong> Plastics Process<strong>in</strong>g, Chapman<br />
and Hall, London (1996).<br />
7. J. Vlachopoulos, Rev. Def. Beh. Mat., 3, 219 (1981).<br />
8. B. Debbaut, T. Avalosse, J. Dooley, and K. Hughes, J. Non-Newt. Fluid Mech., 69, 255<br />
(1997).<br />
9. R.B. Bird, R.C. Armstrong, and O. Hassager, Dynamics <strong>of</strong> <strong>Polymer</strong>ic Liquids, Vol. I, Wiley,<br />
New York (1987).<br />
10. S.W. Shang, Adv. Polym. Tech., 12, 389 (1993).<br />
11. R.I. Tanner, Eng<strong>in</strong>eer<strong>in</strong>g <strong>Rheology</strong>, Oxford Eng<strong>in</strong>eer<strong>in</strong>g Science, Oxford, England (2000).<br />
12. D.G. Baird and D.J. Collias, <strong>Polymer</strong> Process<strong>in</strong>g Pr<strong>in</strong>ciples and Design, Wiley, New York<br />
(1998).<br />
13. E. Mitsoulis, J. Non-Newt. Fluid Mech., 97, 13 (2001).<br />
14. G. Marrucci and G. Ianniruberto, J. Rheol., 47, 247 (2003).<br />
15. T.C.B. McLeish and R.G. Larson, J. Rheol., 42, 81 (1998).<br />
16. R. Rutgers and M. Mackley, J. Rheol., 44, 1319 (2000).<br />
17. M.M. Denn, Ann. Rev. Fluid Mech., 33, 265 (2001).<br />
18. A.V. Ramamurthy, Proceed<strong>in</strong>gs <strong>of</strong> Xth Intl. Cong. Rheo., Sydney (1988).<br />
19. E.C. Achilleos, G. Georgiou and S.G. Hatzikiriakos, J. V<strong>in</strong>yl Addit. Techn., 8, 7 (2002).<br />
20. R. H. Moynihan, PhD thesis, Dept. <strong>of</strong> Chem. Eng., Virg<strong>in</strong>ia Tech. (1990).<br />
21. J.D. Gander and J. Giacom<strong>in</strong>, Polym. Eng. Sci., 37, 1113 (1997).<br />
22. N. M<strong>in</strong>agawa and J.L. White, Polym. Eng. Sci., 15, 825 (1975).<br />
23. J. Dooley, PhD thesis, U. E<strong>in</strong>dhoven, Netherlands (2002).<br />
24. R. Shr<strong>of</strong>f and H. Mavridis, Plas. Tech., 54 (1991).<br />
25. J. Perdikoulias and C. Tzoganakis, Plas. Eng., 52, #4, 41 (1996).<br />
26. R. Ramanathan, R. Shanker, T. Rehg, S. Jons, D.L. Headley and W.J. Schrenk, SPE ANTEC<br />
Tech. Papers, 42, 224 (1996).<br />
27. A.L. Kelly, M. Woodhead, R.M. Rose, and P.D. Coates, SPE ANTEC Tech. Papers, 45,<br />
1979 (1999).<br />
28. NEXTRUCAD, <strong>Polydynamics</strong>, <strong>Inc</strong>., http://www.polydynamics.com.<br />
26