Places & Spaces: Cartography of Physical Places and Abstract ...
Places & Spaces: Cartography of Physical Places and Abstract ...
Places & Spaces: Cartography of Physical Places and Abstract ...

Create successful ePaper yourself
Turn your PDF publications into a flip-book with our unique Google optimized e-Paper software.
<strong>Places</strong> & <strong>Spaces</strong>: <strong>Cartography</strong> <strong>of</strong> <strong>Physical</strong> <strong>Places</strong> <strong>and</strong> <strong>Abstract</strong> <strong>Spaces</strong><br />
A Science Exhibit<br />
Description <strong>of</strong> the Exhibit<br />
Compiled by Dr. Katy Börner & Elisha F. Hardy<br />
School <strong>of</strong> Library <strong>and</strong> Information Science, Indiana University<br />
10th Street & Jordan Avenue, Bloomington, IN 47405, USA<br />
E-mail: katy@indiana.edu & efhardy@indiana.edu<br />
June 2009<br />
Table <strong>of</strong> Contents:<br />
1. Exhibit Goals: ................................................................................................................................................................... 2<br />
2. Exhibit Components:........................................................................................................................................................ 3<br />
2.1 The first iteration: the Power <strong>of</strong> Maps ..................................................................................................................... 3<br />
2.2 The second iteration: the Power <strong>of</strong> Reference Systems.......................................................................................... 3<br />
2.3 The third iteration: the Power <strong>of</strong> Forecasts.............................................................................................................. 4<br />
2.4 The fourth iteration: Science Maps for Economic Decision Makers..................................................................... 4<br />
2.5 Additional Elements.................................................................................................................................................. 5<br />
3. <strong>Physical</strong> Exhibit................................................................................................................................................................ 6<br />
4. Web Site............................................................................................................................................................................ 6<br />
5. Video & Enhanced Podcast ............................................................................................................................................. 6<br />
6. Reading List..................................................................................................................................................................... 7<br />
7. Local Organization ........................................................................................................................................................... 7<br />
8. Contact Information ......................................................................................................................................................... 7<br />
References ............................................................................................................................................................................. 8<br />
Appendix: Technical Specifications.................................................................................................................................... 9<br />
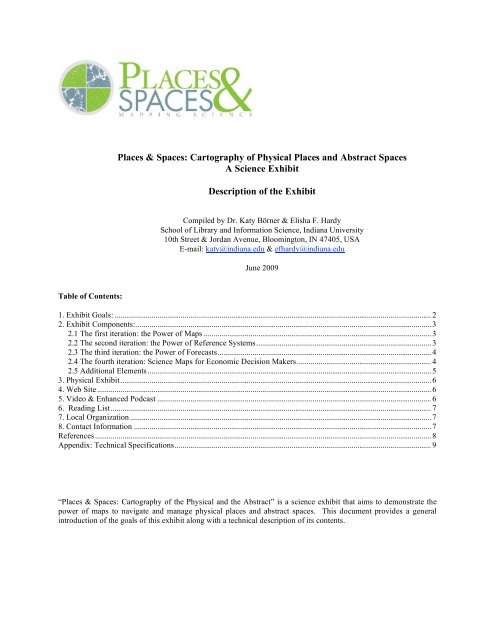
“<strong>Places</strong> & <strong>Spaces</strong>: <strong>Cartography</strong> <strong>of</strong> the <strong>Physical</strong> <strong>and</strong> the <strong>Abstract</strong>” is a science exhibit that aims to demonstrate the<br />
power <strong>of</strong> maps to navigate <strong>and</strong> manage physical places <strong>and</strong> abstract spaces. This document provides a general<br />
introduction <strong>of</strong> the goals <strong>of</strong> this exhibit along with a technical description <strong>of</strong> its contents.
1. Exhibit Goals:<br />
Humanity’s knowledge <strong>and</strong> our means to share it are increasing at an accelerating rate. Yet, our perceptual <strong>and</strong><br />
cognitive abilities stay nearly constant. We are expected to know more works than we could possibly read <strong>and</strong><br />
underst<strong>and</strong> in a hundred lifetimes. As a consequence, experts become highly specialized <strong>and</strong> isolated. Science<br />
continues to fragment, to duplicate, <strong>and</strong> to re-invent itself.<br />
Today, we use search engines to access all <strong>of</strong> humanity’s knowledge <strong>and</strong> expertise. Search engines retrieve facts<br />
from a growing sea <strong>of</strong> information. However, how big is this sea How can we efficiently navigate to the useful<br />
isl<strong>and</strong>s <strong>of</strong> knowledge How is knowledge interlinked on a global scale In which areas is it worth investing<br />
resources We don’t know.<br />
It is not the first time mankind has faced this type <strong>of</strong> question. However, it is the first time that there is an<br />
opportunity to coordinate efforts across cultures <strong>and</strong> disciplines to provide answers.<br />
Cartographic maps <strong>of</strong> physical places have guided mankind’s explorations for centuries. They enabled the discovery<br />
<strong>of</strong> new worlds while also marking territories inhabited by unknown monsters. Without maps, we would be lost.<br />
Domain maps <strong>of</strong> abstract semantic spaces (Börner et al 2003, Shiffrin & Börner 2004) aim to serve today’s explorers<br />
navigating the world <strong>of</strong> science. These maps are generated through scientific analysis <strong>of</strong> large-scale scholarly<br />
datasets in an effort to connect <strong>and</strong> make sense <strong>of</strong> the bits <strong>and</strong> pieces <strong>of</strong> knowledge they contain. They can be used<br />
to objectively identify major research areas, experts, institutions, collections, grants, papers, journals, <strong>and</strong> ideas in a<br />
domain <strong>of</strong> interest. Local maps provide overviews <strong>of</strong> a specific area: its homogeneity, import-export factors, <strong>and</strong><br />
relative speed. They allow one to track the emergence, evolution, <strong>and</strong> disappearance <strong>of</strong> topics <strong>and</strong> help to identify<br />
the most promising areas <strong>of</strong> research.<br />
Figure 1: <strong>Places</strong> <strong>and</strong> <strong>Spaces</strong> at the 101st Annual Meeting <strong>of</strong> the Association <strong>of</strong> American Geographers,<br />
Denver, CO (left), the i-Light Symposium, Indianapolis, IN (middle) <strong>and</strong> the ESRI International User Conference,<br />
San Diego, CA (right).<br />
The <strong>Places</strong> & <strong>Spaces</strong> exhibit has been created to demonstrate the power <strong>of</strong> maps. The exhibit has two components:<br />
the physical part supports the close inspection <strong>of</strong> high quality reproductions for display at conferences <strong>and</strong> education<br />
centers (Figure 1). It is meant to inspire cross-disciplinary discussions on how to best track <strong>and</strong> communicate<br />
human activity <strong>and</strong> scientific progress on a global scale. The online counterpart at http://scimaps.org/ provides links<br />
to a selected series <strong>of</strong> maps <strong>and</strong> their makers along with detailed explanations <strong>of</strong> why these maps work. It also has<br />
the schedule <strong>of</strong> physical showings as well as information on the <strong>Places</strong> & <strong>Spaces</strong> Advisory Board.<br />
<strong>Places</strong> & <strong>Spaces</strong> was first shown at the Annual Meeting <strong>of</strong> the Association <strong>of</strong> American Geographers in April 2005.<br />
Since then, the physical exhibit has been displayed at more than 50 national <strong>and</strong> international venues including the<br />
Abdus Salam International Centre for Theoretical Physics (ICTP) Trieste, Italy, the Santa Fe Institute <strong>and</strong> the Los<br />
Alamos National Laboratory in New Mexico, the Information Visualization Conference, London, UK, the 10th<br />
International Conference <strong>of</strong> the International Society for Scientometrics <strong>and</strong> Informetrics, Stockholm, Sweden, the<br />
ESRI International User Conference in San Diego, CA, the First International Wikimedia Conference in Frankfurt<br />
am Main, Germany, the ESRI DC Office, Vienna, Virginia, the Annual Meeting <strong>of</strong> the Society for Social Studies <strong>of</strong><br />
Sciences in Pasadena, CA, the National Center for Supercomputing Applications (NCSA) in Urbana-Champaign, IL,
<strong>and</strong> the National Institute <strong>of</strong> Informatics, Tokyo, Japan. The complete schedule <strong>and</strong> images <strong>of</strong> the different exhibits<br />
are available at http://scimaps.org/schedule.php.<br />
Visitors <strong>of</strong> the exhibit are surprised to see their own field <strong>of</strong> research from a height <strong>of</strong> 10,000 feet, they are interested<br />
to learn more about the data <strong>and</strong> techniques that went into creating these maps, <strong>and</strong> their comments on the different<br />
metaphors that might be used to map the structure <strong>and</strong> evolution <strong>of</strong> science are invaluable for the design <strong>of</strong> more<br />
efficient visualizations.<br />
The <strong>Places</strong> & <strong>Spaces</strong>: Mapping Science exhibit is envisioned as a 10 year exhibit. Each year 10 new maps are added,<br />
resulting in 100 maps total by 2014.<br />
2. Exhibit Components:<br />
2.1 The First Iteration: The Power <strong>of</strong> Maps <strong>of</strong> this exhibit compares <strong>and</strong> contrasts the first maps <strong>of</strong> our entire<br />
planet with the first maps <strong>of</strong> all <strong>of</strong> science as we know it. Both types <strong>of</strong> maps were/are not perfectly correct. As for<br />
the maps <strong>of</strong> science, we know that we don’t yet have the data to map science completely <strong>and</strong> accurately. Yet, maps<br />
do help people orient <strong>and</strong> navigate physical places <strong>and</strong> semantic spaces, see Figure 2.<br />
Figure 2: <strong>Places</strong> <strong>and</strong> <strong>Spaces</strong>: The First Iteration<br />
2.2 The Second Iteration: The Power <strong>of</strong> Reference Systems aims to inspire discussion about a common reference<br />
system for all <strong>of</strong> mankind’s scientific knowledge. Scientists in many disciplines battled to agree on st<strong>and</strong>ardized<br />
reference systems such as the electromagnetic spectrum, the periodic table <strong>of</strong> elements, geographic mappings, <strong>and</strong><br />
the celestial reference systems shown here. These st<strong>and</strong>ardized systems are invaluable for indexing, storing,<br />
accessing, <strong>and</strong> managing scientific data efficiently. Note that each <strong>of</strong> the six potential reference systems— from the<br />
one-dimensional time-based system to the geospatial system to the semantic system—could be used potentially to<br />
identify the “location” <strong>of</strong> an author, paper, patent, or grant, or to show the dynamics <strong>of</strong> an author’s trajectory or<br />
contribution, as well as the impact <strong>of</strong> a particular work. All reference systems need to be learned. However, once<br />
they are learned, they may be used as a ‘base map,’ or common reference point, over which information may be laid,<br />
see Figure 3.
Figure 3: <strong>Places</strong> <strong>and</strong> <strong>Spaces</strong>: The Second Iteration<br />
2.3 The Third Iteration: The Power <strong>of</strong> Forecasts explores the idea <strong>of</strong> forecasting science. The inspiration for this<br />
series <strong>of</strong> maps is the development <strong>of</strong> weather forecasting maps. Just as it is possible to map past trends in weather<br />
<strong>and</strong> to use these to predict future weather patterns, we believe it will eventually be possible to map future trends in<br />
scientific research, see Figure 4.<br />
Figure 4: <strong>Places</strong> <strong>and</strong> <strong>Spaces</strong>: The Third Iteration<br />
2.4 The Fourth Iteration: Science Maps for Economic Decision Makers. This is the first <strong>of</strong> six iterations that<br />
explore the utility <strong>of</strong> science maps for different stakeholders. The maps presented here target the needs <strong>of</strong> economic<br />
decision makers, see Figure 5.<br />
Figure 5: <strong>Places</strong> <strong>and</strong> <strong>Spaces</strong>: The Fourth Iteration
They aim to answer questions such as: What is the impact <strong>of</strong> war on global trade flows How do accelerating<br />
communication <strong>and</strong> transportation speeds impact our lives What events <strong>and</strong> time lags occur from basic research to<br />
product sale What are the (social) networks behind illicit deals <strong>and</strong> laundered money What intellectual property<br />
space is claimed by whom <strong>and</strong> what growth is expected What is the ecological footprint <strong>of</strong> a country <strong>and</strong> how<br />
sustainable is it How does the ‘Product Space’ determine the economic development <strong>of</strong> nations How to visually<br />
empower strategy formation <strong>and</strong> value creation in organizations How are publications linked to patents in different<br />
areas <strong>of</strong> science What factors impact the happiness <strong>of</strong> citizens <strong>and</strong> which countries do well<br />
2.5 Fifth Iteration (2009)Science Maps for Science Policy Makers. The fifth iteration shows science maps for<br />
science policy makers as well as citizens interested in underst<strong>and</strong>ing national priorities, spending, <strong>and</strong> achievements.<br />
Featured are two early maps, two maps <strong>of</strong> observation <strong>and</strong> sensor data, <strong>and</strong> six maps <strong>of</strong> scholarly data. See Figure 6.<br />
Figure 6: <strong>Places</strong> <strong>and</strong> <strong>Spaces</strong>: The Fifth Iteration<br />
The maps communicate:<br />
1. The steady increase <strong>of</strong> scientists in the total population, versus a decline <strong>of</strong> R&D investment as a<br />
fraction <strong>of</strong> GNP.<br />
2. Categories for evaluating <strong>and</strong> comparing evolving scientific collaboration.<br />
3. Needed changes in the Boston Traffic Separation Scheme to reduce the risk <strong>of</strong> ships striking whales.<br />
4. Urban mobility patterns to improve the design <strong>and</strong> management <strong>of</strong> cities.<br />
5. The U.S. federal discretionary budget.<br />
6. Return on investment for U.S. chemistry R&D including a timeline <strong>and</strong> investment cycles.<br />
7. Funding portfolios <strong>of</strong> the National Institutes <strong>of</strong> Health.<br />
8. The structure <strong>of</strong> science based on download (rather than publication) activity.<br />
9. Research leadership <strong>of</strong> the U.S. compared with the top 12 competitive nations.<br />
10. Progress towards the Millennium Development Goals to be achieved in 2015.<br />
The 2010 iteration <strong>of</strong> the exhibit will present science maps for scholars.<br />
Five more iterations are planned:<br />
• Science Maps for Scholars (2010)<br />
• Science Maps as Visual Interfaces to Digital Libraries (2011)<br />
• Science Maps for Kids (2012)<br />
• Science Forecasts (2013)<br />
• How to Lie with Science Maps (2014)<br />
2.5 Additional Elements<br />
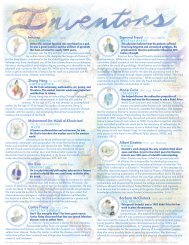
The exhibit also features three WORLDPROCESSOR Globes: Foreign US Patent Holders [Worldprocessor #294],<br />
Patterns <strong>of</strong> Patents & Zones <strong>of</strong> Invention [Worldprocessor #286] <strong>and</strong> the Shape <strong>of</strong> Science shown in Figure 6 (left),<br />
an Illuminated Diagram (ID) display, see Figure 6 (right), <strong>and</strong> H<strong>and</strong>s-On Science Maps for Kids, see Figure 12.<br />
Illuminated Diagrams add the flexibility <strong>of</strong> an interactive program to the incredibly high data density <strong>of</strong> a print. This<br />
technique is generally useful when there is too much pertinent data to be displayed on a screen but the data is
elatively stable. The computer can direct the eye to what’s important by using projectors as smart spotlights,<br />
animating stories in the static data (such as the spread <strong>of</strong> an idea’s influence), giving a radar-like “gr<strong>and</strong> tour” <strong>of</strong><br />
science, or highlighting query results (as when you touch the lectern) with an overlay <strong>of</strong> moving light. The ID lets<br />
visitors select major inventors <strong>and</strong> scientists <strong>and</strong> indicates their physical location on a map <strong>of</strong> our planet <strong>and</strong> their<br />
scientific contributions on a map <strong>of</strong> all <strong>of</strong> science. See video <strong>of</strong> the ID at http://scimaps.org/video/.<br />
Figure 6: Globe (left) <strong>and</strong> Illuminated Diagram display (right)<br />
H<strong>and</strong>s-On Science Maps for Kids were created by Fileve Palmer (painting), Julie Smith (data acquisition), Elisha<br />
Hardy <strong>and</strong> Katy Börner (graphic design). We would like to thank Stephen Miles Uzzo, Director <strong>of</strong> Technology <strong>and</strong><br />
Michael Lane, Director <strong>of</strong> Exhibit Services at the New York Hall <strong>of</strong> Science for manufacturing the physical maps.<br />
One map shows our world <strong>and</strong> the places where science gets done. The other shows major areas <strong>of</strong> science <strong>and</strong> their<br />
complex interrelationships. The maps invite children to see, explore, <strong>and</strong> underst<strong>and</strong> science from above. Both maps<br />
also appear in the Illuminated Diagram display, see Figure 6 (right). Drawings by Fileve Palmer were added to make<br />
different continents as well as different areas <strong>of</strong> science more tangible. Children <strong>and</strong> adults alike are invited to help<br />
solve the puzzle by sliding major scientists, inventors, <strong>and</strong> inventions into their proper places. Start by selecting<br />
either <strong>of</strong> the two maps. Decide if you want to place famous people or major inventions first. Turn the map over<br />
when you are done <strong>and</strong> start again. Look for the many hints hidden in the drawings to find the perfect place for each<br />
puzzle piece. Pick-up one <strong>of</strong> the h<strong>and</strong>outs <strong>and</strong> make your very own map <strong>of</strong> science. What science experiments do<br />
you like best Where would your favorite science teachers go What area <strong>of</strong> science do you want to explore next<br />
3. <strong>Physical</strong> Exhibit:<br />
The physical exhibit is comprised <strong>of</strong> an introductory panel, high resolution maps (40 maps in 2008, 50 maps in<br />
2009), three globes, Illuminated Diagrams, <strong>and</strong> two H<strong>and</strong>s-on Science Maps for Kids. The exhibit is shipped in six<br />
specially made crates, see Appendix.<br />
4. Web Site:<br />
The <strong>Places</strong> & <strong>Spaces</strong> web site is at http://scimaps.org. It provides information on the maps <strong>and</strong> their makers,<br />
compares <strong>and</strong> contrasts maps, lists upcoming venues, <strong>and</strong> provides information about the <strong>Places</strong> & <strong>Spaces</strong> advisory<br />
board.<br />
A customized web site is created for each specific venue, e.g., see NYPL site at http://scimaps.org/nypl/.<br />
5. Video & Enhanced Podcast:<br />
A video <strong>of</strong> the NYPL exhibit was recorded that features a walk through <strong>of</strong> the exhibit as well as interviews with<br />
major map makers. The video comes with the exhibit <strong>and</strong> it is available for sale at http://scimaps.org/video/.
An enhanced podcast <strong>of</strong> the exhibit is available at http://www.nyas.org/snc/podcasts.asp, posted May 12, 2006. It<br />
was meant to provide a guided tour <strong>of</strong> the NYPL exhibit.<br />
6. Reading List:<br />
A list <strong>of</strong> related scholarly works is available at http://scimaps.org/references.<br />
A book <strong>of</strong> the first three iterations <strong>of</strong> the exhibit entitled Atlas <strong>of</strong> Science: Guiding the Navigation <strong>and</strong> Management<br />
<strong>of</strong> Scholarly Knowledge will be published by ESRI in 2009. More information is available at<br />
http://scimaps.org/atlas/.<br />
7. Local Organization:<br />
Depending on the exhibit space some or all <strong>of</strong> the items listed below might need to be considered when the exhibit is<br />
invited.<br />
• Opening reception<br />
• Speaker series<br />
• H<strong>and</strong>outs, NYPL h<strong>and</strong>out is at http://www.nypl.org/research/calendar/exhib/sibl/siblexhibdesc.cfmid=421<br />
<strong>and</strong> the total for 2,000 brochures were printed for $4,800 at Colortech Graphics, 180 Varcik St. , New York,<br />
NY 10014, 212.243.0523.<br />
• Press releases, see NYPL release at<br />
http://www.nypl.org/research/calendar/exhib/sibl/siblexhibdesc.cfmid=421<br />
• Advertising posters or banners<br />
• Work station to access exhibit web site<br />
• Related books on display or for sale in near-by book stores, see reading list.<br />
• Television with DVD player to play the exhibit video<br />
8. Contact Information:<br />
If you are interested to host the exhibit or would like to receive more information, please contact the curators <strong>of</strong> the<br />
exhibit:<br />
Dr. Katy Börner<br />
Victor H. Yngve Associate Pr<strong>of</strong>essor <strong>of</strong> Information Science<br />
Cyberinfrastructure for Network Science Center<br />
School <strong>of</strong> Library <strong>and</strong> Information Science, Indiana University<br />
Wells Library 021, 10th Street & Jordan Avenue, Bloomington, IN 47405, USA<br />
E-mail: katy@indiana.edu<br />
Phone: (812) 855-3256<br />
Fax: (812) 855-6166<br />
Elisha F. Hardy<br />
Graphic Designer<br />
Cyberinfrastructure for Network Science Center<br />
School <strong>of</strong> Library <strong>and</strong> Information Science, Indiana University<br />
Wells Library 021, 10th Street & Jordan Avenue, Bloomington, IN 47405, USA<br />
E-mail: efhardy@indiana.edu<br />
Phone: (812) 856-7034<br />
Fax: (812) 855-6166<br />
We will be happy to work with you on an installation for your visitors <strong>and</strong> their information needs.
Exhibit Advisory Board Members<br />
• Deborah MacPherson, Director for the 501(c)(3) nonpr<strong>of</strong>it organization Accuracy & Aesthetics, Vienna<br />
VA.<br />
• Kevin Boyack, Principal Member <strong>of</strong> the Technical Staff in the Computation, Computers, <strong>and</strong> Mathematics<br />
Center at S<strong>and</strong>ia National Laboratories.<br />
• Sara Irina Fabrikant, Associate Pr<strong>of</strong>essor <strong>of</strong> Geography; Head <strong>of</strong> the Geographic Information<br />
Visualization <strong>and</strong> Analysis (GIVA) group, GIScience, University <strong>of</strong> Zurich, Switzerl<strong>and</strong>.<br />
• Peter A. Hook, doctoral student, Indiana University Bloomington & librarian at the Law School, Indiana<br />
University.<br />
• Andre Skupin, Assistant Pr<strong>of</strong>essor <strong>of</strong> Geography, San Diego State University.<br />
• Bonnie DeVarco, Senior Researcher for the NSF funded Interactive Earth 2 Project, led by WorldLink<br />
Media, TERC, NASA Goddard <strong>and</strong> the World Resources Institute (WRI).<br />
• Chaomei Chen, Associate Pr<strong>of</strong>essor, College <strong>of</strong> Information Science <strong>and</strong> Technology, Drexel University;<br />
Visiting Pr<strong>of</strong>essor in the School <strong>of</strong> Information Systems, Computing <strong>and</strong> Mathematics, Brunel University.<br />
• Dawn Wright, Pr<strong>of</strong>essor <strong>of</strong> Geography <strong>and</strong> Oceanography, Oregon State University.<br />
Further information can also be obtained from the <strong>Places</strong> & <strong>Spaces</strong> advisory board, see http://scimaps.org/connect/.<br />
References<br />
Börner K., Chen C., Boyack K. 2003. Visualizing Knowledge Domains. In Annual Review <strong>of</strong> Information Science &<br />
Technology, ed. B Cronin, pp. 179-255. Medford, NJ: Information Today, Inc./American Society for<br />
Information Science <strong>and</strong> Technology.<br />
Paley W. B. 2002. Illuminated Diagrams: Using Light <strong>and</strong> Print to Comparative Advantage. Presented at IEEE<br />
Information Visualization.<br />
Shiffrin R. M., Börner K., eds. 2004. Mapping Knowledge Domains, Vols. 101 (Suppl. 1): PNAS.
Appendix: Technical Specifications<br />
The museum quality maps are printed on premium luster paper in a size <strong>of</strong> 30” x 24”, see Figure 4 for a typical<br />
layout <strong>of</strong> a set <strong>of</strong> 10 maps. Maps can be ordered online via http://scimaps.org/ordermaps/. The maps that were on<br />
display at the New York Public Library (NYPL) have no physical frames. The visitor can see (<strong>and</strong> hopefully will not<br />
touch) the raw print. The maps currently on display at National Research Council in Ottawa, Canada are laminated.<br />
The globes have a diameter <strong>of</strong> 12” <strong>and</strong> a height <strong>of</strong> 5 feet that invites the ‘spinning’ <strong>of</strong> the globes by visitors.<br />
The IDs are comprised <strong>of</strong> two high resolution prints: the geo map at a size <strong>of</strong> 58.5” x 36.5” <strong>and</strong> the topic map at 42”<br />
x 43” <strong>and</strong> two identical, 200+ lumen, three LCD-projectors with redundant light source (dual bulbs). Note that DLP<br />
projectors are not acceptable due to their ‘rainbow halo’ effect when the eye scans, <strong>and</strong> single LCD projectors leave<br />
the screen image grainy. The projectors are positioned on a st<strong>and</strong> at a distance <strong>of</strong> about 2 meters from the diagrams.<br />
The platforms <strong>of</strong> the st<strong>and</strong>s are approximately 8' from the floor; the projector is inside; the top is 8" higher.<br />
The H<strong>and</strong>s-on Science Maps for Kids should be displayed on a table. They are 18” tall, 12” deep <strong>and</strong> about 33”<br />
wide.<br />
The exhibit is complete with an introductory panel that typically needs to be recreated for each venue as it also lists<br />
the changing set <strong>of</strong> (local) sponsors. Plus, there are didactic panels (one per iteration) <strong>and</strong> labels for all elements <strong>of</strong><br />
the exhibit. Panels <strong>and</strong> labels can be silk screened on the wall, mounted on foamcore, etc. The text for the panels<br />
<strong>and</strong> labels are provided in text form. They can be adapted to the venue.
Figure 7: Typical layout <strong>of</strong> 10 maps
Figure 8: St<strong>and</strong>ing Globes<br />
Figure 9: Wall Mounted Illuminated Displays
Figure 10: St<strong>and</strong>ing Projectors with Computer<br />
Figure 11: Lectern for the Illuminated Displays<br />
Figure 12: H<strong>and</strong>s-on Science Maps for Kids
Unpacking & Set up<br />
As seen below, the exhibit comes in several crates. All <strong>of</strong> these crates are specially designed for<br />
specific exhibit pieces. Crate 3 contains nothing but mounted maps from the 1 st <strong>and</strong> 2 nd iterations,<br />
while Crate 2 contains a mixture <strong>of</strong> Worldprocessor globes <strong>and</strong> the ‘maps’ used for the Illuminated<br />
Diagram displays.<br />
<strong>Places</strong> & <strong>Spaces</strong> Shipping Crates<br />
via The Exhibit Company<br />
March 9, 2007<br />
Crate # 1<br />
Dimensions: 50” x 44” x 42” (127cm x 112cm x 107cm)<br />
Weight: 310 Lbs (141 Kg)<br />
Contents:<br />
1 Touch panel podium<br />
2 Children’s Maps<br />
24 Map Labels<br />
22 Hanging cleats for Maps<br />
Crate # 2<br />
Dimensions: 60” x 57” x 31” (152cm x<br />
79cm)<br />
Weight: 375 Lbs (171 Kg)<br />
Contents:<br />
3 Worldprocessor Globes<br />
3 Globe Labels<br />
2 Mounted Illuminated Diagrams<br />
145cm x<br />
Crate # 3<br />
Dimensions: 72” x 36” x 30” (183cm x 91cm x 76cm)<br />
Weight: 280 Lbs (127 Kg)<br />
Contents:<br />
20 Maps<br />
4 Map Labels<br />
Crate # 4<br />
Dimensions: 102” x 41” x 35”<br />
(259cm x 104cm x 89cm)<br />
Weight: 565 Lbs (257 Kg)<br />
Contents:<br />
2 Projector St<strong>and</strong>s<br />
1 Cross Bar<br />
Crate # 5<br />
Dimensions: 27” x 26” x 22” (69cm x 66cm x 56cm)<br />
Weight: 146 Lbs (66.3 Kg)<br />
Contents:<br />
2 Projectors<br />
1 Computer<br />
1 Keyboard<br />
1 Computer mouse<br />
Computer <strong>and</strong> Electric Cables
Crate #6 (not pictured)<br />
45 3/8" long x 35" wide x 34 1/4" tall<br />
Contents: 10 maps / labels /cleats<br />
Crate #7 (not pictured)<br />
45 3/8" long x 35" wide x 34 1/4" tall<br />
Contents: 10 maps/ labels/ cleats<br />
Crate #8 (not pictured)<br />
45 3/8" long x 35" wide x 34 1/4" tall<br />
Contents: 10 maps/ labels/ cleats<br />
Total Crate Weight: 2000 lbs (estimated)<br />
Ideally, when unpacking the exhibit, you will have a preconceived vision <strong>of</strong> how the exhibit will use<br />
the available space at the new venue. Julie has done this every time the exhibit has traveled<br />
somewhere by asking for <strong>and</strong> getting the schematics for the exhibit space at the venue. The mounted<br />
maps <strong>of</strong> science are the most numerous, so getting them on the wall is the top priority.<br />
Needed materials for this job include:<br />
• Hammer (depending upon wall material)<br />
• Velcro (depending upon wall material)<br />
• Cordless Drill<br />
• Tape Measure<br />
• Level (laser if possible)<br />
• Screws or Nails<br />
• Wall mount blocks<br />
Itemized List <strong>of</strong> Exhibit Contents:<br />
1 Introduction Panel<br />
50 Wall Mounted Maps<br />
5 Compare <strong>and</strong> Contrast Panels<br />
3 Globes<br />
2 Kids’ Map Puzzles<br />
2 Wall Mounted Illuminated Diagram Displays<br />
2 Vidikron Projectors<br />
2 Projector St<strong>and</strong>s (connected by iron rod)<br />
1 Dell Precision 360 Computer & Cables<br />
1 Customized Lectern (with touch screen)<br />
56 Map Labels<br />
1 Video<br />
List <strong>of</strong> Insurable Items:<br />
1.) Insurable components <strong>of</strong> Illuminated Diagram Displays by contributing artist W. Bradford Paley<br />
2 Maps<br />
• $400 per map for a total <strong>of</strong> $800<br />
• $25 per map label for a total <strong>of</strong> $50
2 Vidikron Projectors<br />
• List price $12,000 each<br />
• Replacement value $4,000 each (by Canon Realis Sx-50)<br />
• Serial numbers: SL0340007, SL0160024<br />
1 Dell Precision 360 Computer & Cables<br />
• Replacement value $1,200 as configured<br />
• Serial number: CBXBK51<br />
1 Customized Lectern (with touch screen)<br />
• Replacement value approximately $500<br />
• Embedded Viewsonic VP201b monitor, s/n: A21034301217<br />
• Embedded MicroTouch touch screen, s/n: 587449<br />
Miscellaneous Cables<br />
• Replacement value approximately $500<br />
2 Projector St<strong>and</strong>s<br />
• Replacement value approximately $500<br />
2.) Insurable components <strong>of</strong> Worldprocessor Globes by contributing artist Ingo Günther<br />
3 Globes<br />
• $4,500 per globe for a total <strong>of</strong> $13,500<br />
• $25 per globe label for a total <strong>of</strong> $75<br />
3.) Insurable components <strong>of</strong> the 50 maps<br />
50 maps<br />
• $200 per map for a total <strong>of</strong> $10,000<br />
• $300 Introduction panel<br />
• $150 per Compare <strong>and</strong> Contrast panel for a total <strong>of</strong> $750<br />
• $25 per map label for 50 - a total <strong>of</strong> $1250<br />
• $14 for one exhibit video (DVD)<br />
4.) Insurable components <strong>of</strong> the h<strong>and</strong>s-on science maps for kids<br />
2 maps<br />
• $2000 per map for a total <strong>of</strong> $4000<br />
• $25 for map label