voyager observations of the diffuse far-ultraviolet radiation field
voyager observations of the diffuse far-ultraviolet radiation field
voyager observations of the diffuse far-ultraviolet radiation field

You also want an ePaper? Increase the reach of your titles
YUMPU automatically turns print PDFs into web optimized ePapers that Google loves.
The Astrophysical Journal Supplement Series, 199:11 (6pp), 2012 March<br />
Murthy, Henry, & Holberg<br />
Wavelength<br />
Table 5<br />
Voyager 1 Spectra<br />
Sequence<br />
(Å) 1 2 3 4 5 6<br />
539.46 0.0705 0.0035 −0.0233 0.0736 0.0189 −0.0231<br />
548.72 0.0651 0.0017 −0.0221 0.0642 0.0153 −0.0222<br />
557.98 0.0651 0.0017 −0.0221 0.0642 0.0153 −0.0222<br />
567.24 0.1307 0.0066 −0.0114 0.1062 0.0279 −0.0106<br />
576.50 0.1307 0.0066 −0.0114 0.1062 0.0279 −0.0106<br />
585.76 0.0507 0.0376 0.0736 0.0265 0.0040 0.0766<br />
595.02 0.0110 0.0343 0.0792 −0.0049 −0.0027 0.0756<br />
Notes. Sequence references <strong>the</strong> internal sequence number and may be crossreferenced<br />
between tables.<br />
(This table is available in its entirety in a machine-readable form in <strong>the</strong> online<br />
journal. A portion is shown here for guidance regarding its form and content.)<br />
Table 6<br />
Voyager 2 Spectra<br />
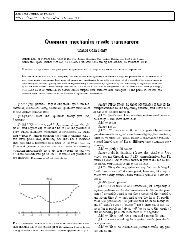
Figure 4. Voyager <strong>diffuse</strong> fluxes in units <strong>of</strong> photons cm −2 s −1 sr −1 Å −1 .The<br />
Galactic center is at <strong>the</strong> origin.<br />
(A color version <strong>of</strong> this figure is available in <strong>the</strong> online journal.)<br />
(a)<br />
Wavelength<br />
Sequence<br />
(Å) 834 835 836 837 838 839<br />
518.08 0.0039 −0.0291 0.0580 −0.0282 0.0356 −0.0336<br />
527.34 0.0034 −0.0242 0.0472 −0.0234 0.0268 −0.0277<br />
536.60 0.0034 −0.0242 0.0472 −0.0234 0.0268 −0.0277<br />
545.86 0.0009 −0.0183 0.0450 −0.0182 0.0497 −0.0225<br />
555.12 0.0009 −0.0183 0.0450 −0.0182 0.0497 −0.0225<br />
564.38 −0.0118 0.0367 −0.0058 0.0365 0.0513 0.0341<br />
573.64 −0.0226 0.0729 −0.0293 0.0733 0.0613 0.0698<br />
Notes. Sequence references <strong>the</strong> internal sequence number and may be crossreferenced<br />
between tables.<br />
(This table is available in its entirety in a machine-readable form in <strong>the</strong> online<br />
journal. A portion is shown here for guidance regarding its form and content.)<br />
Table 7<br />
Fits to Diffuse Voyager Signal<br />
(b)<br />
Sequence Chisq1 Bkgd1 ΔBkgd1 Chisq2 Bkgd2 ΔBkgd2<br />
(1) (2) (3) (4) (5) (6) (7)<br />
1 0.24 2616 200 1.92 3596 300<br />
2 0.89 272 220 0.88 470 340<br />
3 0.93 1206 180 0.61 2040 280<br />
4 1.63 1199 100 3.14 1664 150<br />
5 6.06 1856 80 1.86 3107 120<br />
6 2.17 1454 140 1.05 2524 210<br />
7 8.00 1584 70 1.76 2720 100<br />
8 10.20 1326 50 8.08 2117 70<br />
Notes. Column 1: internal sequence number; Column 2: Chisq for an O star<br />
template fit; Column 3: flux <strong>of</strong> <strong>the</strong> model fit at 1100 Å Column 4: 1σ error in<br />
<strong>the</strong> model fit; Column 5: Chisq for a B star template fit; Column 6: flux <strong>of</strong> <strong>the</strong><br />
model fit at 1100 Å; Column 7: 1σ error in <strong>the</strong> model fit.<br />
(This table is available in its entirety in a machine-readable form in <strong>the</strong> online<br />
journal. A portion is shown here for guidance regarding its form and content.)<br />
spectrum with both B star and O star templates (plotted in<br />
Figure 3) and tabulated <strong>the</strong> model fits in Table 7. Note that<br />
<strong>the</strong>se fits are only for illustrative purposes and do not imply that<br />
<strong>the</strong> <strong>radiation</strong> in any particular direction is due to dust-scattered<br />
starlight. There are also a number <strong>of</strong> <strong>observations</strong> <strong>of</strong> supernovae<br />
remnants with strong line emission, primarily from <strong>the</strong> C iii<br />
(977 Å) and O vi (1032/1038) lines as observed, for instance, in<br />
Vela (Blair et al. 1995). These, and o<strong>the</strong>r similar <strong>observations</strong>,<br />
will require follow-up.<br />
Figure 5. (a) Distribution <strong>of</strong> <strong>the</strong> Voyager observed brightness with galactic<br />
latitude. (b) Distribution <strong>of</strong> GALEX observed brightness with galactic latitude.<br />
In order to study <strong>the</strong> dust scattered <strong>radiation</strong>, we used those<br />
<strong>observations</strong> <strong>of</strong> greater than 10,000 s in exposure time and no<br />
obvious interstellar line emission: a total <strong>of</strong> 1518 <strong>observations</strong>.<br />
The background values at 1100 Å, or ra<strong>the</strong>r <strong>the</strong> best-fit model<br />
values at 1100 Å assuming a B star template, are plotted in<br />
Figure 4, highlighting both <strong>the</strong> faintest <strong>observations</strong><br />
(10,000 photons cm −2 s −1 sr −1 Å −1 ). Although <strong>the</strong> overall<br />
distribution <strong>of</strong> <strong>the</strong> <strong>diffuse</strong> background follows a cosecant<br />
law falling <strong>of</strong>f from <strong>the</strong> Galactic plane (Figure 5(a)), it is<br />
4