voyager observations of the diffuse far-ultraviolet radiation field
voyager observations of the diffuse far-ultraviolet radiation field
voyager observations of the diffuse far-ultraviolet radiation field

Create successful ePaper yourself
Turn your PDF publications into a flip-book with our unique Google optimized e-Paper software.
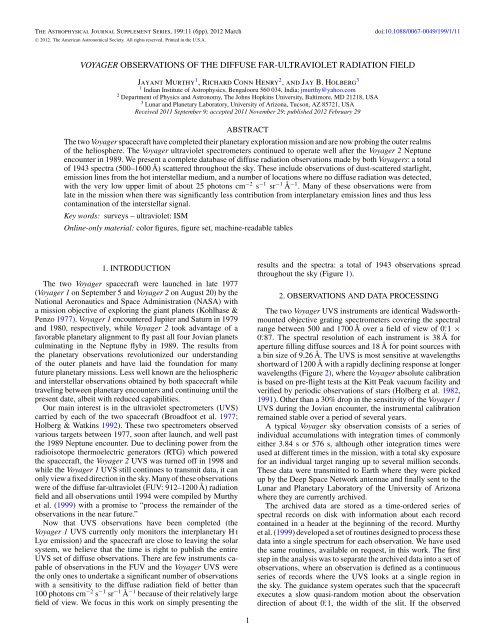
The Astrophysical Journal Supplement Series, 199:11 (6pp), 2012 March<br />
C○ 2012. The American Astronomical Society. All rights reserved. Printed in <strong>the</strong> U.S.A.<br />
doi:10.1088/0067-0049/199/1/11<br />
VOYAGER OBSERVATIONS OF THE DIFFUSE FAR-ULTRAVIOLET RADIATION FIELD<br />
Jayant Murthy 1 , Richard Conn Henry 2 , and Jay B. Holberg 3<br />
1 Indian Institute <strong>of</strong> Astrophysics, Bengalooru 560 034, India; jmurthy@yahoo.com<br />
2 Department <strong>of</strong> Physics and Astronomy, The Johns Hopkins University, Baltimore, MD 21218, USA<br />
3 Lunar and Planetary Laboratory, University <strong>of</strong> Arizona, Tucson, AZ 85721, USA<br />
Received 2011 September 9; accepted 2011 November 29; published 2012 February 29<br />
ABSTRACT<br />
The two Voyager spacecraft have completed <strong>the</strong>ir planetary exploration mission and are now probing <strong>the</strong> outer realms<br />
<strong>of</strong> <strong>the</strong> heliosphere. The Voyager <strong>ultraviolet</strong> spectrometers continued to operate well after <strong>the</strong> Voyager 2 Neptune<br />
encounter in 1989. We present a complete database <strong>of</strong> <strong>diffuse</strong> <strong>radiation</strong> <strong>observations</strong> made by both Voyagers: a total<br />
<strong>of</strong> 1943 spectra (500–1600 Å) scattered throughout <strong>the</strong> sky. These include <strong>observations</strong> <strong>of</strong> dust-scattered starlight,<br />
emission lines from <strong>the</strong> hot interstellar medium, and a number <strong>of</strong> locations where no <strong>diffuse</strong> <strong>radiation</strong> was detected,<br />
with <strong>the</strong> very low upper limit <strong>of</strong> about 25 photons cm −2 s −1 sr −1 Å −1 . Many <strong>of</strong> <strong>the</strong>se <strong>observations</strong> were from<br />
late in <strong>the</strong> mission when <strong>the</strong>re was significantly less contribution from interplanetary emission lines and thus less<br />
contamination <strong>of</strong> <strong>the</strong> interstellar signal.<br />
Key words: surveys – <strong>ultraviolet</strong>: ISM<br />
Online-only material: color figures, figure set, machine-readable tables<br />
1. INTRODUCTION<br />
The two Voyager spacecraft were launched in late 1977<br />
(Voyager 1 on September 5 and Voyager 2 on August 20) by <strong>the</strong><br />
National Aeronautics and Space Administration (NASA) with<br />
a mission objective <strong>of</strong> exploring <strong>the</strong> giant planets (Kohlhase &<br />
Penzo 1977). Voyager 1 encountered Jupiter and Saturn in 1979<br />
and 1980, respectively, while Voyager 2 took advantage <strong>of</strong> a<br />
favorable planetary alignment to fly past all four Jovian planets<br />
culminating in <strong>the</strong> Neptune flyby in 1989. The results from<br />
<strong>the</strong> planetary <strong>observations</strong> revolutionized our understanding<br />
<strong>of</strong> <strong>the</strong> outer planets and have laid <strong>the</strong> foundation for many<br />
future planetary missions. Less well known are <strong>the</strong> heliospheric<br />
and interstellar <strong>observations</strong> obtained by both spacecraft while<br />
traveling between planetary encounters and continuing until <strong>the</strong><br />
present date, albeit with reduced capabilities.<br />
Our main interest is in <strong>the</strong> <strong>ultraviolet</strong> spectrometers (UVS)<br />
carried by each <strong>of</strong> <strong>the</strong> two spacecraft (Broadfoot et al. 1977;<br />
Holberg & Watkins 1992). These two spectrometers observed<br />
various targets between 1977, soon after launch, and well past<br />
<strong>the</strong> 1989 Neptune encounter. Due to declining power from <strong>the</strong><br />
radioisotope <strong>the</strong>rmoelectric generators (RTG) which powered<br />
<strong>the</strong> spacecraft, <strong>the</strong> Voyager 2 UVS was turned <strong>of</strong>f in 1998 and<br />
while <strong>the</strong> Voyager 1 UVS still continues to transmit data, it can<br />
only view a fixed direction in <strong>the</strong> sky. Many <strong>of</strong> <strong>the</strong>se <strong>observations</strong><br />
were <strong>of</strong> <strong>the</strong> <strong>diffuse</strong> <strong>far</strong>-<strong>ultraviolet</strong> (FUV: 912–1200 Å) <strong>radiation</strong><br />
<strong>field</strong> and all <strong>observations</strong> until 1994 were compiled by Murthy<br />
et al. (1999) with a promise to “process <strong>the</strong> remainder <strong>of</strong> <strong>the</strong><br />
<strong>observations</strong> in <strong>the</strong> near future.”<br />
Now that UVS <strong>observations</strong> have been completed (<strong>the</strong><br />
Voyager 1 UVS currently only monitors <strong>the</strong> interplanetary H i<br />
Lyα emission) and <strong>the</strong> spacecraft are close to leaving <strong>the</strong> solar<br />
system, we believe that <strong>the</strong> time is right to publish <strong>the</strong> entire<br />
UVS set <strong>of</strong> <strong>diffuse</strong> <strong>observations</strong>. There are few instruments capable<br />
<strong>of</strong> <strong>observations</strong> in <strong>the</strong> FUV and <strong>the</strong> Voyager UVS were<br />
<strong>the</strong> only ones to undertake a significant number <strong>of</strong> <strong>observations</strong><br />
with a sensitivity to <strong>the</strong> <strong>diffuse</strong> <strong>radiation</strong> <strong>field</strong> <strong>of</strong> better than<br />
100 photons cm −2 s −1 sr −1 Å −1 because <strong>of</strong> <strong>the</strong>ir relatively large<br />
<strong>field</strong> <strong>of</strong> view. We focus in this work on simply presenting <strong>the</strong><br />
results and <strong>the</strong> spectra: a total <strong>of</strong> 1943 <strong>observations</strong> spread<br />
throughout <strong>the</strong> sky (Figure 1).<br />
2. OBSERVATIONS AND DATA PROCESSING<br />
The two Voyager UVS instruments are identical Wadsworthmounted<br />
objective grating spectrometers covering <strong>the</strong> spectral<br />
range between 500 and 1700 Å over a <strong>field</strong> <strong>of</strong> view <strong>of</strong> 0. ◦ 1 ×<br />
0. ◦ 87. The spectral resolution <strong>of</strong> each instrument is 38 Å for<br />
aperture filling <strong>diffuse</strong> sources and 18 Å for point sources with<br />
a bin size <strong>of</strong> 9.26 Å. The UVS is most sensitive at wavelengths<br />
shortward <strong>of</strong> 1200 Å with a rapidly declining response at longer<br />
wavelengths (Figure 2), where <strong>the</strong> Voyager absolute calibration<br />
is based on pre-flight tests at <strong>the</strong> Kitt Peak vacuum facility and<br />
verified by periodic <strong>observations</strong> <strong>of</strong> stars (Holberg et al. 1982,<br />
1991). O<strong>the</strong>r than a 30% drop in <strong>the</strong> sensitivity <strong>of</strong> <strong>the</strong> Voyager 1<br />
UVS during <strong>the</strong> Jovian encounter, <strong>the</strong> instrumental calibration<br />
remained stable over a period <strong>of</strong> several years.<br />
A typical Voyager sky observation consists <strong>of</strong> a series <strong>of</strong><br />
individual accumulations with integration times <strong>of</strong> commonly<br />
ei<strong>the</strong>r 3.84 s or 576 s, although o<strong>the</strong>r integration times were<br />
used at different times in <strong>the</strong> mission, with a total sky exposure<br />
for an individual target ranging up to several million seconds.<br />
These data were transmitted to Earth where <strong>the</strong>y were picked<br />
up by <strong>the</strong> Deep Space Network antennae and finally sent to <strong>the</strong><br />
Lunar and Planetary Laboratory <strong>of</strong> <strong>the</strong> University <strong>of</strong> Arizona<br />
where <strong>the</strong>y are currently archived.<br />
The archived data are stored as a time-ordered series <strong>of</strong><br />
spectral records on disk with information about each record<br />
contained in a header at <strong>the</strong> beginning <strong>of</strong> <strong>the</strong> record. Murthy<br />
et al. (1999) developed a set <strong>of</strong> routines designed to process <strong>the</strong>se<br />
data into a single spectrum for each observation. We have used<br />
<strong>the</strong> same routines, available on request, in this work. The first<br />
step in <strong>the</strong> analysis was to separate <strong>the</strong> archived data into a set <strong>of</strong><br />
<strong>observations</strong>, where an observation is defined as a continuous<br />
series <strong>of</strong> records where <strong>the</strong> UVS looks at a single region in<br />
<strong>the</strong> sky. The guidance system operates such that <strong>the</strong> spacecraft<br />
executes a slow quasi-random motion about <strong>the</strong> observation<br />
direction <strong>of</strong> about 0. ◦ 1, <strong>the</strong> width <strong>of</strong> <strong>the</strong> slit. If <strong>the</strong> observed<br />
1
The Astrophysical Journal Supplement Series, 199:11 (6pp), 2012 March<br />
Murthy, Henry, & Holberg<br />
Table 1<br />
Voyager RTG Log<br />
Figure 1. Distribution <strong>of</strong> Voyager <strong>observations</strong>. The Galactic center is at <strong>the</strong><br />
origin in this Ait<strong>of</strong>f plot.<br />
Year Exposure Time Dates Used<br />
(s)<br />
Voyager 1 RTG<br />
R1 1978.51 259200 1977.70–1979.19<br />
R2 1979.88 163584 1979.20–1980.63<br />
R3 1981.38 365760 1980.63–1983.37<br />
R4 1985.66 628416 1983.73–1986.37<br />
R5 1987.92 523008 1986.88–1989.30<br />
R6 1992.45 417360 1990.58–1992.85<br />
R7 1993.47 257520 1993.43–1994.27<br />
R8 1995.08 182880 1994.27–1995.48<br />
R9 1995.88 660480 1995.48–1996.96<br />
R10 1998.05 357600 1996.97–1999.60<br />
R11 2001.34 61440 1999.77–2001.84<br />
Voyager 2 RTG<br />
R12 1978.61 327600 1977.67–1979.45<br />
R13 1980.3 813430 1979.46–1984.59<br />
R14 1984.61 794520 1984.61–1985.50<br />
R15 1986.39 26146.2 1985.50–1987.41<br />
R16 1988.64 902016 1987.85–1988.96<br />
R17 1989.34 44577.2 1989.26–1991.22<br />
R18 1993.26 347238 1991.31–1993.30<br />
R19 1995.12 198000 ...<br />
R20 1996.93 246240 ...<br />
R21 1997.08 71520 ...<br />
R22 1997.55 939360 1993.30–1998.86<br />
R23 1997.72 33120 ...<br />
Figure 2. Voyager 1 and 2 calibration curves. The sensitivity <strong>of</strong> <strong>the</strong> UVS<br />
instruments is significantly lower at wavelengths longer than 1200 Å.<br />
source is a star (or o<strong>the</strong>r point source), <strong>the</strong> signal will be strongly<br />
modulated as <strong>the</strong> source moves in and out <strong>of</strong> <strong>the</strong> <strong>field</strong> <strong>of</strong> view,<br />
unlike <strong>the</strong> steady signal from a <strong>diffuse</strong> source. We used this<br />
behavior to reject all point-source <strong>observations</strong>, leaving us with<br />
1977 potential <strong>observations</strong> <strong>of</strong> <strong>diffuse</strong> <strong>radiation</strong> <strong>of</strong> which, as<br />
described below, 1943 were usable.<br />
There were two sources <strong>of</strong> non-astronomical background<br />
in <strong>the</strong>se spectra. The first <strong>of</strong> <strong>the</strong>se was detector noise in <strong>the</strong><br />
detectors caused by <strong>the</strong> decay <strong>of</strong> <strong>the</strong> plutonium in <strong>the</strong> RTG. This<br />
was measured through periodic <strong>observations</strong> <strong>of</strong> a calibration<br />
plate on <strong>the</strong> spacecraft from which no celestial signal could be<br />
expected (Table 1). We scaled <strong>the</strong> RTG spectrum to <strong>the</strong> observed<br />
spectrum below 912 Å (<strong>the</strong> Lyman limit), with <strong>the</strong> assumption<br />
that <strong>the</strong>re is no astrophysical emission <strong>the</strong>re, and subtracted<br />
it. Still remaining were <strong>the</strong> resonantly scattered heliospheric<br />
Lyman lines—Lyα at 1216 Å and Lyβ at 1027 Å.<br />
Murthy et al. (1999) found that <strong>the</strong> Lyβ/Lyα ratio was<br />
constant throughout <strong>the</strong> mission and that scattering artifacts<br />
proportional to <strong>the</strong> strength <strong>of</strong> <strong>the</strong> Lyα line extend throughout <strong>the</strong><br />
spectrum. This implied that we could choose a single template<br />
in which <strong>the</strong>re was no astrophysical emission, scale it to <strong>the</strong> Lyα<br />
line, and subtract it from <strong>the</strong> data. We sorted through <strong>the</strong><br />
<strong>observations</strong> to find <strong>the</strong> minimum emission in <strong>the</strong> spectral range<br />
from 900 to 1200 Å and assumed that that spectrum defined<br />
our effective zero level. While evaluating <strong>the</strong> spectra, it became<br />
apparent that <strong>the</strong> template itself changed during <strong>the</strong> mission,<br />
particularly after a planetary encounter. Thus, we required three<br />
templates in <strong>the</strong> Voyager 1 analysis, with a change after each <strong>of</strong><br />
<strong>the</strong> two planetary encounters (Table 2). The template was less<br />
stable for Voyager 2 and we required a total <strong>of</strong> 10 templates<br />
Table 2<br />
Voyager Template Log<br />
Year Exposure Time L B Dates Used<br />
(s)<br />
Voyager 1 Templates<br />
T1 1977.95 114144 134.2 27.3 1977.70–1978.37<br />
T2 1979.34 142080 115.0 −64.3 1978.61–1993.75<br />
T3 1998.09 303120 143.5 89.3 1993.93–2001.79<br />
Voyager 2 Templates<br />
T4 1977.93 308501 109.5 −62.2 1977.92–1978.35<br />
T5 1979.68 65856 103.4 −65.0 1978.81–1980.73<br />
T6 1981.35 98385 70.6 −41.9 1981.03–1981.95<br />
T7 1983.07 249748 74.8 −58.3 1982.35–1984.06<br />
T8 1984.57 40896 173.4 14.6 1984.47–1986.44<br />
T9 1988.43 61170 12.9 47.6 1986.87–1988.96<br />
T10 1989.73 15824 184.9 −59.7 1989.27–1989.75<br />
T11 1992.22 52956 71.4 −29.3 1990.37–1995.20<br />
T12 1996.14 43920 14.4 81.1 1995.42–1996.35<br />
T13 1997.18 250080 62.8 −27.9 1996.55–1997.28<br />
T14 1998.26 50640 4.2 −82.4 1997.28–1998.72<br />
based on <strong>the</strong> mission date (Table 2). The RTG and template<br />
spectra are listed in Table 3 along with <strong>the</strong> calibration spectra.<br />
Apart from <strong>the</strong> RTG and template <strong>observations</strong>, we rejected<br />
20 <strong>observations</strong>, most <strong>of</strong> <strong>the</strong>m because <strong>of</strong> excess emission<br />
in <strong>the</strong> spectral region shortward <strong>of</strong> 912 Å, perhaps due to a<br />
source in <strong>the</strong> small occultation port. This left a total <strong>of</strong> 1943<br />
(832 V1 and 1111 V2) <strong>observations</strong> <strong>of</strong> <strong>the</strong> <strong>diffuse</strong> <strong>radiation</strong><br />
<strong>field</strong> with <strong>the</strong> observation log given in Table 4. Each <strong>of</strong> <strong>the</strong><br />
spectra, after subtraction <strong>of</strong> <strong>the</strong> RTG induced background and<br />
<strong>the</strong> interplanetary emission, is plotted in Figure 3 and <strong>the</strong><br />
spectra <strong>the</strong>mselves are tabulated in Table 5 for <strong>the</strong> Voyager 1<br />
2
The Astrophysical Journal Supplement Series, 199:11 (6pp), 2012 March<br />
Murthy, Henry, & Holberg<br />
0.06<br />
0.04<br />
Sequence = 1<br />
Date = 1977.70<br />
L = 217.531<br />
B = −14.781<br />
Exp. = 77472<br />
Bkgd. = 3596<br />
Counts/pixel<br />
0.02<br />
0.00<br />
–0.02<br />
600 800 1000 1200<br />
Wavelength (Å)<br />
Figure 3. Spectra <strong>of</strong> Voyager 1 and Voyager 2 <strong>observations</strong>. Overplotted are <strong>the</strong> best-fit O star template spectra (blue) and B star template spectra (red). The internal<br />
sequence number, observation date, galactic coordinates <strong>of</strong> each target, exposure time, and best-fit B star values are listed in each spectrum.<br />
(A color version and <strong>the</strong> complete figure set (1943 images) are available in <strong>the</strong> online journal.)<br />
Table 3<br />
Voyager RTG and Template Spectra<br />
V1 Wavelength V2 Wavelength V1 Calibration V2 Calibration R1 R2 R3 R4<br />
(Å) (Å) (counts s −1 pixel −1 )<br />
539.46 518.08 106122 86827 1.2443 1.1398 1.1300 1.0525<br />
548.72 527.34 106773 86020 1.0569 1.0134 0.9917 0.9645<br />
557.98 536.6 106764 86566 1.8658 1.1177 1.0956 1.9748<br />
567.24 545.86 106755 86711 2.0477 0.9493 0.9385 2.0562<br />
576.5 555.12 107166 88120 1.1813 0.7587 0.7459 0.8202<br />
585.76 564.38 107448 89053 1.1210 0.8016 0.8062 0.6907<br />
595.02 573.64 107740 90376 1.1629 0.8072 0.8164 0.8456<br />
604.28 582.9 108941 91486 1.0872 0.8874 0.9248 0.8799<br />
Notes. The wavelengths for <strong>the</strong> UVS on <strong>the</strong> two spacecraft are <strong>of</strong>fset by about 21 Å. The calibration coefficients are in units<br />
<strong>of</strong> photons cm −2 s −1 sr −1 Å −1 (counts s −1 pixel −1 ) −1 .<br />
(This table is available in its entirety in a machine-readable form in <strong>the</strong> online journal. A portion is shown here for guidance regarding<br />
its form and content.)<br />
Table 4<br />
Voyager Observation Log<br />
Sequence S/c Date Exposure time GL GB E(B − V) IR100 GALEX<br />
(1) (2) (3) (4) (5) (6) (7) (8) (9)<br />
1 1 1977.7 77472 217.53 −14.78 0.75 16.04 −1<br />
2 1 1977.94 5604 275.29 60.62 0.02 1.02 427<br />
3 1 1978.01 10572 183.69 −17.73 0.48 12.84 3491<br />
4 1 1978.04 37416 328.39 53.09 0.03 1.4 632<br />
5 1 1978.04 33564 120.29 −25.37 0.06 2.66 1122<br />
6 1 1978.01 8292 183.71 −17.7 0.49 13.16 3491<br />
Notes. Column 1: internal sequence number; Column 2: spacecraft (Voyager 1 or Voyager 2); Column 3: mean date <strong>of</strong> observation;<br />
Column 4: total exposure time (s); Column 5: mean galactic longitude <strong>of</strong> observation; Column 6: mean galactic latitude <strong>of</strong><br />
observation; Column 7: E(B − V) from Schlegel et al. (1998); Column 8: 100 μm emission (MJy sr −1 ) from Schlegel et al.<br />
(1998); Column 9: GALEX FUV (photons cm −2 s −1 sr −1 Å −1 at 1517 Å) emission from Murthy et al. (2010).<br />
(This table is available in its entirety in a machine-readable form in <strong>the</strong> online journal. A portion is shown here for guidance<br />
regarding its form and content.)<br />
<strong>observations</strong> and in Table 6 for Voyager 2. There is an extreme<br />
range in both exposure time and level <strong>of</strong> <strong>the</strong> <strong>diffuse</strong> flux and,<br />
although all <strong>the</strong> spectra are usable, <strong>the</strong>ir quality should be<br />
examined before detailed analysis.<br />
3. RESULTS AND DISCUSSION<br />
Most <strong>of</strong> <strong>the</strong> <strong>diffuse</strong> spectra presented in this work are <strong>of</strong><br />
starlight scattered from interstellar dust and so we have fit each<br />
3
The Astrophysical Journal Supplement Series, 199:11 (6pp), 2012 March<br />
Murthy, Henry, & Holberg<br />
Wavelength<br />
Table 5<br />
Voyager 1 Spectra<br />
Sequence<br />
(Å) 1 2 3 4 5 6<br />
539.46 0.0705 0.0035 −0.0233 0.0736 0.0189 −0.0231<br />
548.72 0.0651 0.0017 −0.0221 0.0642 0.0153 −0.0222<br />
557.98 0.0651 0.0017 −0.0221 0.0642 0.0153 −0.0222<br />
567.24 0.1307 0.0066 −0.0114 0.1062 0.0279 −0.0106<br />
576.50 0.1307 0.0066 −0.0114 0.1062 0.0279 −0.0106<br />
585.76 0.0507 0.0376 0.0736 0.0265 0.0040 0.0766<br />
595.02 0.0110 0.0343 0.0792 −0.0049 −0.0027 0.0756<br />
Notes. Sequence references <strong>the</strong> internal sequence number and may be crossreferenced<br />
between tables.<br />
(This table is available in its entirety in a machine-readable form in <strong>the</strong> online<br />
journal. A portion is shown here for guidance regarding its form and content.)<br />
Table 6<br />
Voyager 2 Spectra<br />
Figure 4. Voyager <strong>diffuse</strong> fluxes in units <strong>of</strong> photons cm −2 s −1 sr −1 Å −1 .The<br />
Galactic center is at <strong>the</strong> origin.<br />
(A color version <strong>of</strong> this figure is available in <strong>the</strong> online journal.)<br />
(a)<br />
Wavelength<br />
Sequence<br />
(Å) 834 835 836 837 838 839<br />
518.08 0.0039 −0.0291 0.0580 −0.0282 0.0356 −0.0336<br />
527.34 0.0034 −0.0242 0.0472 −0.0234 0.0268 −0.0277<br />
536.60 0.0034 −0.0242 0.0472 −0.0234 0.0268 −0.0277<br />
545.86 0.0009 −0.0183 0.0450 −0.0182 0.0497 −0.0225<br />
555.12 0.0009 −0.0183 0.0450 −0.0182 0.0497 −0.0225<br />
564.38 −0.0118 0.0367 −0.0058 0.0365 0.0513 0.0341<br />
573.64 −0.0226 0.0729 −0.0293 0.0733 0.0613 0.0698<br />
Notes. Sequence references <strong>the</strong> internal sequence number and may be crossreferenced<br />
between tables.<br />
(This table is available in its entirety in a machine-readable form in <strong>the</strong> online<br />
journal. A portion is shown here for guidance regarding its form and content.)<br />
Table 7<br />
Fits to Diffuse Voyager Signal<br />
(b)<br />
Sequence Chisq1 Bkgd1 ΔBkgd1 Chisq2 Bkgd2 ΔBkgd2<br />
(1) (2) (3) (4) (5) (6) (7)<br />
1 0.24 2616 200 1.92 3596 300<br />
2 0.89 272 220 0.88 470 340<br />
3 0.93 1206 180 0.61 2040 280<br />
4 1.63 1199 100 3.14 1664 150<br />
5 6.06 1856 80 1.86 3107 120<br />
6 2.17 1454 140 1.05 2524 210<br />
7 8.00 1584 70 1.76 2720 100<br />
8 10.20 1326 50 8.08 2117 70<br />
Notes. Column 1: internal sequence number; Column 2: Chisq for an O star<br />
template fit; Column 3: flux <strong>of</strong> <strong>the</strong> model fit at 1100 Å Column 4: 1σ error in<br />
<strong>the</strong> model fit; Column 5: Chisq for a B star template fit; Column 6: flux <strong>of</strong> <strong>the</strong><br />
model fit at 1100 Å; Column 7: 1σ error in <strong>the</strong> model fit.<br />
(This table is available in its entirety in a machine-readable form in <strong>the</strong> online<br />
journal. A portion is shown here for guidance regarding its form and content.)<br />
spectrum with both B star and O star templates (plotted in<br />
Figure 3) and tabulated <strong>the</strong> model fits in Table 7. Note that<br />
<strong>the</strong>se fits are only for illustrative purposes and do not imply that<br />
<strong>the</strong> <strong>radiation</strong> in any particular direction is due to dust-scattered<br />
starlight. There are also a number <strong>of</strong> <strong>observations</strong> <strong>of</strong> supernovae<br />
remnants with strong line emission, primarily from <strong>the</strong> C iii<br />
(977 Å) and O vi (1032/1038) lines as observed, for instance, in<br />
Vela (Blair et al. 1995). These, and o<strong>the</strong>r similar <strong>observations</strong>,<br />
will require follow-up.<br />
Figure 5. (a) Distribution <strong>of</strong> <strong>the</strong> Voyager observed brightness with galactic<br />
latitude. (b) Distribution <strong>of</strong> GALEX observed brightness with galactic latitude.<br />
In order to study <strong>the</strong> dust scattered <strong>radiation</strong>, we used those<br />
<strong>observations</strong> <strong>of</strong> greater than 10,000 s in exposure time and no<br />
obvious interstellar line emission: a total <strong>of</strong> 1518 <strong>observations</strong>.<br />
The background values at 1100 Å, or ra<strong>the</strong>r <strong>the</strong> best-fit model<br />
values at 1100 Å assuming a B star template, are plotted in<br />
Figure 4, highlighting both <strong>the</strong> faintest <strong>observations</strong><br />
(10,000 photons cm −2 s −1 sr −1 Å −1 ). Although <strong>the</strong> overall<br />
distribution <strong>of</strong> <strong>the</strong> <strong>diffuse</strong> background follows a cosecant<br />
law falling <strong>of</strong>f from <strong>the</strong> Galactic plane (Figure 5(a)), it is<br />
4
The Astrophysical Journal Supplement Series, 199:11 (6pp), 2012 March<br />
Murthy, Henry, & Holberg<br />
Figure 6. Correlation between Voyager and GALEX observed backgrounds.<br />
Table 8<br />
Voyager 1 Zero Levels<br />
Sequence Date Gal. Long. Gal. Lat. Exp. Time Flux GALEX FUV<br />
(1) (2) (3) (4) (5) (6) (7)<br />
192 1981.42 35.9 27.6 365760 −4 ± 10 1137<br />
248 1992.47 314.8 20.9 450480 10 ± 15 ...<br />
316 1995.09 316.2 27.3 182880 11 ± 15 1756<br />
Notes. Column 1: internal sequence number; Column 2: observation date;<br />
Column 3: galactic longitude <strong>of</strong> observation; Column 4: galactic latitude<br />
<strong>of</strong> observation; Column 5: exposure time; Column 6: flux (photons<br />
cm −2 s −1 sr −1 Å −1 ) at 1100 Å with 1σ error bars; Column 7: GALEX<br />
FUV flux at 1500 Å (photons cm −2 s −1 sr −1 Å −1 ).<br />
not as sharply defined as <strong>the</strong> equivalent distribution at 1500 Å<br />
(Figure 5(b)), where we have plotted <strong>the</strong> values from <strong>the</strong> allsky<br />
map <strong>of</strong> <strong>the</strong> <strong>diffuse</strong> background observed by <strong>the</strong> Galaxy<br />
Evolution Explorer (GALEX) satellite (Murthy et al. 2010).<br />
As mentioned above, <strong>the</strong> dominant source <strong>of</strong> emission in<br />
both wavelength bands is likely to be dust-scattered <strong>radiation</strong>,<br />
in which case <strong>the</strong> Voyager <strong>observations</strong> should be correlated<br />
with <strong>the</strong> GALEX <strong>observations</strong>. In fact, <strong>the</strong> correlation between<br />
<strong>the</strong> two is poor (Figure 6) with a correlation coefficient <strong>of</strong> 0.55,<br />
primarily because <strong>the</strong>re are a number <strong>of</strong> locations at low galactic<br />
latitudes where Voyager observes little emission but GALEX<br />
observes significant emission. The converse is also true; <strong>the</strong>re<br />
are a number <strong>of</strong> regions with intense emission in <strong>the</strong> Voyager<br />
<strong>observations</strong> but much less in GALEX. The optical depth <strong>of</strong> <strong>the</strong><br />
dust grains at 1100 Å is about 40% more than at 1500 Å and thus<br />
<strong>the</strong> <strong>diffuse</strong> background at 1100 Å is due more to local effects<br />
than that at longer wavelengths but this is unlikely to be <strong>the</strong><br />
source <strong>of</strong> much <strong>of</strong> <strong>the</strong> discrepancy. O<strong>the</strong>r sources <strong>of</strong> emission<br />
include line emission from C iii (977 Å) and O vi (1035 Å) in <strong>the</strong><br />
Voyager spectral range (Murthy et al. 1993) and C iv (1550 Å) in<br />
<strong>the</strong> GALEX range, and Lyman and Werner band emission from<br />
molecular hydrogen contributing to both. A detailed study <strong>of</strong><br />
<strong>the</strong> individual regions is needed to understand <strong>the</strong> <strong>diffuse</strong> flux<br />
in each region.<br />
Observations <strong>of</strong> <strong>the</strong> faintest regions in <strong>the</strong> sky provide information<br />
about <strong>the</strong> systemic errors in our procedure as well<br />
as placing strong limits on <strong>the</strong> level <strong>of</strong> <strong>the</strong> <strong>diffuse</strong> background.<br />
To this end, we have identified <strong>the</strong> three <strong>observations</strong> (all from<br />
Voyager 1) which gave <strong>the</strong> lowest limits on <strong>the</strong> <strong>diffuse</strong> background<br />
(Table 8) and plotted <strong>the</strong>m in Figure 7 withaBstar<br />
spectrum scaled to 100 photons cm −2 s −1 sr −1 Å −1 at 1100 Å.<br />
Figure 7. Voyager 1 spectra <strong>of</strong> three regions with no observed flux. Overplotted<br />
(dark line) is a B star template with a flux <strong>of</strong> 100 photons cm −2 s −1 sr −1 Å −1<br />
at 1100 Å.<br />
These three spectra, after subtraction <strong>of</strong> <strong>the</strong> RTG spectrum and<br />
<strong>the</strong> Lyα template, are remarkably consistent despite a 14 year<br />
spread in observation date. The <strong>observations</strong> are all at moderate<br />
galactic latitudes and are widely separated in <strong>the</strong> sky yet<br />
show no sign <strong>of</strong> <strong>diffuse</strong> <strong>radiation</strong>, with an upper limit <strong>of</strong> about<br />
25 photons cm −2 s −1 sr −1 Å −1 . GALEX <strong>observations</strong> in <strong>the</strong><br />
two <strong>of</strong> <strong>the</strong>se regions find a flux <strong>of</strong> 1000–2000 photons<br />
cm −2 s −1 sr −1 Å −1 as expected from models <strong>of</strong> dust scattering<br />
(Draine 2003). Fur<strong>the</strong>r modeling is required to understand<br />
why no signal is observed in <strong>the</strong> Voyager bands.<br />
At <strong>the</strong> o<strong>the</strong>r end <strong>of</strong> <strong>the</strong> scale are <strong>the</strong> bright Voyager regions,<br />
many <strong>of</strong> which are at low Galactic latitudes and hence are likely<br />
due to starlight scattered from dust in <strong>the</strong> Galactic disk, while<br />
o<strong>the</strong>rs are <strong>observations</strong> in <strong>the</strong> LMC where <strong>the</strong>re are many bright<br />
stars and considerable <strong>diffuse</strong> FUV emission (Pradhan et al.<br />
2010). The dust scattered <strong>radiation</strong> is patchy in <strong>the</strong> <strong>ultraviolet</strong><br />
where <strong>the</strong> level <strong>of</strong> scattering depends on <strong>the</strong> relatively geometry<br />
between <strong>the</strong> dust and those few stars hot enough to contribute<br />
photons at <strong>the</strong>se wavelengths and a more detailed study <strong>of</strong> <strong>the</strong><br />
individual regions is required to model <strong>the</strong>m.<br />
4. CONCLUSIONS<br />
We have reduced all <strong>the</strong> <strong>diffuse</strong> <strong>observations</strong> made by <strong>the</strong><br />
two Voyager spacecraft from <strong>the</strong>ir launch in 1977 to <strong>the</strong>ir final<br />
UVS <strong>observations</strong> in 2001 and 1998 for Voyagers 1 and 2,<br />
respectively: a grand total <strong>of</strong> 1943 individual pointings. Most<br />
<strong>of</strong> <strong>the</strong>se <strong>observations</strong> are likely to be <strong>of</strong> starlight scattered by<br />
interstellar dust but <strong>the</strong>re are puzzling contradictions in that <strong>the</strong>re<br />
is a poor correlation with <strong>the</strong> GALEX <strong>observations</strong> at 1500 Å<br />
with low Voyager fluxes even near <strong>the</strong> Galactic plane. O<strong>the</strong>r<br />
<strong>observations</strong> show strong emission lines from hot gas, primarily<br />
C iii (977 Å) and O vi (1035 Å).<br />
We have now amassed a number <strong>of</strong> <strong>observations</strong> in different<br />
wavelength regimes: <strong>the</strong> Voyager spectra presented here<br />
(912–1200 Å); <strong>the</strong> GALEX <strong>observations</strong> <strong>of</strong> Murthy et al. (2010)<br />
in <strong>the</strong> FUV (1500 Å); <strong>the</strong> recent reanalysis <strong>of</strong> <strong>the</strong> Pioneer 10/11<br />
Imaging Photopolarimeter data by Matsuoka et al. (2011)in<strong>the</strong><br />
visible (4400 Å and 6400 Å); and <strong>the</strong> infrared data from IRAS<br />
and <strong>the</strong> Cosmic Orbiting Background Explorer satellites (e.g.,<br />
Odegard et al. 2007). We plan to integrate <strong>the</strong>se into a model<br />
for <strong>the</strong> <strong>diffuse</strong> <strong>radiation</strong> in our Galaxy.<br />
5
The Astrophysical Journal Supplement Series, 199:11 (6pp), 2012 March<br />
We are grateful to NASA for <strong>the</strong>ir wisdom in allowing<br />
<strong>the</strong> Voyager spacecraft to continue to make <strong>observations</strong> long<br />
after <strong>the</strong> end <strong>of</strong> <strong>the</strong> planetary mission. This work was partially<br />
supported by NASA’s Maryland Space Grant Consortium.<br />
REFERENCES<br />
Blair, W. P., Vancura, O., & Long, K. S. 1995, AJ, 110, 312<br />
Broadfoot, A. L., Sandel, B. R., Shemansky, D. E., et al. 1977, Space Sci. Rev.,<br />
21, 183<br />
Draine, B. T. 2003, ARA&A, 41, 241<br />
Holberg, J. B., Carone, T. E., & Polidan, R. S. 1991, Adv. Space Res., 11, 33<br />
Murthy, Henry, & Holberg<br />
Holberg, J. B., Forrester, W. T., Shemansky, D. E., & Barry, D. C. 1982, ApJ,<br />
257, 656<br />
Holberg, J. B., & Watkins, R. 1992, Voyager Ultraviolet Spectrometer Guest<br />
Observer and Data Analysis Handbook, Version 1.1<br />
Kohlhase, C. E., & Penzo, P. A. 1977, Space Sci. Rev., 21, 77<br />
Matsuoka, Y., Ienaka, N., Kawara, K., & Oyabu, S. 2011, ApJ, 736, 119<br />
Murthy, J., Hall, D. T., Earl, M. E., Henry, R. C., & Holberg, J. B. 1999, ApJ,<br />
522, 904<br />
Murthy, J., Henry, R. C., & Sujatha, N. V. 2010, ApJ, 724, 1389<br />
Murthy, J., Im, M., Henry, R. C., & Holberg, J. B. 1993, ApJ, 419, 739<br />
Odegard, N., Arend, R. G., Dwek, E., et al. 2007, ApJ, 667, 11<br />
Pradhan, A. C., Pathak, A., & Murthy, J. 2010, ApJ, 718, L141<br />
Schlegel, D. J., Finkbeiner, D. P., & Davis, M. 1998, ApJ, 500, 525<br />
6