Chicago O'Hare Airport air Toxic Monitoring Program - Illinois ...
Chicago O'Hare Airport air Toxic Monitoring Program - Illinois ...
Chicago O'Hare Airport air Toxic Monitoring Program - Illinois ...

Create successful ePaper yourself
Turn your PDF publications into a flip-book with our unique Google optimized e-Paper software.
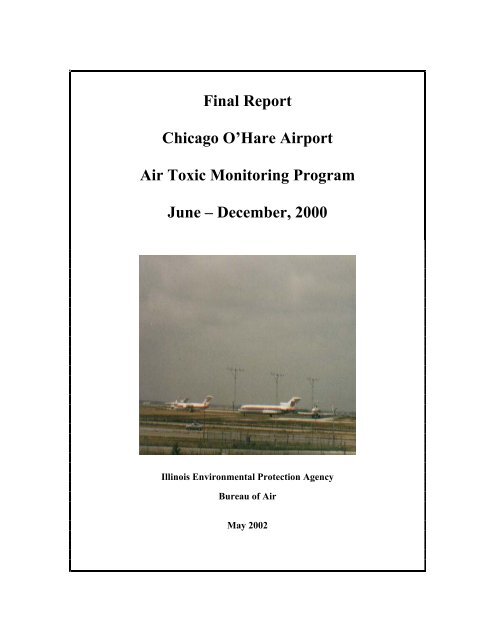
Final Report<br />
<strong>Chicago</strong> O’Hare <strong>Airport</strong><br />
Air <strong>Toxic</strong> <strong>Monitoring</strong> <strong>Program</strong><br />
June – December, 2000<br />
<strong>Illinois</strong> Environmental Protection Agency<br />
Bureau of Air<br />
May 2002
Table of Contents<br />
Section<br />
Executive Summary<br />
Page No.<br />
ii<br />
1.0 Air <strong>Monitoring</strong> <strong>Program</strong> Description<br />
1.1 Background 1<br />
1.2 <strong>Monitoring</strong> Objectives 2<br />
1.3 <strong>Monitoring</strong> Network 2<br />
1.4 Laboratory Methods and Quality Assurance 4<br />
2.0 Sampling Results<br />
2.1 Reporting Units 5<br />
2.2 <strong>Program</strong> Data 5<br />
3.0 Findings<br />
3.1 <strong>Chicago</strong> Area Measurements 6<br />
3.2 Geographic Area Analysis 6<br />
3.3 Comparison of Results to Other U.S. Cities 10<br />
3.4 O’Hare <strong>Airport</strong> Impact 11<br />
4.0 Conclusions 16<br />
5.0 References 17<br />
Appendix I. Description of Air <strong>Monitoring</strong> Sites 21<br />
Appendix II. List of <strong>Toxic</strong> Air Pollutants 26<br />
Appendix III. Project Sampling Data 27<br />
Appendix IV. Meteorological Summary of Sampling Days 40<br />
Appendix V. General Information for Selected Target Compounds 44<br />
i
Executive Summary<br />
O’Hare International <strong>Airport</strong> (O’Hare) is one of the world’s busiest <strong>air</strong>ports and the subject of<br />
much interest regarding the environmental impact <strong>air</strong>port operations have on the surrounding<br />
community and the <strong>Chicago</strong> area in general. As part of its fiscal year 2001 <strong>air</strong> monitoring<br />
program, the <strong>Illinois</strong> EPA measured the <strong>air</strong>borne levels of various <strong>air</strong> contaminants in the<br />
vicinity of O’Hare as well as at other locations in the <strong>Chicago</strong> area. The purpose of this<br />
measurement program was to collect information that would help assess the relative impact of<br />
<strong>air</strong>port related emissions and levels of <strong>air</strong>borne contaminants characteristic of large urban areas.<br />
This monitoring program will supplement a national program designed to assess and minimize<br />
the impact of toxic <strong>air</strong> contaminants in urban areas. The national program is referred to as the<br />
National Integrated Urban Air <strong>Toxic</strong>s Strategy (National Strategy).<br />
The National Strategy was developed by the United States Environmental Protection Agency<br />
(USEPA) in response to requirements specified in the federal Clean Air Act. Under these<br />
requirements, USEPA is charged with assessing the impact of <strong>air</strong>borne levels of various <strong>air</strong> toxic<br />
compounds on human health in urban areas of the United States and taking action to reduce risks<br />
caused by unacceptable levels of such contaminants. In July 1999, the USEPA released its<br />
National Strategy describing a framework for addressing <strong>air</strong> toxic emissions from stationary and<br />
mobile sources such as O’Hare <strong>Airport</strong>. As part of the National Strategy, <strong>air</strong> monitoring<br />
programs are to be used to identify and measure compounds believed to present the greatest<br />
concern to public health in urban areas.<br />
Federal and State funding was provided to allow the initiation of an urban <strong>air</strong> toxic monitoring<br />
program in calendar year 2000. The funding was adequate to support a limited <strong>air</strong> quality<br />
investigation of targeted compounds through a six month monitoring program with two sites<br />
located near O’Hare <strong>Airport</strong> and three other sites in the <strong>Chicago</strong> metropolitan area. The<br />
monitoring program began in June 2000 and focused on the urban <strong>air</strong> toxic compounds identified<br />
in USEPA’s National Strategy and on mobile source emissions associated with <strong>air</strong>port<br />
operations. The compounds sampled included volatile organics, semi-volatile organics,<br />
carbonyls and trace metals. The monitoring program ended in December 2000.<br />
The <strong>Chicago</strong> area toxics monitoring program, as deployed in 2000, was designed to provide data<br />
to meet four objectives:<br />
1) Measure the concentrations of specific compounds of concern;<br />
2) Assess the geographic variability of various compounds in the <strong>Chicago</strong> area and<br />
perform a comparison of levels measured at the two O’Hare sites to those recorded<br />
at the remaining three <strong>Chicago</strong> area locations;<br />
3) Compare <strong>Chicago</strong> area results to data collected for other large U.S. cities; and<br />
4) Determine if the emissions associated with O’Hare <strong>Airport</strong> have a measurable<br />
impact on <strong>air</strong> quality in areas adjacent to the <strong>air</strong>port.<br />
ii
In order to measure the concentrations of the target compounds, comprehensive sampling was<br />
conducted on sixteen days through the six month period of June through December 2000, using a<br />
once every twelve days sampling schedule. The sampling results were summarized for each of<br />
the five monitoring sites and tabulated into two categories, Urban Air <strong>Toxic</strong> compounds and<br />
Hazardous Air Pollutants (HAPs). The Urban Air <strong>Toxic</strong>s compounds are those identified by<br />
USEPA in the National Strategy that present the greatest threat to public health in urban areas,<br />
including known or suspected cancer risks from compounds such as benzene, formaldehyde,<br />
chromium and dioxins. The HAPs are compounds required to be regulated by USEPA under the<br />
Clean Air Amendments of 1990 that are known or suspected to cause cancer or have other<br />
serious health effects but are not included in the list of Urban Air <strong>Toxic</strong> compounds covered<br />
under the National Strategy. The HAPs measured included such compounds as ethyl benzene,<br />
styrene, toluene, xylenes and various polycyclic aromatics such as naphthalene and<br />
phenanthrene. The tabulated data included the individual daily sampling results along with the<br />
overall average concentration found for each target compound.<br />
The program’s sampling sites were located to provide <strong>air</strong> toxic measurements at different points<br />
across the <strong>Chicago</strong> metropolitan area, thereby allowing for a comparison of the levels found at<br />
O’Hare <strong>Airport</strong> to those found in different parts of the metropolitan area. In addition to the two<br />
sites located near O’Hare in Bensenville and Schiller Park, sites were also located in Northbrook,<br />
just north of the urban core, at Washington School in highly industrialized Southeast <strong>Chicago</strong>,<br />
and in Lemont, just downwind of major refineries and chemical complexes and on the<br />
southwestern edge of the metropolitan area.<br />
A review and analysis of the accumulated monitoring results obtained from the five site<br />
monitoring network provided the following findings:<br />
1. The average concentrations measured at O’Hare <strong>Airport</strong> for many of the target<br />
compounds were found to be comparable with the concentrations found at the other<br />
<strong>Chicago</strong> area sites;<br />
2. The highest concentrations of several target urban <strong>air</strong> toxic compounds were found<br />
to be spread between several sites but generally the highest levels for many of the <strong>air</strong><br />
toxics were found to occur in Southeast <strong>Chicago</strong>;<br />
3. The lowest concentrations of most target compounds were measured at Lemont.<br />
A comparison of measured levels of urban <strong>air</strong> toxics in <strong>Chicago</strong> to those found in other large<br />
cities served as a point of reference to what would be considered “typical urban” concentrations.<br />
USEPA’s Aerometric Storage and Retrieval System (AIRS) was accessed to obtain the <strong>air</strong><br />
quality data collected from monitoring sites nationwide. A review of information submitted to<br />
AIRS found that data for certain <strong>air</strong> toxic compounds had been reported for a number of large<br />
urbanized areas. Based upon a comparison of the results from the <strong>Chicago</strong> area monitoring<br />
program to that collected for other large U.S. cities data, it was found that:<br />
1. Concentrations of several of the principal urban <strong>air</strong> toxics, such as acetaldehyde,<br />
benzene, and formaldehyde, compared to the metropolitan areas of Atlanta, Detroit,<br />
Houston and Milwaukee, were found to be comparable or lower in the <strong>Chicago</strong><br />
metropolitan area.<br />
iii
2. The acetaldehyde and formaldehyde levels measured near O’Hare <strong>Airport</strong> were<br />
comparable or lower than levels measured in Atlanta, Detroit and Houston.<br />
In order to assess the possible impact of emissions from O’Hare <strong>Airport</strong> on adjacent areas, two<br />
monitoring sites were deployed on different sides of the <strong>air</strong>port. This configuration allowed for<br />
the collection of sampling data on wind persistent days that would align one site to be upwind,<br />
unaffected by the <strong>air</strong>port, and the other to be downwind and subject to <strong>air</strong>port emissions. The<br />
difference in concentrations found between the two sites on those wind-persistent days allowed<br />
for an approximation of the <strong>air</strong>port’s impact. Of the sixteen sampling days, five days had such<br />
wind-persistent conditions. An analysis of the results from those five days found the downwind<br />
site to record levels of some target compounds from 20-85% higher than the upwind site. The<br />
compounds with measurable differences included acetaldehyde, benzene, formaldehyde,<br />
polycyclic organics, toluene and lead. All of those compounds have been associated with<br />
emissions from <strong>air</strong>port operations. An impact from the <strong>air</strong>port was not unexpected since <strong>air</strong>port<br />
operations are sources of various <strong>air</strong> contaminants. The concentrations measured downwind of<br />
O’Hare were at levels considered to be “typical” of an urban area and in some cases lower than<br />
values measured in other cities.<br />
Based upon the review of the <strong>air</strong> toxics monitoring data collected near O’Hare <strong>Airport</strong>, from<br />
other <strong>Chicago</strong> area sites, and from USEPA’s AIRS database, the following conclusions were<br />
reached:<br />
1. The levels of <strong>air</strong> toxic compounds found near O’Hare and other sites in the <strong>Chicago</strong><br />
metropolitan area were comparable or lower than those found in other large U.S.<br />
cities.<br />
2. The highest levels of most <strong>air</strong> toxic compounds measured in the <strong>Chicago</strong> area were<br />
found in Southeast <strong>Chicago</strong>.<br />
3. An analysis of data collected from the sites at O’Hare found that emissions from the<br />
<strong>Airport</strong> have an impact on the <strong>air</strong> quality in adjacent communities, but that impact<br />
did not result in levels higher than those found in a typical urban environment.<br />
The data collected through this study’s <strong>air</strong> monitoring program indicated that the toxics <strong>air</strong><br />
quality in the vicinity of O’Hare <strong>Airport</strong> is comparable to the <strong>air</strong> quality in other parts of <strong>Chicago</strong><br />
and comparable to the <strong>air</strong> quality in other major urban areas. There are continuing and ongoing<br />
efforts, such as through USEPA’s National Strategy, to identify, assess and reduce risk from <strong>air</strong><br />
toxics in and around urban areas.<br />
iv
Section 1.0 Air <strong>Monitoring</strong> <strong>Program</strong> Description<br />
1.1 Background<br />
Ambient <strong>air</strong> monitoring for a limited number of <strong>air</strong> toxic compounds has been conducted<br />
in <strong>Illinois</strong> for many years. Measurement of <strong>air</strong>borne particulate metals, some of which<br />
are considered hazardous <strong>air</strong> pollutants (HAPs), has been done statewide since the early<br />
1970s. In the early 1990s, the Photochemical (Ozone) Assessment <strong>Monitoring</strong> (PAMS)<br />
program began collecting data for volatile organic compounds, which included a number<br />
of compounds considered to be urban <strong>air</strong> toxics; e.g., benzene and formaldehyde. The<br />
PAMS program has been limited to the <strong>Chicago</strong> metropolitan area. Beyond these two<br />
programs, <strong>air</strong> toxic monitoring efforts have been minimal due to a lack of any specific<br />
regulatory requirements.<br />
In July 1999, as part of its national program to reduce ambient levels of <strong>air</strong> toxics, the<br />
United States Environmental Protection Agency (USEPA) released its National<br />
Integrated Urban Air <strong>Toxic</strong>s Strategy (National Strategy). Reference 1. The National<br />
Strategy presented a framework for addressing <strong>air</strong> toxic emissions from stationary<br />
sources and mobile sources such as <strong>Chicago</strong>’s O’Hare <strong>Airport</strong>. An integral part of<br />
National Strategy called for the establishment of <strong>air</strong> monitoring programs to begin<br />
collecting data needed to characterize the ambient concentrations of certain compounds<br />
known to present the greatest concern for public health in urban areas.<br />
A preliminary assessment of the <strong>air</strong> toxic emissions from O’Hare <strong>Airport</strong> and the<br />
resulting health effects created by the toxic emissions in surrounding communities was<br />
sponsored the City of Park Ridge, <strong>Illinois</strong>, in early 2000. Reference 2. The Park Ridge<br />
Study concluded that toxic emissions from O’Hare had a widespread impact and<br />
presented an associated health risk to residents in the communities surrounding O’Hare.<br />
The Park Ridge Study also identified the need for better assessment of the data used in<br />
the study and recommended that comprehensive <strong>air</strong> monitoring be conducted around<br />
O’Hare and in impacted communities. These data could then be used to conduct a more<br />
complete and comprehensive <strong>air</strong> quality analysis.<br />
In the fall of 1999, federal and state funding became available to allow the initiation of an<br />
urban <strong>air</strong> toxic monitoring program in <strong>Illinois</strong>. The funding was adequate to support a<br />
preliminary <strong>air</strong> quality investigation of targeted compounds through a six month<br />
monitoring program with two sites near O’Hare <strong>Airport</strong> and at three other sites in the<br />
<strong>Chicago</strong> metropolitan area. The monitoring program began in June 2000 and focused on<br />
the urban <strong>air</strong> toxic compounds identified in USEPA’s National Strategy and on mobile<br />
source emissions associated with <strong>air</strong>port operations. The compounds of interest included<br />
volatile organics, semi-volatile organics, carbonyls and trace metals. The monitoring<br />
program ended in December 2000.<br />
1
1.2 <strong>Monitoring</strong> Objectives<br />
The <strong>Chicago</strong> area <strong>air</strong> toxics monitoring network deployed in 2000 was designed to<br />
provide data to meet the following objectives:<br />
1. Determine ambient concentrations of specific compounds of concern;<br />
2. Describe pollutant levels at various locations across the area, assess their<br />
geographic variability and perform a comparison of the levels of <strong>air</strong> toxics<br />
found at O’Hare <strong>Airport</strong> to other sites in the <strong>Chicago</strong> area;<br />
3. Provide monitoring results consistent with nationally available <strong>air</strong> toxics<br />
information that would allow for a comparison of <strong>Chicago</strong> area results to data<br />
collected for other large U.S. cities; and<br />
4. Determine if the target compound emissions from O’Hare <strong>Airport</strong> have a<br />
measurable impact on <strong>air</strong> quality in the surrounding communities.<br />
To meet the above objectives, the focus was on the compounds identified by USEPA as<br />
Urban Air <strong>Toxic</strong>s and on other compounds known to be emitted by mobile sources (e.g.,<br />
cars, trucks and <strong>air</strong>craft). Particular attention was placed on those compounds associated<br />
with <strong>air</strong>craft operations; e.g., takeoff, landing, refueling and idling.<br />
1.3 <strong>Monitoring</strong> Network<br />
The monitoring program consisted of five sampling sites located as shown in Figure 1<br />
that were operated to collect calendar day samples (24-hour integrated samples) on a<br />
once every 12 day schedule throughout the period of June through December 2000. Air<br />
monitoring sites were located with two near O’Hare <strong>Airport</strong>, in Bensenville and Schiller<br />
Park, one site in Northbrook just downwind (North) of the urban core, at <strong>Chicago</strong>-<br />
Washington in highly industrialized Southeast <strong>Chicago</strong>, and in Lemont, an area impacted<br />
by refineries and on the southwestern edge of the metropolitan area.<br />
The site selections were made based upon a review of historical meteorological data from<br />
the National Weather Service and from <strong>air</strong> quality data collected as part of the <strong>Illinois</strong> <strong>air</strong><br />
monitoring network. The sites selected at O’Hare were located to fall into two areas<br />
where predominant winds would provide the greatest frequency of impact from <strong>air</strong>port<br />
operations. The location of other significant emission sources, such as expressways,<br />
major arterial streets and industrial sources of organic compounds, was also a<br />
consideration in the final site selections. The sites were also located in areas with<br />
population exposure; e.g., non-remote areas along the fenceline, to allow the estimation<br />
of target compound concentrations in public areas adjacent to the <strong>air</strong>port.<br />
A complete description of each of the five sampling sites is provided in Appendix I. The<br />
descriptions provided include location details (address, building), immediate site locale,<br />
distance from influencing sources (roadways, <strong>air</strong>ports, industry), landmarks and a<br />
photograph showing the site exposure. All of the sites were established in USEPA’s<br />
Aerometric Information Retrieval System (AIRS) complete with the required site<br />
description information.<br />
2
57<br />
57<br />
#Y<br />
Figure 1<br />
Northbrook <strong>Chicago</strong> Area<br />
<strong>Toxic</strong> Network<br />
#Y Schiller Park<br />
Bensenville<br />
#Y<br />
88<br />
<strong>Chicago</strong> Washington H.S.<br />
#Y<br />
#Y<br />
Lemont<br />
<strong>Illinois</strong> EPA<br />
Bureau of Air<br />
#Y Air <strong>Monitoring</strong> Sites N<br />
Legend<br />
90<br />
290<br />
355<br />
<strong>Chicago</strong> <strong>O'Hare</strong> International <strong>Airport</strong><br />
Interstates<br />
Cook and DuPage County Boundaries<br />
355<br />
290<br />
55<br />
290<br />
88<br />
294<br />
294<br />
June-December, 2000<br />
94<br />
55<br />
290<br />
294<br />
80<br />
94 and 90<br />
90 and 94<br />
294 and 80<br />
0 2 4 6 8 10 Miles<br />
94<br />
90
Each monitoring site deployed four separate sampling systems to collect a wide-range of<br />
compounds on each sampling day. The samplers and analytical methods selected were<br />
consistent with those designated and approved by USEPA. The systems deployed<br />
included a VOC canister system with sample analysis by method TO-15, DNPH<br />
cartridge sampler with analysis by method TO-11A for carbonyls, high volume <strong>air</strong><br />
sampler with filter analysis by atomic absorption for metals and PUF sampler with<br />
analysis by TO-13A method for semi-volatile organics. Appendix II provides a listing of<br />
specific compounds, considered either as an Urban <strong>Toxic</strong> or HAP, obtained for each of<br />
these sampling and analysis methods.<br />
The sampling schedule utilized provided that 24-hour samples were collected on a<br />
calendar day basis once every 12 days. The schedule overlapped the national one-in-six<br />
day schedule used for the particulate and PAMS networks. The collected samples<br />
coincided with samples collected on the same days in other states. Sampling commenced<br />
on June 17, 2000, and ended on December 26, 2000, providing a total of 16 sampling<br />
days.<br />
1.4 Laboratory Methods and Quality Assurance<br />
All of the analytical methods used have been recognized and approved by USEPA. The<br />
four methods used were as follows:<br />
1. volatile organics (53 compounds) - TO-15, gas chromatography with mass<br />
spectroscopy (confirmation)<br />
2. carbonyls (14 compounds) - TO-11a, high pressure liquid<br />
chromatography<br />
3. semi-volatile organics (18 cmpds) - TO-13a gas chromotagraphy and mass<br />
spectroscopy analysis<br />
4. particulate metals (8 compounds) - atomic absorption<br />
The above analytical methods provide analyses for additional compounds not shown in<br />
Appendix II. For example, there are 18 compounds listed under Appendix II, Volatile<br />
Organics (Category I), but Method TO-15 tests for 53 compounds. This report provides<br />
the results for all compounds reported by the analytical method.<br />
For the purposes of this report, values are reported according to the Method Detection<br />
Limit (MDL). The MDL, as defined by USEPA, is the minimum concentration of a<br />
substance that can be measured and reported with 99% confidence that the target<br />
compound concentration is greater than zero, and is determined from analysis of a sample<br />
in a matrix containing the target compound. Analytical results were reported as zero for<br />
those values below the MDL.<br />
Quality assurance activities were conducted in a manner consistent with the PAMS and<br />
particulate sampling programs. This included flow audits, some duplicate sampling for<br />
4
precision (metals, VOCs), replicate analyses (VOCs) and independent performance audits<br />
(blind samples) for metals, VOCs and carbonyls. The maintenance and calibration<br />
procedures used were those provided in the <strong>Illinois</strong> Quality Assurance Plan for use in the<br />
<strong>Illinois</strong> <strong>air</strong> monitoring network and those that have been approved by USEPA.<br />
2.0 Sampling Results<br />
2.1 Reporting Units<br />
This report provides both summaries of the accumulated sampling results and data tables<br />
that present the individual sample values. Because of the nature of the toxic compounds;<br />
i.e., gases and solid particles, the results are expressed in different units. The volatile<br />
organic compound and carbonyl data in this report has been reported in parts per billion<br />
by volume (ppbv). It is important to note that PAMS data are typically reported in parts<br />
per billion by carbon (ppbc) and that the PAMS data used in this report have been<br />
converted from ppbc to ppbv.<br />
Data for the semi-volatile organic compounds and particulate metals have been reported<br />
in the units of nanograms per cubic meter, with the exception that the dioxins and furans<br />
data have been reported in picograms per cubic meter due to their extreme low<br />
concentration. Nanograms are 10 -9 grams and picograms are 10 -12 grams.<br />
The data available from USEPA’s AIRS database is reported in many different units and<br />
care should be taken when using AIRS data to note the units reported with each value.<br />
For example, particulate metals can be reported in micrograms per cubic meter,<br />
nanograms per cubic meter or picograms per cubic meter.<br />
2.2 <strong>Program</strong> Data<br />
The <strong>Chicago</strong> O’Hare <strong>air</strong> toxics monitoring program began in June 2000, and concluded in<br />
December 2000. During the seven month period, 24-hour integrated samples were<br />
collected on 16 calendar days. The results obtained for each individual compound on the<br />
16 sampling days for each of the five monitoring sites have been summarized and are<br />
provided in Appendix IIIA through Appendix IIIF. The sampling results for each site<br />
have been presented in two categories, “Urban Air <strong>Toxic</strong> Compounds” which include<br />
compounds designated in USEPA’s National Strategy and “Hazardous Air Pollutants<br />
(HAPS)” listed by USEPA as <strong>air</strong> toxic compounds which potentially can have adverse<br />
public health impacts. For example, Appendix IIIA lists the individual daily sampling<br />
results for Urban Air <strong>Toxic</strong> compounds measured at Bensenville and Appendix IIIB lists<br />
the daily HAPS values measured at Bensenville.<br />
The focus of the data analysis included in this report was placed on the compounds<br />
designated as Urban Air <strong>Toxic</strong>s and on other HAPS known to be emitted by mobile<br />
sources with emphasis on those associated with <strong>air</strong>port operations. These “target”<br />
compounds include those identified in the Park Ridge Study as the chemicals that<br />
contribute most significantly to risks associated with O’Hare <strong>air</strong>craft emissions.<br />
5
Section 3.0 Findings<br />
3.1 <strong>Chicago</strong> Area Measurements<br />
A primary objective of the <strong>Chicago</strong> urban area <strong>air</strong> toxics monitoring program was to<br />
determine ambient concentrations of specific “target” compounds of concern at various<br />
locations in the metropolitan area. The accumulated sampling data at each site then<br />
allowed for a determination of the typical concentrations that might be expected in each<br />
area. The data collected at each site have been summarized in Table 1 that provides the<br />
average concentration for each target compound at each of the five sampling sites. The<br />
values reported represent the arithmetic average of the results obtained on each of the 16<br />
sampling days.<br />
Of the target compounds, only vinyl chloride and 1,1,2,2-tetrachloroethylene were not<br />
found at a concentration above the sampling methods MDL and have values reported as<br />
zero. Acrolein was detected only on one day at two sites, Northbrook and <strong>Chicago</strong>-<br />
Washington, in a concentration that would allow a minimal average to be reported.<br />
Essentially, the average concentration of acrolein was zero at all five sites. While these<br />
three compounds are considered to be important urban <strong>air</strong> toxic compounds and may be<br />
found in significant concentration in some urbanized areas; e.g. Southern California, they<br />
do not appear to be in measurable levels in the <strong>Chicago</strong> Metropolitan Area.<br />
All of the other target compounds were found in concentrations above the MDL at all<br />
five sites. The compounds of most interest, including acetaldehyde, benzene, chromium<br />
formaldehyde, polycyclic organics and dioxins, were found at concentrations well above<br />
the MDL. USEPA identified benzene, formaldehyde, chromium and dioxins in their<br />
National Strategy as those compounds that present the greatest risk to public health in<br />
urban areas. The Park Ridge Study identified acetaldehyde, formaldehyde, benzene and<br />
napthalene (a major component of polycyclic organics) as those chemicals that contribute<br />
most significantly to risks associated with <strong>air</strong>craft emissions. The concentrations of these<br />
compounds found, as shown in Table 1, serve to demonstrate the levels at which they<br />
might be expected to occur in the <strong>Chicago</strong> metropolitan area. The following sections<br />
describe the results of additional data analyses needed to assess the significance of the<br />
presence of these compounds.<br />
3.2 Geographic Area Analysis<br />
In order to better understand the significance of the measured concentrations, a<br />
comparison of the results found from site to site provided insight into the urban nature of<br />
the some toxic compounds and identified compounds or areas that showed notable<br />
differences. The monitoring network design placed the sampling sites in areas with<br />
differing emission source impacts, thereby allowing an analysis of the results found in<br />
different areas across the urbanized area. The Bensenville and Schiller Park sites were<br />
located near O’Hare <strong>Airport</strong> in areas impacted by <strong>air</strong>port operations and the traffic in the<br />
surrounding expressways and major arterial streets. The Northbrook site was located just<br />
north and downwind of the urban core (<strong>Chicago</strong> Loop) in a high population density area<br />
6
impacted by emissions generated throughout the urbanized area. The <strong>Chicago</strong>-<br />
Washington site was located in highly industrialized Southeast <strong>Chicago</strong> in an area<br />
impacted by numerous large point source (industrial) emissions. The Lemont site was<br />
located on the southwestern edge of the metropolitan area in an area impacted by<br />
refineries and chemical manufacturing facilities.<br />
The review of the monitoring results for each of the target compounds, as recorded at<br />
each monitoring site, provided the following findings:<br />
1. The average concentrations of target compounds measured at the O’Hare<br />
<strong>Airport</strong> sites were found to be comparable to those measured at the other<br />
metropolitan area sites.<br />
This fact is readily seen from the data presented in Table 1 and from Figures<br />
2a and 2b which graphically display the five site results for various target<br />
compounds. As the figures show, the highest concentration of the individual<br />
target compounds was found to vary between different sampling sites. For<br />
example, highest levels of benzene were found at <strong>Chicago</strong>-Washington, while<br />
highest acetaldehyde levels were at Bensenville and highest formaldehyde<br />
levels at Schiller Park. Generally, the levels of the target compounds were<br />
found to be comparable between the five sites. For example, benzene<br />
averages ranged from 0.33 to 0.69 ppbv, acetaldehyde from 0.60 to 1.07 ppbv,<br />
formaldehyde from 1.67 to 3.54 ppbv and polycyclic organics (PAHs) levels<br />
ranged from 140 to 298 nanograms per cubic meter.<br />
2. Of the five monitoring sites, the highest levels of more target compounds was<br />
found at the <strong>Chicago</strong>-Washington site found than any other site.<br />
Using a difference of 20% to indicate a significantly higher value (that is, the<br />
highest average found was at least 20% higher than the average found at any<br />
other site), the <strong>Chicago</strong>-Washington site was found to have the highest levels<br />
of seven target compounds including benzene, chromium, polycyclic organics<br />
and dioxins. Table 2 presents a listing by site of target compounds that were<br />
found to be 20% higher at one site. Four of the five sites recorded the highest<br />
concentration of at least one compound, with Schiller Park recording the<br />
highest level of three targets, Bensenville with three targets and Northbrook<br />
recording the highest levels of one target.<br />
Taken as a group of target compounds, these data indicate that the highest<br />
concentration of <strong>air</strong> toxic compounds in the <strong>Chicago</strong> area was found in<br />
industrialized Southeast <strong>Chicago</strong>, not around O’Hare <strong>Airport</strong>.<br />
3. Two target compounds, acetaldehyde and formaldehyde, were found to be<br />
higher at the O’Hare <strong>Airport</strong> sites than at any of the other <strong>Chicago</strong> area sites.<br />
7
Figure 2a<br />
Comparison of Results by Site<br />
Formaldehyde<br />
Acetaldehyde<br />
Average (ppb)<br />
4.00<br />
3.50<br />
3.00<br />
2.50<br />
2.00<br />
1.50<br />
1.00<br />
0.50<br />
0.00<br />
B S C N L<br />
Average (ppb)<br />
1.20<br />
1.00<br />
0.80<br />
0.60<br />
0.40<br />
0.20<br />
0.00<br />
B S C N L<br />
Chromium<br />
Nickel<br />
Average (ng/m3)<br />
10.0<br />
9.0<br />
8.0<br />
7.0<br />
6.0<br />
5.0<br />
4.0<br />
3.0<br />
2.0<br />
1.0<br />
0.0<br />
B S C N L<br />
Average (ng/m3)<br />
10.0<br />
9.0<br />
8.0<br />
7.0<br />
6.0<br />
5.0<br />
4.0<br />
3.0<br />
2.0<br />
1.0<br />
0.0<br />
B S C N L<br />
Benzene<br />
Average (ppb)<br />
0.80<br />
0.70<br />
0.60<br />
0.50<br />
0.40<br />
0.30<br />
0.20<br />
0.10<br />
0.00<br />
B S C N L<br />
Site Listing<br />
B - Bensenville<br />
S - Schiller Park<br />
C - <strong>Chicago</strong> Washington<br />
N - Northbrook<br />
L - Lemont<br />
8
Figure 2b<br />
Comparison of Results by Site<br />
Perchloroethylene<br />
Trichloroethylene<br />
0.70<br />
1.40<br />
0.60<br />
1.20<br />
Average (ppb)<br />
0.50<br />
0.40<br />
0.30<br />
0.20<br />
Average (ppb)<br />
1.00<br />
0.80<br />
0.60<br />
0.40<br />
0.10<br />
0.20<br />
0.00<br />
B S C N L<br />
0.00<br />
B S C N L<br />
PAHs<br />
Dioxin<br />
300<br />
3.00<br />
Average (ng/m3)<br />
250<br />
200<br />
150<br />
100<br />
50<br />
0<br />
NA<br />
B S C N L<br />
Average (pg/m3)<br />
2.50<br />
2.00<br />
1.50<br />
1.00<br />
0.50<br />
0.00<br />
NA<br />
B S C N L<br />
Toluene<br />
Average (ppb)<br />
2.00<br />
1.80<br />
1.60<br />
1.40<br />
1.20<br />
1.00<br />
0.80<br />
0.60<br />
0.40<br />
0.20<br />
0.00<br />
B S C N L<br />
Site Listing<br />
B - Bensenville<br />
S - Schiller Park<br />
C - <strong>Chicago</strong> Washington<br />
N - Northbrook<br />
L - Lemont<br />
NA - Samples not taken for these compounds<br />
9
The highest acetaldehyde levels were measured at Bensenville with an<br />
average of 1.07 ppbv compared to the next highest average of 0.88 ppbv<br />
recorded at Schiller Park and Lemont. The highest formaldehyde level<br />
recorded was at Schiller Park at 3.54 ppbv compared to the next highest value<br />
of 2.16 ppbv measured at Bensenville. These data indicated that the<br />
highest levels of aldehydes found during this monitoring study<br />
occurred around O’Hare <strong>Airport</strong>.<br />
The major source of aldehyde emissions in any large metropolitan area has<br />
been shown to be from mobile sources: cars, trucks and <strong>air</strong>craft. The area in<br />
and around O’Hare <strong>Airport</strong> has a concentration of cars and trucks on the<br />
expressways (I-90 and I-294), major arterials (Mannhiem, Irving Park and<br />
Higgins Roads) and in traffic entering and leaving the <strong>air</strong>port. <strong>Airport</strong><br />
operations including <strong>air</strong>craft takeoffs, landings, taxiing, refueling and<br />
support equipment emissions are also sources of aldehydes. With the<br />
accumulation of these emissions in the area, elevated concentrations of<br />
aldehydes in the surrounding area would not be unexpected and was likely the<br />
influencing factor in the levels measured at Bensenville and Schiller Park.<br />
4. The lowest concentrations of most target compounds were measured at the<br />
Lemont site.<br />
While it is near major emission sources such as refineries and chemical plants,<br />
Lemont is located southwest of the <strong>Chicago</strong> urban area and lies predominantly<br />
upwind of it, measuring levels entering the area from downstate and outside<br />
the area impacted by the <strong>Chicago</strong> area emissions. As a result, it would be<br />
expected, as the monitoring data showed, that <strong>air</strong> toxic levels in Lemont are<br />
lower than the other monitoring sites located in the urbanized area.<br />
3.3 Comparison of Results to Other U.S. Cities<br />
A comparison of the measured levels of certain target <strong>air</strong> toxic compounds found in<br />
<strong>Chicago</strong> to those found in other large U.S. cities provided a point of reference to what<br />
concentrations might be considered as “typical” for an urban area. The comparative<br />
analyses also identified any unusual or atypical compound measurements for the <strong>Chicago</strong><br />
area.<br />
The other U.S. cities data was extracted from USEPA’s AIRS database that contains <strong>air</strong><br />
quality data collected and reported nationwide. The most recent data reported to AIRS<br />
was almost exclusively 1999, as no 2000 data had yet been reported, and was used for<br />
reference in this report. The averages reported from AIRS were based upon sampling<br />
periods of six to twelve months, consistent with and comparable to the six month average<br />
data compiled from the June-December 2000 sampling in <strong>Chicago</strong>.<br />
10
A review of the information submitted to AIRS found that data for a limited number of<br />
the target <strong>air</strong> toxic compounds, obtained primarily from PAMS monitoring networks, had<br />
been reported for several large urbanized areas, including Atlanta, Detroit, Houston,<br />
Milwaukee and New York City. The target compound data reported for these cities<br />
included acetaldehyde, benzene, formaldehyde, toluene and xylenes. The AIRS data<br />
used in the comparative analysis has been summarized in Table 3. A review and analysis<br />
of the available information concluded the following:<br />
1. Compared to other major metropolitan areas; e.g., Atlanta, Detroit, Houston<br />
and Milwaukee, concentrations of key “target” <strong>air</strong> toxic compounds were<br />
found to be comparable or lower in the <strong>Chicago</strong> metropolitan area. The<br />
comparative analysis indicated that the levels found at the <strong>Chicago</strong> area<br />
sites were typical of those found in the other large urban areas.<br />
The data from Table 3 and the corresponding compound data from Table 1<br />
has been graphically displayed in Figure 3. The highest formaldehyde levels<br />
were found in Atlanta and Detroit, 5.72 and 5.13 ppbv respectively, compared<br />
to 3.54 ppbv at Schiller Park, the highest <strong>Chicago</strong> area site. The highest<br />
acetaldehyde levels were found in Atlanta and Houston, 2.40 and 1.69 ppbv,<br />
compared to 1.07 ppbv at Bensenville. The highest benzene levels were found<br />
in Houston and Detroit, 0.97 and 0.70 ppbv, compared to 0.69 ppbv at<br />
<strong>Chicago</strong>-Washington. The highest levels of toluene were found in New York<br />
City at 1.34 ppbv, compared to 1.99 ppbv at Bensenville. The highest levels<br />
of xylenes were found in Atlanta at 1.22 ppbv compared to 0.90 ppbv at<br />
Bensenville.<br />
2. The comparative analysis shows that target <strong>air</strong> toxic compounds measured in<br />
the <strong>Chicago</strong> area to be typical of other large urban areas. The concentrations<br />
of some key target compounds were found to be significantly higher in cities<br />
like Atlanta and Houston. The acetaldehyde and formaldehyde levels<br />
measured at O’Hare, while the highest of <strong>Chicago</strong> area sites, were well below<br />
those found in Atlanta, Detroit, and Houston.<br />
3.4 O’Hare <strong>Airport</strong> Impact<br />
In order to assess the possible impact of O’Hare <strong>Airport</strong> emissions in areas adjacent to<br />
the <strong>air</strong>port, two monitoring sites were deployed on different sides of the <strong>air</strong>port. This<br />
allowed for collection of sampling data on days with persistent winds that impacted one<br />
site but not the other. Essentially, one site was upwind, unaffected by the <strong>air</strong>port, and the<br />
other site was downwind of the <strong>air</strong>port and subjected to its emissions. See the following<br />
diagram. The difference in the results obtained from the downwind site (impacted by<br />
emissions) and the upwind site (unaffected) provides an indication of the increased levels<br />
of target compounds associated with the <strong>air</strong>port’s emissions. For example, the downwind<br />
site measured a compound concentration at 1.50 ppb and the upwind site reported only<br />
1.00 ppb, providing a difference of 0.50 ppb (1.50 minus 1.00) or that levels were found<br />
to be 50% higher at the downwind site (0.50 divided by 1.00).<br />
11
WIND<br />
X<br />
Upwind<br />
Site<br />
EMISSION<br />
SOURCE<br />
X<br />
Downwind<br />
Site<br />
Of the sixteen sampling days, five days did have wind-persistent conditions that allowed<br />
for a upwind /downwind analysis. The sampling data obtained for each of the five days<br />
for key target compounds has been presented in Figure 4 along with wind roses (wind<br />
frequency distribution) that depict the associated wind direction data. Figure 4 also<br />
provides for each target compound the average value obtained from the five samples for<br />
the wind positive site and the wind negative site and the calculated percent difference<br />
(wind positive to wind negative). The Figure 4 wind roses illustrate the site impacts,<br />
Bensenville located southwest of the <strong>air</strong>port impacted by winds from the north to east,<br />
and Schiller Park located east of the <strong>air</strong>port impacted by winds from the southwest to<br />
northwest.<br />
The data analysis demonstrated that O’Hare <strong>Airport</strong> emissions had an impact in the areas<br />
adjacent to the <strong>air</strong>port for several key target compounds, including acetaldehyde,<br />
benzene, formaldehyde, polycyclic organics and lead. All these compounds are Urban<br />
Air <strong>Toxic</strong>s and have been identified as associated with <strong>air</strong>port operations. The<br />
downwind concentration of acetaldehyde was found to be 45.6% higher than upwind,<br />
formaldehyde was 32.8% higher, benzene was 34.1% higher, polycyclics (PAHs) were<br />
65.9% higher and lead was 87.5% higher. An impact from <strong>air</strong>port operations was not<br />
unexpected as <strong>air</strong>port operations, including <strong>air</strong>craft takeoffs, landings, taxiing, refueling<br />
and use of support equipment, result in significant emissions of volatile organics and<br />
target <strong>air</strong> toxic compounds. The resulting <strong>air</strong>port emissions should have had, as the<br />
monitoring data shows, some impact in the areas adjacent to the <strong>air</strong>port. While the<br />
downwind concentrations were found to be higher, the results showed that the levels<br />
found at O’Hare <strong>Airport</strong> are still in the “typical urban” range and lower than levels found<br />
in other large urban areas.<br />
Appendix IV provides a detailed summary of the meteorological conditions which were<br />
present on each of the sampling days. The appendix also includes a summary table that<br />
provides for each sampling day the frequency distribution of hourly wind data, which has<br />
also been plotted in a wind rose shown in Figure 5. As can be seen from that summary<br />
table, the most prevalent wind directions on sampling days were winds from the west<br />
southwest, west and the northeast. These three wind directions provided the opportunity<br />
for frequent impact of <strong>air</strong>port emissions on the two O’Hare area monitoring sites.<br />
12
Figure 3<br />
Comparison of Results to Other U.S. Cities<br />
Formaldehyde<br />
Acetaldehyde<br />
6.00<br />
2.50<br />
Average (ppb)<br />
5.00<br />
4.00<br />
3.00<br />
2.00<br />
1.00<br />
Average (ppb)<br />
2.00<br />
1.50<br />
1.00<br />
0.50<br />
0.00<br />
A D H M NY B S C<br />
0.00<br />
A D H M NY B S C<br />
Benzene<br />
Toluene<br />
Average (ppb)<br />
1.00<br />
0.90<br />
0.80<br />
0.70<br />
0.60<br />
0.50<br />
0.40<br />
0.30<br />
0.20<br />
0.10<br />
0.00<br />
A D H M NY B S C<br />
Average(ppb)<br />
2.00<br />
1.50<br />
1.00<br />
0.50<br />
0.00<br />
A D H M NY B S C<br />
Xylene<br />
1.40<br />
1.20<br />
Site Listing<br />
Average (ppb)<br />
1.00<br />
0.80<br />
0.60<br />
0.40<br />
0.20<br />
0.00<br />
A D H M NY B S C<br />
A - Atlanta<br />
D - Detroit<br />
H - Houston<br />
M - Milwaukee<br />
NY - New York<br />
B - Bensenville<br />
S - Schiller Park<br />
C - <strong>Chicago</strong> Washington<br />
13
Figure 4<br />
Wind Persistence Days<br />
Upwind/Downwind Analysis<br />
Downwind<br />
Upwind<br />
Percent<br />
Compound 7/23 8/16 9/21 11/20 12/14 Avg 7/23 8/16 9/21 11/20 12/14 Avg Difference<br />
Formaldehyde 2.56 3.32 1.64 0.94 3.09 2.31 1.72 3.04 1.89 0.32 1.73 1.74 32.8%<br />
Acetaldehyde 1.29 1.33 0.56 0.36 1.73 1.05 0.53 0.76 1.00 0.23 1.10 0.72 45.6%<br />
Benzene 0.90 0.24 0.19 1.07 0.60 0.50 0.09 0.13 1.07 0.45 34.1%<br />
PAH(s) 311 175 48 126 440 220 220 10 37 46 350 133 65.9%<br />
Lead 30 60 10 20 30 30 10 10 20 20 20 16 87.5%<br />
Toluene 2.50 0.31 0.16 1.63 1.15 1.00 0.21 0.10 2.52 0.96 20.1%<br />
Chromium 5 6 5 5 5 5 5 7 2 3 3 4 30.0%<br />
Xylenes 1.20 0.25 0.15 1.33 0.73 0.60 0.07 0.02 1.61 0.58 27.4%<br />
Bensenville Downwind<br />
Sampling Days<br />
Schiller Park Downwind<br />
Sampling Days<br />
NW<br />
NNW<br />
N<br />
25.0<br />
20.0<br />
15.0<br />
NNE<br />
NE<br />
NW<br />
NNW<br />
N<br />
35.0<br />
30.0<br />
25.0<br />
20.0<br />
NNE<br />
NE<br />
WNW<br />
10.0<br />
5.0<br />
ENE<br />
WNW<br />
15.0<br />
10.0<br />
5.0<br />
ENE<br />
W<br />
0.0<br />
E<br />
W<br />
0.0<br />
E<br />
WSW<br />
ESE<br />
WSW<br />
ESE<br />
SW<br />
SE<br />
SW<br />
SE<br />
SSW<br />
S<br />
SSE<br />
SSW<br />
S<br />
SSE<br />
Calm - 1.4%<br />
axis represents percent of time<br />
14
Figure 5<br />
Wind Rose <strong>O'Hare</strong> <strong>Toxic</strong> Project<br />
June - December, 2000<br />
Sampling Days Only<br />
NNW<br />
12.0<br />
N<br />
NNE<br />
10.0<br />
NW<br />
8.0<br />
NE<br />
WNW<br />
W<br />
6.0<br />
4.0<br />
2.0<br />
0.0<br />
ENE<br />
E<br />
WSW<br />
ESE<br />
SW<br />
SE<br />
SSW<br />
S<br />
SSE<br />
Axis represents percent of time<br />
Calm = 0.5 %<br />
15
Section 4.0 Conclusions<br />
Based upon the review of the <strong>air</strong> toxics monitoring data collected near <strong>Chicago</strong> O’Hare<br />
<strong>Airport</strong> and from other <strong>Chicago</strong> area monitoring sites and data from USEPA’s AIRS<br />
database, the following conclusions were reached:<br />
1. The levels of <strong>air</strong> toxic compounds found near O’Hare <strong>Airport</strong> and at other<br />
sites in the <strong>Chicago</strong> metropolitan area are “typical” or lower that those levels<br />
found in other large U.S. cities.<br />
2. Of the <strong>Chicago</strong> area sites, the highest levels of acetaldehyde and<br />
formaldehyde were found at the O’Hare <strong>Airport</strong> sites. However, the<br />
concentrations found were at levels comparable or lower than those found in<br />
other large U.S. cities.<br />
3. Of the <strong>Chicago</strong> area sites, the highest levels of most <strong>air</strong> toxic compounds was<br />
not found near O’Hare <strong>Airport</strong>, but in industrialized Southeast <strong>Chicago</strong>.<br />
4. An analysis of data from the sites near O’Hare <strong>Airport</strong> found that emissions<br />
from the <strong>air</strong>port have an impact on <strong>air</strong> quality in the areas adjacent to the<br />
<strong>air</strong>port. However, the <strong>air</strong>port’s impact did not result in levels higher than<br />
those found in a typical urban environment.<br />
The data collected through this study’s <strong>air</strong> monitoring program indicated that the toxics<br />
<strong>air</strong> quality in the vicinity of O’Hare <strong>Airport</strong> is comparable to the <strong>air</strong> quality in other parts<br />
of <strong>Chicago</strong> and comparable to <strong>air</strong> quality in other major urban areas.<br />
There are continuing efforts to identify, assess and reduce risk from <strong>air</strong> toxics, especially<br />
in urban areas. For example, USEPA has completed a nationwide study of potential<br />
inhalation exposures and health risks associated with 32 HAPs and from diesel particulate<br />
matter based on 1996 <strong>air</strong> emissions inventories, known as the National-Scale Air <strong>Toxic</strong>s<br />
Assessment (NATA). This study has not yet been released to the public, but it will serve<br />
as a basis for characterizing risk associated with these compounds on a county by county<br />
level throughout the U.S. As a continuing part of the federal Clean Air Act requirements<br />
to identify, assess and reduce risk from toxic pollutants, USEPA has also developed the<br />
National Strategy. Part of the National Strategy is to develop a plan that will attain a<br />
75% reduction in the incidence of cancer attributable to exposure to HAPs emitted by<br />
stationary sources, to attain a substantial reduction in public health risks posed by<br />
exposure to HAP emissions from area sources, and to address disproportionate impacts of<br />
<strong>air</strong> toxics across urban areas. USEPA has announced that part of the regulatory actions to<br />
implement this strategy will include, among others, the development and implementation<br />
of maximum achievable control technology or MACT standards to reduce emissions of<br />
HAPs from major source categories beyond those already required under section 112 (d)<br />
of the Clean Air Act, developing area source standards, and regulating motor vehicle<br />
emissions and fuels. Moreover, the <strong>Chicago</strong> Area Cumulative Risk Initiative (CRI) is an<br />
ongoing community-based effort to assess cumulative <strong>air</strong> pollution hazards and to then<br />
16
develop strategies to reduce risks posed by exposure in the Cook County, <strong>Illinois</strong> and<br />
Lake County, Indiana. USEPA and the <strong>Illinois</strong> EPA are cooperating in this effort, and an<br />
assessment of the risks identified is expected to be released in the Summer of 2002.<br />
In addition to these efforts, the development and implementation of MACT standards<br />
required under Section 112 (d) of the Clean Air Act are ongoing. For example, USEPA<br />
has published over 70 <strong>air</strong> toxic MACT standards affecting over 113 categories of<br />
industrial sources, with varying implementation schedules. By May 15, 2002, USEPA<br />
will have published 106 MACT standards affecting a total of 174 categories of industrial<br />
sources. After publishing a MACT for a source category, the Clean Air Act also requires<br />
USEPA to assess and address the remaining risk from these source categories after the<br />
implementation of the MACT standard and within eight to nine years after the<br />
development of the initial standard. This effort is now ongoing for the earliest MACT<br />
standards. In addition to the efforts to address stationary sources, USEPA continues to<br />
address toxic emissions from motor vehicles and fuels, a major component of toxic<br />
emissions from O’Hare. USEPA has also promulgated the final rule for “Control of<br />
Emissions of Hazardous Air Pollutants from Mobile Sources” under Section 202(l) of the<br />
Clean Air Act.<br />
Section 5.0 References<br />
1. USEPA, “National Air <strong>Toxic</strong>s <strong>Program</strong>: The Integrated Urban Strategy”, Federal<br />
Register/Vol. 64, No. 137/ Monday, July 19, 1999.<br />
2. City of Park Ridge, “Preliminary Study and Analysis of <strong>Toxic</strong> Air Pollutant<br />
Emissions from O’Hare International <strong>Airport</strong> and the Resulting Health Risks Created<br />
by these <strong>Toxic</strong> Emissions in Surrounding Residential Communities, Volumes I-IV,<br />
August, 2000.<br />
3. USEPA, “Unified Air <strong>Toxic</strong>s Website”, Technology Transfer Network (TTNWeb).<br />
17
Table 1<br />
Air <strong>Toxic</strong> Target Compound Results*<br />
June - December, 2000<br />
Compound<br />
Bensenville Schiller Park <strong>Chicago</strong>-Washington<br />
Northbrook<br />
Lemont<br />
acetaldehyde 1.07 0.88 0.72 0.60<br />
0.88<br />
acrolein 0.00 0.00 0.01 0.01<br />
0.00<br />
arsenic 1 1.10 1.00 1.00 0.70<br />
0.70<br />
benzene 0.55 0.50 0.69 0.33<br />
0.45<br />
beryllium 1 0.30 0.50 0.46 0.30<br />
0.10<br />
1,3-butadiene 0.08 0.11 0.12 0.02<br />
0.02<br />
cadmium 1 2.20 2.70 2.60 2.10<br />
2.00<br />
carbon tetrachloride 0.07 0.07 0.08 0.07<br />
0.06<br />
chloroform 0.18 0.44 0.55 0.14<br />
0.01<br />
chromium 1 4.50 7.10 9.20<br />
3.50<br />
2.90<br />
ethylene dichloride 0.25 0.26 0.15 0.25<br />
0.00<br />
formaldehyde 2.16 3.54 1.90 1.67<br />
1.67<br />
lead 1 22.7 16.7 31.5 12.0<br />
14.4<br />
manganese 25.7 31.5 139.9 17.5<br />
25.1<br />
methylene chloride 0.46 0.07 0.47 0.27<br />
0.23<br />
nickel 1 7.00 8.60 6.80 5.30<br />
4.60<br />
1,1,2,2-tetrachloroethane 0.00 0.00 0.00 0.00<br />
0.00<br />
perchloroethylene 0.52 0.34 0.52 0.61<br />
0.05<br />
trichloroethylene 1.37 0.66 0.65 0.59<br />
0.03<br />
toluene 1.99 1.02 0.97 0.80<br />
0.77<br />
vinyl chloride 0.00<br />
0.00 0.00 0.00<br />
0.00<br />
xylenes (O,M,P) 0.90 0.61 0.53<br />
0.42<br />
0.56<br />
polycyclic organics (PAH) 1 172.0 171.0 298.0 140.0<br />
NA<br />
dioxins (2,3,7,8 total) 2<br />
1.399 1.464 2.389 1.956<br />
NA<br />
1 values expressed in nanograms per cubic meter (ng/m 3 )<br />
2 values expressed in in picograms per cubic meter (pg/m 3 )<br />
*values are averages expressed in parts per billion by volume (ppbv) unless otherwise indicated<br />
18
Table 2<br />
Urban Air <strong>Toxic</strong> Compounds<br />
Sites with Highest Concentration*<br />
<strong>Chicago</strong>-Washington Bensenville Schiller Park<br />
Northbrook<br />
Lemont<br />
benzene formaldehyde acetaldehyde<br />
chloroform nickel trichloroethylene<br />
chromium toluene xylenes<br />
lead<br />
manganese<br />
polycyclic organics<br />
dioxins<br />
perchloroethylene<br />
none<br />
*Concentration of the target compound was found to be at least 20% higher than all other sites.<br />
19
Table 3<br />
Air <strong>Toxic</strong> Data for U.S. Cities<br />
1999 AIRS Data 1<br />
Atlanta Detroit Houston New York Milwaukee <strong>Chicago</strong> 3<br />
Pollutant (GA) (MI) (TX) City (WI) Study<br />
acetaldehyde 2.40 1.29 1.69 0.96 1.02 1.07<br />
benzene 0.52 0.70 0.97 0.53 0.38 0.69<br />
1-3 butadiene NR 0.10* 0.52 NR 0.13 2 0.12<br />
formaldehyde 5.72 5.13 4.14 2.96 2.50 3.54<br />
xylenes (m/p) 1.22 0.34 0.47 0.92 0.53 2 0.90<br />
toluene 0.98 0.84 1.06 1.34 0.84 2 1.99<br />
1 all values reported in parts per billion volume (ppbv)<br />
*value reported from Midland, MI<br />
NR - Not Reported<br />
2 values reported in 1998 Wisconsin DNR Report<br />
3 highest value reported at any of the five <strong>Chicago</strong> Study sites<br />
20
Appendix I<br />
Description of <strong>Monitoring</strong> sites<br />
Bensenville<br />
This monitoring site is located on the Village of Bensenville sewage treatment plant at<br />
711 E. Jefferson. Industrial/commercial areas are located east of the site (0.5 – 1.0 km).<br />
Immediately southwest are residential areas. A large railyard is located 0.5 – 1.0 km<br />
northeast to east. The closest runway at O’Hare <strong>Airport</strong> is located 2.5 km to the<br />
northeast. Irving Park Road is 1.2 km to the north and Mannheim Road is 1.7 km to the<br />
southeast at its closest point. The <strong>Chicago</strong> loop is approximately 25 km to the southeast.<br />
The following picture is from Bensenville looking northeast.<br />
21
Schiller Park<br />
This monitoring site is located on a trailer at 4743 Mannheim Road just south or<br />
Lawrence Ave. and between Mannheim Road and I-294. The closest runway at O’Hare<br />
<strong>Airport</strong> is 0.5 km to the northwest. The immediate vicinity is mostly commercial.<br />
Residential areas are located east across I-294. Mannheim Road is 30 m to the west and<br />
I-294 is 100 m to the east. The <strong>Chicago</strong> loop is located approximately 21 km to the<br />
southeast. The following picture is from Schiller Park looking northwest.<br />
22
<strong>Chicago</strong> – Washington High School<br />
This monitoring site is located on Washington High School at 3535 E. 114 th Street in the<br />
Lake Calumet industrial region. Residential areas are located east of the site (from north<br />
to south). Industrial areas are located west (northwest to southwest) of the site. The<br />
Indiana border is approximately 1 km to the east. The <strong>Chicago</strong> loop is approximately 23<br />
km to the northwest. The following picture is from Washington H.S. looking northwest.<br />
23
Northbrook<br />
The village of Northbrook is located in northeast Cook County. This monitoring site is<br />
located at the Northbrook Water Filtration Station at 750 Dundee Road. A forest<br />
preserve is located immediately south with residential areas further south (southeast to<br />
southwest). Residential areas are also immediately to the west. Commercial areas are<br />
located along Dundee Road and to the east. A major expressway (I94) is located 1 km to<br />
the east and north. O’Hare <strong>Airport</strong> is located 18 km to the southwest and the <strong>Chicago</strong><br />
loop is located 32 km to the southeast. The following picture is from the Northbrook site<br />
looking northeast.<br />
24
Lemont<br />
The village of Lemont is located in southwest Cook County approximately 38 km from<br />
the <strong>Chicago</strong> loop. This monitoring site is located on Lemont High School at 800 Porter<br />
Street. The building is situated on the edge of the bluffs overlooking the Des Plaines<br />
River valley. The area surrounding the site is residential to the south (southwest to<br />
southeast) and to the immediate north (down the bluff). Several industrial and<br />
commercial facilities are located along the Des Plaines River to the west and southwest in<br />
the valley. The following picture is from the Lemont site looking north.<br />
25
Appendix II<br />
<strong>Toxic</strong> Air Pollutants<br />
HAPs<br />
Analytical<br />
Method<br />
HAPs<br />
Category I Volatile Organics (VOC) Category IV Semi-volatiles<br />
Analytical<br />
Method<br />
benzene TO-14A/TO-15 acenaphthene TO-13A<br />
carbon tetrachloride TO-14A-TO-15 acenaphthylene TO-13A<br />
chloroform TO-14A/TO-15 anthracene TO-13A<br />
chloroprene TO-14A-TO-15 benzo(ghi)perylne TO-13A<br />
1,4-dichlorobenzene TO-14A-TO-15 fluoranthene TO-13A<br />
ethylene dibromide TO-14A-TO-15 fluorene TO-13A<br />
ethylene dichloride TO-14A-TO-15 naphthalene TO-13A<br />
hexachlorobenzene TO-14A-TO-15 phenanthrene TO-13A<br />
methyl bromide TO-14A-TO-15 pyrene TO-13A<br />
methyl chloride TO-14A-TO-15 benz(a)anthracene TO-13A<br />
styrene TO-14A-TO-15 benzo(a)pyrene TO-13A<br />
tetrachloroethylene TO-14A-TO-15 benzo(b)fluoranthene TO-13A<br />
toluene TO-14A-TO-15 benzo(k)fluoranthene TO-13A<br />
trichloroethylene TO-14A-TO-15 chrysene TO-13A<br />
vinyl chloride TO-14A-TO-15 dibenz(a,h)anthracene TO-13A<br />
xylenes TO-14A-TO-15 indeno(1,2,3-cd)pyrene TO-13A<br />
1,3-butadiene TO-14A-TO-15 2,3,7,8-Tetrachlorodibenzo-p<br />
acrylonitrile TO-14A-TO-15 -dioxin (and congeners and TCDF TO-13A<br />
congeners)<br />
----------------------------------------------------------------------------------------------------------------<br />
Category II Carbonyls Category V Metals<br />
acetaldehyde TO-11A antimony & compounds IO-3.5<br />
acrolein TO-11A arsenic & compounds IO-3.5<br />
formaldehyde TO-11A beryllium & compounds IO-3.5<br />
cadimum & compounds<br />
IO-3.5<br />
chromium & compounds*<br />
IO-3.5<br />
lead & compounds<br />
IO-3.5<br />
manganese & compounds<br />
IO-3.5<br />
mercury & compounds<br />
IO-3.5<br />
nickel & compounds<br />
IO-3.5<br />
*Chromium determined from a filter is total chromium, not chromium VI. Chromium VI<br />
oxidizes when sampled on a filter.<br />
26
Appendix IIIA<br />
Bensenville Air <strong>Toxic</strong> Data *<br />
Urban Air <strong>Toxic</strong> Compounds<br />
6/17 6/29 7/11 7/23 8/4 8/16 8/28 9/9 9/21 10/3 10/18 10/31 11/8 11/20 12/14 12/26 Average<br />
acetaldehyde 0.43 1.29 1.82 1.33 1.62 1.02 1 1.53 1.19 1.31 0.45 0.23 1.1 0.63 1.07<br />
acrolein 0 0 0 0 0 0 0 0 0 0.04 0 0 0 0 0.00<br />
acrylonitrile 0 0 0 0 0 0 0 0 0.00<br />
arsenic 1 1 1 1 2 2 0 1 0 4 0 1 0 1 1 1.1<br />
benzene 0.3 0.3 0.9 0.09 0.61 1.51 0.42 0.22 0.13 1.07 0.5 0.55<br />
beryllium (1) 0 3 0 0 0 0 0 0 1 0 0 0 0 0 0 0.3<br />
1,3-butadiene 0 0 0 0 0.11 0.43 0 0 0 0.3 0.08 0.08<br />
cadmium (1) 2 2 2 2 2 2 2 1 2 2 2 3 3 3 3 2.2<br />
carbon tetrachloride 0 0.04 0.09 0.04 0.1 0.1 0.08 0.11 0.07<br />
chloroform 0 2 0 0 0 0 0 0 0 0 0 0.18<br />
chromium (1) 5 5 5 7 6 6 2 2 7 6 6 3 3 3 1 4.5<br />
1,2-dibromoethane 0 0.5 0.6 0 0 0 0 0 0 0 0 0.10<br />
1,2-dichloropropane 0 0 0.4 0 0 0 0 0 0 0 0 0.04<br />
1,2-dichloropropene 0 0 0.7 0 0 0 0 0 0 0 0 0.06<br />
1,2-dichloroethane 0 0 2.7 0 0 0 0 0 0 0 0 0.25<br />
formaldehyde 1.2 2.56 4.17 3.32 4.03 2.31 1.89 3.01 1.72 1.98 0.81 0.32 1.73 1.14 2.16<br />
lead (1) 10 10 30 30 60 20 10 20 30 20 40 10 20 20 10 22.7<br />
manganese (1) 8 14 2 33 43 52 18 12 45 38 67 14 19 17 3 25.7<br />
methylene chloride 0 0 1.6 0 0.38 2.34 0.26 0.16 0 0.26 0.07 0.46<br />
nickel (1) 6 5 7 9 11 8 5 4 10 8 10 6 7 5 4 7.0<br />
polycyclic organics(PAH) (1) 157 311 220 175 95 37 136 85 319 220 46 350 90 172<br />
1,1,2,2-tetrachloroethane 0 0 0 0 0 0 0 0 0 0 0 0.00<br />
perchloroethylene 0.1 1.2 3.2 1.1 0 0.08 0.26 0 0.16 0 0.09 0 0.52<br />
trichloroethylene 1 4.4 4.7 0 0.27 2.81 0 1.47 0 0.4 0.04 1.37<br />
vinyl chloride 0 0 0 0 0 0 0 0 0 0 0 0.00<br />
dioxins(2,3,7,8) (2) 0.156 0.742 0.584 2.09 1.58 2.24 1.53 1.7 0.228 2.59 1.33 2.36 1.06 1.399<br />
furans(2,3,7,8) (2) 0.066 0.165 0.15 0.646 0.25 0.25 0.226 0.143 0.107 0.304 0.475 0.616 0.259 0.281<br />
27
Appendix IIIA<br />
Bensenville Air <strong>Toxic</strong> Data *<br />
Hazardous Air Pollutants<br />
6/17 6/29 7/11 7/23 8/4 8/16 8/28 9/9 9/21 10/3 10/18 10/31 11/8 11/20 12/14 12/26 Average<br />
1,4-dichlorobenzene 0 0.2 0.9 0 0 0 0 0 0 0.08 0 0.11<br />
1,2,4-trimethylbenzene 0 0.1 0.4 0 0.57 1 0.18 0.09 0 0.66 0.09 0.28<br />
1,3,5-trimethylbenzene 0.1 0.1 0.2 0 0.2 0.32 0.05 0.02 0 0.23 0.02 0.11<br />
ethyl benzene 0.06 0.1 0.3 0 0.31 0.71 0.18 0.06 0.02 0.35 0.07 0.20<br />
hexachlorobutadiene 0 0.2 0 0 0 0 0 0 0 0 0 0.02<br />
methyl bromide 0 0 0 0 0 0 0 0 0 0 0 0.00<br />
styrene 0.2 0.2 0.06 0 0.06 0.26 0 0.07 0 0.06 0 0.08<br />
toluene 0.6 1.1 2.1 2.5 5.6 0.21 2.87 5.28 1.17 1.19 0.1 2.52 0.68 1.99<br />
xylenes 0.4 0.5 1.2 1.3 0.07 1.35 3.04 0.65 0.28 0.02 1.61 0.34 0.90<br />
propionaldehyde 0 0 0 0 0 0 0 0 0 0 0 0 0 0 0.00<br />
crotonaldehyde 0 0 0 0 0 0 0 0 0 0 0 0 0 0 0.00<br />
butyraldehyde 0 0 0 0 0 0 0 0 0 0 0 0 0 0 0.00<br />
isovaleraldehyde 0 0 0 0 0 0 0 0 0 0 0 0 0 0 0.00<br />
valeraldehyde 0 0 0 0 0 0 0 0 0 0 0 0 0 0 0.00<br />
tolualdehydes 0 0 0 0 0 0 0 0 0 0 0 0 0 0 0.00<br />
hexanaldehyde 0 0 0 0 0 0 0 0 0 0 0 0 0 0 0.00<br />
2,5-dimethylbenzaldehyde 0 0 0 0 0 0 0 0 0 0 0 0 0 0 0.00<br />
acenaphthene (1) 8.7 33.1 19.1 13 6.2 1.7 7.4 2.7 15.8 9.5 1.2 5.8 1.6 9.7<br />
acenaphthylene (1) 0 0 0 0 0 0 0 0 6.4 19.2 0 9.8 0 2.7<br />
anathracene (1) 0 0 0 0 0 0 0 0 0 0 0 0 0 0.0<br />
benzo(ghi)perylene (1) 0 0 0 0 0 0 0 0 0 0 0 0 0 0.0<br />
fluoranthene (1) 9.1 7.5 10.1 8.2 3.6 1.5 3.4 1.4 4.5 6 1.3 3.3 1.5 4.7<br />
fluorene (1) 12.2 31.7 20.9 14 9.2 2.5 8.4 3.6 15.4 14.4 1.9 9.4 3.4 11.3<br />
naphthalene (1) 75.1 144 89.5 88 49.5 20.8 89.7 64 238 127 37.2 294 73.5 106.9<br />
phenanthrene (1) 46.8 90.5 70.2 42.9 25 9.5 25.4 13.3 36 35.9 4.9 22.3 8.7 33.2<br />
pyrene (1) 0.7 3.8 5.9 5 2 1.1 2.1 0 3.3 5.1 0 3.5 1.2 2.6<br />
benza(a)anthracene (1) 0 0 0 0 0 0 0 0 0 0 0 0 0 0.0<br />
benzo(a)pyrene (1) 0 0 0 0 0 0 0 0 0 0 0 0 0 0.0<br />
benzo(b)fluoranthene (1) 0 0 2.6 2.1 0 0 0 0 0 1.6 0 1 0 0.6<br />
benzo(k)fluoranthene (1) 0 0 0 0 0 0 0 0 0 0 0 0 0 0.0<br />
chrysene (1) 0 0.9 1.6 1.5 0 0 0 0 0 1.6 0 1.1 0 0.5<br />
dibenzo(a,h)anthracene (1) 0 0 0 0 0 0 0 0 0 0 0 0 0 0.0<br />
indeno(1,2,3-cd)pyrene (1) 0 0 0 0 0 0 0 0 0 0 0 0 0 0.0<br />
28
Appendix IIIB<br />
Schiller Park Air <strong>Toxic</strong> Data *<br />
Urban Air <strong>Toxic</strong> Compounds<br />
6/17 6/29 7/11 7/23 8/4 8/16 8/28 9/9 9/21 10/3 10/18 10/31 11/8 11/20 12/14 12/26 Average<br />
acetaldehyde 0.78 0.85 0.67 0.53 1.02 0.76 1.09 0.17 0.56 1.5 1.46 0.36 1.73 0.8 0.88<br />
acrolein 0 0 0 0 0 0 0 0 0 0 0 0 0 0 0.00<br />
acrylonitrile 0 0 0 0 0 0 0 0 0.00<br />
arsenic (1) 1 1 1 2 4 1 0 1 1 3 0 0 0 0 0 1.0<br />
benzene 0.08 0.6 0.5 0.49 0.24 0.8 0.61 0.66 0.29 0.19 1.07 0.50<br />
beryllium (1) 0 4 1 0 0 0 0 0 1 0 0 0 0 1 1 0.5<br />
1,3-butadiene 0 0.6 0 0 0 0.11 0.14 0 0.08 0 0.28 0.11<br />
cadmium (1) 2 2 2 2 2 2 6 2 2 1 2 4 3 5 4 2.7<br />
carbon tetrachloride 0.09 0.04 0.05 0.04 0.03 0.12 0.1 0.08 0.07<br />
chloroform 1.4 3.4 0 0 0 0 0 0 0 0 0 0.44<br />
chromium (1) 5 7 5 8 7 9 21 5 10 9 1 6 5 5 4 7.1<br />
1,2-dibromoethane 0 0 0.7 0 0 0 0 0 0 0 0 0.06<br />
1,2-dichloropropane 0 0 0 0 0 0 0 0 0 0 0 0.00<br />
1,2-dichloropropene 0 0.3 0.5 0 0 0 0 0 0 0 0 0.07<br />
1,2-dichloroethane 0.3 1.3 1.3 0 0 0 0 0 0 0 0 0.26<br />
formaldehyde 2.29 3.32 2.28 1.72 3.26 3.04 4.04 17.92 1.64 2.19 2.26 0.94 3.09 1.61 3.54<br />
lead (1) 10 0 10 10 10 20 10 10 30 20 50 10 20 30 10 16.7<br />
manganese (1) 30 20 17 24 27 57 22 21 42 47 91 21 18 23 12 31.5<br />
methylene chloride 0 0 0 0.06 0 0.15 0.12 0.16 0.11 0 0.21 0.07<br />
nickel (1) 8 5 7 9 10 8 6 6 11 8 12 8 8 16 7 8.6<br />
polycyclic organics(PAH) (1) 173 220 164 10 150 48 26 252 306 140 126 440 165 171<br />
1,1,2,2-tetrachloroethane 0 0 0 0 0 0 0 0 0 0 0 0.00<br />
perchloroethylene 0.4 1.2 1.8 0 0.08 0 0.04 0 0.08 0 0.1 0.34<br />
trichloroethylene 1.6 2.5 2.1 0 0 0.12 0.06 0.4 0.31 0 0.22 0.66<br />
vinyl chloride 0 0 0 0 0 0 0 0 0 0 0 0.00<br />
dioxins(2,3,7,8) (2) 0.164 0.316 0.51 0.925 1.61 1.08 2.64 1.8 2.62 1.73 1.05 2.66 1.93 1.464<br />
furans(2,3,7,8) (2) 0 0.289 0.07 0.196 0.503 0.108 0.053 0.113 0.834 0.165 0.322 0.795 0.768 0.324<br />
29
Appendix IIIB<br />
Schiller Park Air <strong>Toxic</strong> Data *<br />
Hazardous Air Pollutants<br />
6/17 6/29 7/11 7/23 8/4 8/16 8/28 9/9 9/21 10/3 10/18 10/31 11/8 11/20 12/14 12/26 Average<br />
1,4-dichlorobenzene 0.3 0.2 0 0 0 0 0 0 0 0 0 0.05<br />
1,2,4-trimethylbenzene 0.2 0.1 0.2 0.15 0.08 0.24 0.28 0.19 0.15 0 0.51 0.19<br />
1,3,5-trimethylbenzene 0 0.1 0.09 0.03 0 0.07 0.1 0.05 0.05 0 0.16 0.06<br />
ethyl benzene 0.09 0.1 0.1 0.15 0.06 0.24 0.2 0.16 0.12 0.05 0.33 0.15<br />
hexachlorobutadiene 0.3 0.2 0.4 0 0 0 0 0 0 0 0 0.08<br />
methyl bromide 0 0 0 0 0 0 0 0 0 0 0 0.00<br />
styrene 0.2 0.2 0.05 0.64 0 0.03 0.12 0.03 0.04 0 0.08 0.13<br />
toluene 1.2 1.1 1 0.65 0.31 1.96 1.21 1.13 0.82 0.16 1.63 1.02<br />
xylenes 0.39 0.5 0.6 0.51 0.25 0.98 0.8 0.66 0.54 0.15 1.33 0.61<br />
propionaldehyde 0 0 0 0 0 0 0 0 0 0 0 0 0 0 0.00<br />
crotonaldehyde 0 0 0 0 0 0 0 0 0 0 0 0 0 0 0.00<br />
butyraldehyde 0 0 0 0 0 0 0 0 0 0 0 0 0 0 0.00<br />
isovaleraldehyde 0 0 0 0 0 0 0 0 0 0 0 0 0 0 0.00<br />
valeraldehyde 0 0 0 0 0 0 0 0 0 0 0 0 0 0 0.00<br />
tolualdehydes 0 0 0 0 0 0 0 0 0 0 0 0 0 0 0.00<br />
hexanaldehyde 0 0 0 0 0 0 0 0 0 0 0 0 0 0 0.00<br />
2,5-dimethylbenzaldehyde 0 0 0 0 0 0 0 0 0 0 0 0 0 0 0.00<br />
acenaphthene (1) 10.7 16.8 13.1 10.5 1.6 1.5 3.4 17.2 4.6 2.6 10.2 3.3 8.0<br />
acenaphthylene (1) 0 0 0 0 0 0 0 7.6 0 0 15.3 0 1.9<br />
anathracene (1) 0 0 0 0 0 0 0 0 0 0 0 0 0.0<br />
benzo(ghi)perylene (1) 0 0 0 0 0 0 0 0 0 0 0 0 0.0<br />
fluoranthene (1) 10.4 9 6.5 4.6 1.3 0.8 1.9 5.9 2.9 2.4 4.5 2.4 4.4<br />
fluorene (1) 15.2 17.6 15 12.9 2.1 0 4.2 15.6 8 4.6 18.1 7.4 10.1<br />
naphthalene (1) 69.6 118 79.4 87.2 35 16.7 224 214 106 103 350 132 127.9<br />
phenanthrene (1) 60.9 53.8 45.5 32.4 7.5 6.6 17.8 38.4 16.8 10.4 34.9 17.1 28.5<br />
pyrene (1) 5.7 4.7 3.3 2.4 1.2 0 1.4 4.6 2.3 2.4 5.6 2.5 3.0<br />
benza(a)anthracene (1) 0 0 0 0 0 0 0 0 0 0 0 0 0.0<br />
benzo(a)pyrene (1) 0 0 0 0 0 0 0 0 0 0 0 0 0.0<br />
benzo(b)fluoranthene (1) 0 0 0 0 0 0 0 1.7 0 0 0 0 0.1<br />
benzo(k)fluoranthene (1) 0 0 0 0 0 0 0 0 0 0 0 0 0.0<br />
chrysene (1) 0 0 0.9 0 0 0 0 1.2 0 0 1.4 0.6 0.3<br />
dibenzo(a,h)anthracene (1) 0 0 0 0 0 0 0 0 0 0 0 0 0.0<br />
indeno(1,2,3-cd)pyrene (1) 0 0 0 0 0 0 0 0 0 0 0 0 0.0<br />
30
Appendix IIIC<br />
<strong>Chicago</strong> - Washington Air <strong>Toxic</strong> Data *<br />
Urban Air <strong>Toxic</strong> Compounds<br />
6/17 6/29 7/11 7/23 8/4 8/16 8/28 9/9 9/21 10/3 10/18 10/31 11/8 11/20 12/14 12/26 Average<br />
acetaldehyde 0.52 0.78 0.6 0.52 1.04 0.41 0.86 0.65 0.61 0.42 1.12 0.86 0.57 0.35 1.48 0.66 0.72<br />
acrolein 0 0 0 0 0 0 0 0 0 0 0 0 0 0 0.14 0 0.01<br />
acrylonitrile 0 0 0 0 0 0 0 0 0.00<br />
arsenic (1) 1 1 1 2 2 1 1 1 1 0 0 2 0 1.0<br />
benzene 0.6 1 0.3 0.6 0.7 1.22 0.19 0.49 0.39 0.51 0.66 1.87 0.5 0.69<br />
beryllium (1) 0 2 2 0 0 0 0 0 1 0 0 1 0 0.46<br />
1,3-butadiene 0 0 0 0 1.1 0.1 0 0 0 0.04 0 0.2 0.06 0.12<br />
cadmium (1) 2 1 2 1 2 1 1 2 2 3 5 7 5 2.6<br />
carbon tetrachloride 0.08 0.04 0.09 0.05 0.04 0.1 0.1 0.1 0.08<br />
chloroform 0 3 0 0 3.9 0.2 0 0 0 0 0 0 0 0.55<br />
chromium (1) 14 6 1 8 5 7 6 9 8 9 38 4 4 9.2<br />
1,2-dibromoethane 0 0 0 0.9 0.6 0 0 0 0 0 0 0 0 0.12<br />
1,2-dichloropropane 0 0 0 0.9 0 0 0 0 0 0 0 0 0 0.07<br />
1,2-dichloropropene 0 0 0 0 0.5 0 0 0 0 0 0 0 0 0.04<br />
1,2-dichloroethane 0 0.6 0 0.9 0.5 0 0 0 0 0 0 0 0 0.15<br />
formaldehyde 1.69 2.07 1.98 1.5 2.61 1.36 3.07 1.8 1.5 1.36 3.86 1.75 1.48 0.57 2.57 1.25 1.90<br />
lead (1) 40 10 10 20 10 20 20 40 40 30 110 30 30 31.5<br />
manganese (1) 106 84 50 114 60 98 103 143 198 93 628 53 89 139.9<br />
methylene chloride 0 0 0 0 0.6 0.32 0 4.5 0.1 0.33 0 0.22 0.07 0.47<br />
nickel (1) 7 5 6 8 6 7 5 5 6 8 15 6 5 6.8<br />
polycyclic organics(PAH) (1) 128 163 111 129 192 328 521 220 115 193 750 500 530 298<br />
1,1,2,2-tetrachloroethane 0 0 0 0 0 0 0 0 0 0 0 0 0 0.00<br />
perchloroethylene 0.4 0.7 1.2 2.8 1.3 0.04 0 0.2 0 0 0 0.12 0 0.52<br />
trichloroethylene 0.9 1.9 0 2 2.9 0.05 0 0.12 0 0 0.13 0.3 0.18 0.65<br />
vinyl chloride 0 0 0 0 0 0 0 0 0 0 0 0 0 0.00<br />
dioxins(2,3,7,8) (2) 0.187 0.325 0.511 1.24 2.63 2.5 8.34 1.91 2.21 1.37 2.84 2.19 4.8 2.389<br />
furans(2,3,7,8) (2) 0.025 0.058 0.049 0.577 0.207 0.15 2.05 0.267 0.398 0.422 3.62 0.386 5.35 1.043<br />
31
Appendix IIIC<br />
<strong>Chicago</strong> - Washington Air <strong>Toxic</strong> Data *<br />
Hazardous Air Pollutants<br />
6/17 6/29 7/11 7/23 8/4 8/16 8/28 9/9 9/21 10/3 10/18 10/31 11/8 11/20 12/14 12/26 Average<br />
1,4-dichlorobenzene 0 0.1 0.2 0 0.3 0.1 0 0.07 0.09 0.07 0 0 0 0.07<br />
1,2,4-trimethylbenzene 0.08 0.2 0.09 0.2 0.5 0.57 0.08 0.19 0.17 0.16 0 0.41 0.11 0.21<br />
1,3,5-trimethylbenzene 0.3 0.3 0 0.2 0.3 0.18 0 0.06 0.05 0.05 0 0.12 0.03 0.12<br />
ethyl benzene 0 0.1 0 0.1 0.3 0.3 0.05 0.23 0.15 0.15 0.05 0.31 0.11 0.14<br />
hexachlorobutadiene 0 0.2 0 4.1 0.9 0 0 0 0 0 0 0 0 0.40<br />
methyl bromide 0 0 0 0 0 0 0 0 0 0 0 0 0 0.00<br />
styrene 0.3 0.3 0 0 0.2 0.11 0 0.11 0 0.09 0 0.19 0.03 0.10<br />
toluene 0.4 1 0.6 1.3 1.8 47.18 # 0.45 1.42 0.85 0.93 0.35 1.82 0.66 0.97<br />
xylenes 0.29 0.5 0.26 0.2 0.5 1.06 0.14 0.79 0.55 0.55 0.21 1.44 0.42 0.53<br />
propionaldehyde 0 0 0 0 0 0 0 0 0 0 0 0 0 0 0 0 0.00<br />
crotonaldehyde 0 0 0 0 0 0 0 0 0 0 0 0 0 0 0 0 0.00<br />
butyraldehyde 0 0 0 0 0 0 0 0 0 0 0 0 0 0 0 0 0.00<br />
isovaleraldehyde 0 0 0 0 0 0 0 0 0 0 0 0 0 0 0 0 0.00<br />
valeraldehyde 0 0 0 0 0 0 0 0 0 0 0 0 0 0 0 0 0.00<br />
tolualdehydes 0 0 0 0 0 0 0 0 0 0 0 0 0 0 0 0 0.00<br />
hexanaldehyde 0 0 0 0 0 0 0 0 0 0 0 0 0 0 0 0 0.00<br />
2,5-dimethylbenzaldehyde 0 0 0 0 0 0 0 0 0 0 0 0 0 0 0 0 0.00<br />
acenaphthene (1) 13.1 18.8 14.7 13 18.2 6.4 34.6 7.5 6.4 7.9 7.7 9.8 7.7 12.8<br />
acenaphthylene (1) 0 0 0 0 0 0 0 0 0 0 15.9 16.4 14.9 3.6<br />
anathracene (1) 0 0 0 0 0 2 0 0 0 0 7.5 3.2 6.4 1.5<br />
benzo(ghi)perylene (1) 0 0 0 0 0 0 0 0 0 0 0 0 0 0.0<br />
fluoranthene (1) 8.8 5.7 3.7 4.3 6.1 9.1 20.9 0 2.7 4.6 20.8 7.2 18.4 8.6<br />
fluorene (1) 13 19.5 11.3 14.6 18.6 10.3 30 6.7 7.1 10 16.9 17 15.9 14.7<br />
naphthalene (1) 42.2 50.8 49.5 55.2 92.6 256 299 181 80.1 144 597 400 390 202.9<br />
phenanthrene (1) 47.1 66.5 30.7 40.3 53.8 36.8 126 24.9 16.8 24 50.2 38.1 53.6 46.8<br />
pyrene (1) 4.2 2.3 1.5 1.9 2.9 5.4 10 0 2.1 2.8 13.1 6.4 10.9 4.9<br />
benza(a)anthracene (1) 0 0 0 0 0 1.9 0 0 0 0 5.8 0 4.7 1.0<br />
benzo(a)pyrene (1) 0 0 0 0 0 0 0 0 0 0 0 0 1.7 0.1<br />
benzo(b)fluoranthene (1) 0 0 0 0 0 0 0 0 0 0 7.5 0 0 0.6<br />
benzo(k)fluoranthene (1) 0 0 0 0 0 0 0 0 0 0 0 0 0 0.0<br />
chrysene (1) 0 0 0 0 0 0 0 0 0 0 7.3 2.2 6.5 1.2<br />
dibenzo(a,h)anthracene (1) 0 0 0 0 0 0 0 0 0 0 0 0 0 0.0<br />
indeno(1,2,3-cd)pyrene (1) 0 0 0 0 0 0 0 0 0 0 0 0 0 0.0<br />
# - toluene value on 9/21/00 has been excluded from the average as it is a suspected anomaly and needs further investigation.<br />
32
Appendix IIID<br />
Northbrook Air <strong>Toxic</strong> Data *<br />
Urban Air <strong>Toxic</strong> Compounds<br />
6/17 6/29 7/11 7/23 8/4 8/16 8/28 9/9 9/21 10/3 10/18 10/31* 11/8 11/20 12/14 12/26 Average<br />
acetaldehyde 0.50 0.42 0.41 0.34 0.59 0.44 0.63 0.69 0.37 0.69 1.13 1.06 0.40 0.27 1.01 0.70 0.60<br />
acrolein 0 0 0.2 0 0 0 0 0 0 0 0 0 0 0 0 0 0.01<br />
acrylonitrile 0 0 0 0 0 0 0 0 0.00<br />
arsenic (1) 1 0 1 2 1 1 1 0 0 3 0 0 0 1 0 0.7<br />
benzene 0.3 0.3 0.3 0.5 0.17 0.4 0.49 0.09 0.28 0.14 0.47 0.49 0.33<br />
beryllium (1) 0 3 1 0 0 0 0 0 0 0 0 0 0 0 0 0.3<br />
1,3-butadiene 0 0 0 0 0 0 0.04 0.03 0 0 0.05 0.13 0.02<br />
cadmium (1) 2 1 1 1 2 2 1 2 2 2 3 2 3 4 4 2.1<br />
carbon tetrachloride 0.04 0.04 0.04 0.04 0.08 0.09 0.11 0.09 0.07<br />
chloroform 0 1.5 0 0 0.06 0 0 0 0 0.05 0.06 0.02 0.14<br />
chromium (1) 5 4 1 5 3 5 3 2 3 5 8 2 2 2 2 3.5<br />
1,2-dibromoethane 0 0 0 0.5 0 0 0 0 0 0 0 0 0.04<br />
1,2-dichloropropane 0 0 0 0 0 0 0 0 0 0 0 0 0.00<br />
1,2-dichloropropene 0 0 0 0.4 0 0 0 0 0 0 0 0 0.03<br />
1,2-dichloroethane 0 0.5 0 2.5 0 0 0 0 0 0 0 0 0.25<br />
formaldehyde 1.53 1.47 1.32 0.94 1.58 1.42 2.17 1.92 1.04 1.46 2.33 1.59 1.26 1.99 3.12 1.6 1.67<br />
lead (1) 10 0 10 10 10 20 10 10 10 20 30 10 10 10 10 12.0<br />
manganese (1) 8 6 5 13 8 42 12 11 15 21 90 8 8 8 8 17.5<br />
methylene chloride 0 0 0 1.4 0.04 0.2 0.17 0.32 0.91 0 0.16 0 0.27<br />
nickel (1) 6 5 8 7 6 4 4 2 3 5 9 5 6 5 5 5.3<br />
polycyclic organics(PAH) (1) 102 326 119 94 135 44 71 217 227 80 50 293 67 140<br />
1,1,2,2-tetrachloroethane 0 0 0 0 0 0 0 0 0 0 0 0 0.00<br />
perchloroethylene 0 0.7 1.1 5.3 0 0.04 0.06 0.08 0.03 0 0.03 0 0.61<br />
trichloroethylene 0 0.9 0.4 5.4 0 0.21 0.14 0 0 0 0.03 0 0.59<br />
vinyl chloride 0 0 0 0 0 0 0 0 0 0 0 0 0.00<br />
dioxins(2,3,7,8) (2) 0.321 0.752 0.086 1.44 1.54 0.179 1.76 1.05 1.38 2.01 2.98 2.61 9.32 1.956<br />
furans(2,3,7,8) (2) 0.065 0.57 0 0.397 0.378 0.18 0.128 0.071 0.334 0.22 1.49 1.13 5.27 0.787<br />
* VOC sampling date 10/27 33
Appendix IIID<br />
Northbrook Air <strong>Toxic</strong> Data *<br />
Hazardous Air Pollutants<br />
6/17 6/29 7/11 7/23 8/4 8/16 8/28 9/9 9/21 10/3 10/18 10/31* 11/8 11/20 12/14 12/26 Average<br />
1,4-dichlorobenzene 0 0.9 0 0.1 0 0 0 0 0 0 0 0 0.08<br />
1,2,4-trimethylbenzene 0.09 0.12 0.09 0.3 0.06 0.17 0.41 0.19 0.07 0 0.17 0.12 0.15<br />
1,3,5-trimethylbenzene 0 0.02 0 0.1 0 0.05 0.14 0.06 0.02 0 0.05 0.04 0.04<br />
ethyl benzene 0.06 0.08 0 0.2 0.07 0.15 0.23 0.17 0.09 0 0.12 0.09 0.11<br />
hexachlorobutadiene 0 0.3 0.2 0 0 0 0 0 0 0 0 0 0.04<br />
methyl bromide 0 0 0 0 0 0 0 0 0 0 0 0 0.00<br />
styrene 0.06 0.08 0 0.1 0 0 0.1 0 0 0 0 0.03 0.03<br />
toluene 0.3 0.6 0.2 1.4 1.9 0.34 1.06 1.77 0.92 0.55 0.1 0.79 0.5 0.80<br />
xylenes 0.16 0.39 0.2 0.9 0.22 0.61 0.63 0.62 0.31 0.09 0.55 0.35 0.42<br />
propionaldehyde 0 0 0 0 0 0 0 0 0 0 0 0 0 0 0 0 0.00<br />
crotonaldehyde 0 0 0 0 0 0 0 0 0 0 0 0 0 0 0 0 0.00<br />
butyraldehyde 0 0 0 0 0 0 0 0 0 0 0 0 0 0 0 0 0.00<br />
isovaleraldehyde 0 0 0 0 0 0 0 0 0 0 0 0 0 0 0 0 0.00<br />
valeraldehyde 0 0 0 0 0 0 0 0 0 0 0 0 0 0 0 0 0.00<br />
tolualdehydes 0 0 0 0 0 0 0 0 0 0 0 0 0 0 0 0 0.00<br />
hexanaldehyde 0 0 0 0 0 0 0 0 0 0 0 0 0 0 0 0 0.00<br />
2,5-dimethylbenzaldehyde 0 0 0 0 0 0 0 0 0 0 0 0 0 0 0 0 0.00<br />
acenaphthene (1) 8 22.2 11.4 8.1 9.1 2.2 5 6.2 5.3 3.3 0.8 4.7 1.3 6.7<br />
acenaphthylene (1) 0 0 0 0 0 0 0 0 0 0 0 8.2 0 0.6<br />
anathracene (1) 0 0 1.5 0 0 0 0 0 7.4 0 0 0 0 0.7<br />
benzo(ghi)perylene (1) 0 0 0 0 0 0 0 0 0 0 0 0 0 0.0<br />
fluoranthene (1) 8.8 10.7 7 4.6 6.9 1.6 2.8 2.3 4.2 2.4 1.1 2.4 11.5 5.1<br />
fluorene (1) 10.3 21.3 12 8.8 13.4 2.3 4.3 6.8 7.1 4.7 1.6 6.6 39.3 10.7<br />
naphthalene (1) 19.3 165 43 41.7 62.8 28.6 41.2 174 187 57.3 41.4 254 51.6 89.8<br />
phenanthrene (1) 52 104 41.7 28.4 40.5 9.2 17.1 18.1 20.2 12 4.2 14 8.2 28.4<br />
pyrene (1) 3.9 3.7 2.8 2.1 2.6 0 1.1 0 2.8 0 0.8 2.2 0.8 1.8<br />
benza(a)anthracene (1) 0 0 0 0 0 0 0 0 0 0 0 0 0 0.0<br />
benzo(a)pyrene (1) 0 0 0 0 0 0 0 0 0 0 0 0 0 0.0<br />
benzo(b)fluoranthene (1) 0 0 0 0 0 0 0 0 0 0 0 0 0 0.0<br />
benzo(k)fluoranthene (1) 0 0 0 0 0 0 0 0 0 0 0 0 0 0.0<br />
chrysene (1) 0 0 0 0 0 0 0 0 0 0 0 0 0 0.0<br />
dibenzo(a,h)anthracene (1) 0 0 0 0 0 0 0 0 0 0 0 0 0 0.0<br />
indeno(1,2,3-cd)pyrene (1) 0 0 0 0 0 0 0 0 0 0 0 0 0 0.0<br />
* VOC sampling date 10/27 34
Appendix IIIE<br />
Lemont Air <strong>Toxic</strong> Data *<br />
Urban Air <strong>Toxic</strong> Compounds<br />
6/17 6/29 7/11 7/23 8/4 8/16 8/28 9/9 9/21 10/3 10/18 10/31 11/8 11/20 12/14 12/26 Average<br />
acetaldehyde 1.13 0.96 1.32 1.16 0.96 0.47 0.3 0.64 1.02 0.88<br />
acrolein 0 0 0 0 0 0 0 0 0 0.00<br />
acrylonitrile 0 0 0 0 0 0 0 0 0.00<br />
arsenic (1) 1 0 0 0 3 0 0 1 1 0.7<br />
benzene 0.24 0.46 0.75 0.34 0.37 0.28 0.7 0.44 0.45<br />
beryllium (1) 0 0 0 0 0 0 0 0 1 0.1<br />
1,3-butadiene 0 0.04 0.04 0 0 0 0.1 0 0.02<br />
cadmium (1) 1 2 1 1 1 3 3 3 3 2.0<br />
carbon tetrachloride 0.05 0.04 0.09 0.04 0 0.08 0.1 0.1 0.06<br />
chloroform 0 0 0 0 0 0 0.05 0 0.01<br />
chromium (1) 3 2 4 3 4 3 4 2 1 2.9<br />
1,2-dibromoethane 0 0 0 0 0 0 0 0 0.00<br />
1,2-dichloropropane 0 0 0 0 0 0 0 0 0.00<br />
1,2-dichloropropene 0 0 0 0 0 0 0 0 0.00<br />
1,2-dichloroethane 0 0 0 0 0 0 0 0 0.00<br />
formaldehyde 2.34 1.8 2.42 2.04 1.91 0.91 0.64 1.04 1.96 1.67<br />
lead (1) 20 10 20 10 20 20 10 10 10 14.4<br />
manganese (1) 26 9 52 14 36 18 49 16 6 25.1<br />
methylene chloride 0.04 0.26 0.19 0.07 0.04 0.91 0.25 0.05 0.23<br />
nickel (1) 3 3 5 3 6 5 6 5 5 4.6<br />
polycyclic organics(PAH) (1)<br />
1,1,2,2-tetrachloroethane 0 0 0 0 0 0 0 0 0.00<br />
perchloroethylene 0 0.07 0.18 0 0 0.03 0.1 0 0.05<br />
trichloroethylene 0 0.11 0.12 0 0 0 0.04 0 0.03<br />
vinyl chloride 0 0 0 0 0 0 0 0 0.00<br />
dioxins(2,3,7,8) (2)<br />
furans(2,3,7,8) (2)<br />
35
Appendix IIIE<br />
Lemont Air <strong>Toxic</strong> Data *<br />
Hazardous Air Pollutants<br />
6/17 6/29 7/11 7/23 8/4 8/16 8/28 9/9 9/21 10/3 10/18 10/31 11/8 11/20 12/14 12/26 Average<br />
1,4-dichlorobenzene 0 0 0 0 0 0 0 0 0.00<br />
1,2,4-trimethylbenzene 0.09 0.17 0.27 0.09 0.09 0.07 0.23 0.1 0.14<br />
1,3,5-trimethylbenzene 0 0.05 0.09 0.02 0 0.02 0.08 0.02 0.04<br />
ethyl benzene 0.08 0.18 0.21 0.17 0.09 0.09 0.18 0.07 0.13<br />
hexachlorobutadiene 0 0 0 0 0 0 0 0 0.00<br />
methyl bromide 0 0 0 0 0 0 0 0 0.00<br />
styrene 0.03 0.02 0.27 0 0.06 0 0.15 0.05 0.07<br />
toluene 0.56 1.26 1.21 0.57 0.46 0.55 1.12 0.39 0.77<br />
xylenes 0.33 0.71 0.83 0.93 0.33 0.31 0.74 0.27 0.56<br />
propionaldehyde 0 0 0 0 0 0 0 0 0 0.00<br />
crotonaldehyde 0 0 0 0 0 0 0 0 0 0.00<br />
butyraldehyde 0 0 0 0 0 0 0 0 0 0.00<br />
isovaleraldehyde 0 0 0 0 0 0 0 0 0 0.00<br />
valeraldehyde 0 0 0 0 0 0 0 0 0 0.00<br />
tolualdehydes 0 0 0 0 0 0 0 0 0 0.00<br />
hexanaldehyde 0 0 0 0 0 0 0 0 0 0.00<br />
2,5-dimethylbenzaldehyde 0 0 0 0 0 0 0 0 0 0.00<br />
acenaphthene (1)<br />
acenaphthylene (1)<br />
anathracene (1)<br />
benzo(ghi)perylene (1)<br />
fluoranthene (1)<br />
fluorene (1)<br />
naphthalene (1)<br />
phenanthrene (1)<br />
pyrene (1)<br />
benza(a)anthracene (1)<br />
benzo(a)pyrene (1)<br />
benzo(b)fluoranthene (1)<br />
benzo(k)fluoranthene (1)<br />
chrysene (1)<br />
dibenzo(a,h)anthracene (1)<br />
indeno(1,2,3-cd)pyrene (1)<br />
36
Footnotes for Appendices IIIA-E<br />
* - values expressed in parts per billion volume (ppbv) unless otherwise noted<br />
(1) - values expressed in nanograms per cubic meter (ng/m3)<br />
(2) - values expressed in picograms per cubic meter (pg/m3)<br />
37
Appendix IIIF<br />
Summary of PCDDs, PCDFs, PAHs, Nitro-PAHs, and<br />
Semivolatile Vapor Plus Particulate Results<br />
Collection Air volume 2378-PCDFs 2378-PCDDs Total PCDD/F PAH N-PAH Other<br />
Field ID MRI ID Date (m 3 ) a pg/m 3 pg/m 3 pg/m 3 µg/m 3 µg/m 3 µg/m 3<br />
Bensenville 00001134 7/11/00 299.5 0.0661 0.156 0.778 0.157 ND 0.0588<br />
North Brook 00001135 7/11/00 143.8 0.0647 0.321 0.532 0.102 ND 0.0570<br />
Schiller Park 00001136 7/11/00 238.2 ND 0.164 0.473 0.173 ND 0.0443<br />
Washington HS 00001137 7/11/00 314.8 0.0250 0.187 0.549 0.128 ND 0.0434<br />
Bensenville 00001156 7/23/00 335.0 0.165 0.742 1.18 0.311 ND 0.00873<br />
North Brook 00001154 7/23/00 385.8 0.570 0.752 1.55 0.326 ND 0.00827<br />
Schiller Park 00001153 7/23/00 365.3 0.289 0.316 0.605 0.220 ND 0.0100<br />
Washington HS 00001155 7/23/00 299.7 0.0579 0.325 0.641 0.163 ND 0.0137<br />
Bensenville 00001251 8/4/00 333.4 0.150 0.584 1.00 0.220 ND 0.0231<br />
North Brook 00001249 8/4/00 343.6 ND 0.0856 0.117 0.119 ND 0.0763<br />
Schiller Park 00001248 8/4/00 345.6 0.0700 0.510 0.804 0.164 ND 0.0220<br />
Washington HS 00001247 8/4/00 153.2 0.0492 0.511 0.711 0.111 ND 0.0240<br />
Bensenville 00001326 8/16/00 236.7 0.646 2.09 4.64 0.175 ND 0.309<br />
North Brook 00001329 8/16/00 227.6 0.397 1.44 2.75 0.0938 ND 0.0351<br />
Schiller Park 00001328 8/16/00 307.4 0.196 0.925 1.65 0.00972 ND 0.0634<br />
Washington HS 00001330 8/16/00 299.6 0.577 1.24 4.67 0.129 ND 0.241<br />
Bensenville 00001486 8/28/00 238.2 0.250 1.58 2.48 0.0953 ND 0.144<br />
North Brook 00001485 8/28/00 229.0 0.378 1.54 2.44 0.135 ND 0.0435<br />
Schiller Park 00001487 8/28/00 275.7 0.503 1.61 3.14 0.150 ND 0.0317<br />
Washington HS 00001489 8/28/00 149.9 0.207 2.63 4.00 0.192 ND 0.0640<br />
Bensenville 00001650 9/20/00 258.5 0.250 2.24 2.71 0.0371 ND 0.0274<br />
North Brook 00001653 9/20/00 204.0 0.180 0.179 0.613 0.0440 ND 0.0451<br />
Schiller Park 00001651 9/20/00 268.6 0.108 1.08 1.19 0.0485 ND 0.0183<br />
Washington HS 00001654 9/20/00 150.9 0.150 2.50 3.57 0.328 ND 0.0424<br />
Bensenville 00001722 10/3/00 230.0 0.226 1.53 2.01 0.136 ND 0.111<br />
North Brook 00001720 10/3/00 225.8 0.128 1.76 1.91 0.0714 ND 0.0807<br />
Schiller Park 00001723 10/3/00 299.6 0.0527 2.64 2.82 0.0256 ND 0.0593<br />
Washington HS 00001721 10/3/00 38.7 2.05 8.34 11.4 0.521 ND 0.355<br />
38
Appendix IIIF (continued)<br />
Summary of PCDDs, PCDFs, PAHs, Nitro-PAHs, and<br />
Semivolatile Vapor Plus Particulate Results<br />
Collection Air volume 2378-PCDFs 2378-PCDDs Total PCDD/F PAH N-PAH Other<br />
Field ID MRI ID Date (m 3 ) a pg/m 3 pg/m 3 pg/m 3 µg/m 3 µg/m 3 µg/m 3<br />
Bensenville 00001808 10/18/00 240.9 0.143 1.70 2.40 0.0850 ND 2.76<br />
North Brook 00001807 10/18/00 226.4 0.0710 1.05 1.47 0.207 ND 0.255<br />
Schiller Park 00001809 10/18/00 324.0 0.113 1.80 2.66 0.252 ND 0.0618<br />
Washington HS 00001810 10/18/00 155.9 0.266 1.91 3.53 0.220 ND 6.41<br />
Bensenville 00001901 11/1/00 317.8 0.107 0.228 1.83 0.319 ND 0.00906<br />
North Brook 00001899 11/1/00 281.8 0.334 1.38 3.38 0.227 ND 0.00565<br />
Schiller Park 00001900 11/1/00 326.1 0.834 2.62 7.19 0.306 ND 0.0327<br />
Washington HS 00001903 11/1/00 224.5 0.398 2.21 4.07 0.115 ND 0.225<br />
Bensenville 00001920 11/9/00 304.2 0.304 2.59 3.26 0.220 ND 0.0287<br />
North Brook 00001922 11/9/00 273.4 0.220 2.01 2.79 0.0797 ND 0.0210<br />
Schiller Park 00001921 11/9/00 326.7 0.165 1.73 2.24 0.140 ND 0.0411<br />
Washington HS 00001925 11/9/00 234.3 0.422 1.37 2.80 0.193 ND 0.0352<br />
Bensenville 00002076 11/21/00 319.0 0.475 1.33 2.27 0.0465 ND 0.0302<br />
North Brook 00002077 11/21/00 274.4 1.49 2.98 5.57 0.0500 ND 0.0438<br />
Schiller Park 00002075 11/21/00 334.5 0.322 1.05 1.69 0.126 ND 0.0300<br />
Washington HS 00002079 11/21/00 234.9 3.62 2.84 16.4 0.750 ND 0.0579<br />
Bensenville 00002205 12/15/00 315.1 0.616 2.36 4.21 0.350 ND 0.0638<br />
North Brook 00002207 12/15/00 292.4 1.13 2.61 4.57 0.293 ND 0.0329<br />
Schiller Park 00002206 12/15/00 341.6 0.795 2.66 4.90 0.440 ND 0.0510<br />
Washington HS 00002208 12/15/00 231.6 0.386 2.19 4.15 0.500 ND 0.0573<br />
Bensenville 01000060 12/27/00 321.0 0.259 1.06 1.92 0.0899 ND 0.0277<br />
North Brook 01000059 12/27/00 384.8 5.27 9.32 18.1 0.0668 ND 0.0162<br />
Schiller Park 01000061 12/27/00 346.0 0.768 1.93 3.46 0.165 ND 0.0333<br />
Washington HS 01000063 12/27/00 230.3 5.35 4.80 26.1 0.530 ND 0.125<br />
a Concentration data calculated from <strong>air</strong> volume sampled corrected to 25 o C and 760mm pressure based on 24-hr average temperature and<br />
pressure recorded at <strong>O'Hare</strong> International, <strong>Chicago</strong> IL.<br />
39
Appendix IV<br />
Meteorological Summary on Sampling Days<br />
A meteorological summary of each sampling day is provided below. The large-scale<br />
weather pattern is discussed and the local weather conditions in the <strong>Chicago</strong> area are<br />
listed. A wind rose/frequency distribution (Figure 5) is also provided which is a<br />
composite of the wind conditions on the sampling days only as provided in the following<br />
table.<br />
June 17<br />
A cold front had passed through the area on June 16 and was located along the Ohio<br />
River. High pressure over northern Iowa was the dominate feature. There were clouds<br />
and a few showers throughout the <strong>Chicago</strong> area, bur precipitation amounts were light,<br />
less than 0.1 in. At O’Hare the maximum temperature was 64 deg F, winds were<br />
generally from the northeast with an average speed of 8.4 mph.<br />
June 29<br />
High pressure over Kansas was dominating the weather throughout the region. Some<br />
light rainfall had occurred over the <strong>Chicago</strong> area during the past day. At O’Hare the<br />
maximum temperature was 76 deg F with a low of 55 deg F. Winds were from the west<br />
to northwest at an average speed of 7.7 mph.<br />
July 11<br />
High pressure over southern Ontario was providing a flow of Canadian <strong>air</strong> into the<br />
region. A stationary front was located over central <strong>Illinois</strong>. Moderate rainfall, over 1 in.,<br />
had occurred in the <strong>Chicago</strong> area the previous day. At O’Hare the maximum temperature<br />
was 75 deg F with a minimum of 65 deg F. Winds were from the northeast at an average<br />
speed of 7.1 mph.<br />
July 23<br />
High pressure over northern Lake Michigan dominated the weather in the region<br />
providing a flow of Canadian <strong>air</strong>. Skies were mostly clear and there had been no rainfall<br />
in the <strong>Chicago</strong> area for the last three days. At O’Hare the maximum temperature was 73<br />
deg F and the minimum was 52 deg F, the lowest in July. Winds were northwest early in<br />
the day, shifting to northeast by 8 a.m., at an average speed of 5.8 mph.<br />
August 4<br />
High pressure located over central Lake Michigan provided a light flow of Canadian <strong>air</strong><br />
into the region. The high pressure moved southeast during the day. There was no rain on<br />
August 4 but some scattered showers in the <strong>Chicago</strong> area the previous day. At O’Hare<br />
the maximum temperature was 80 deg F and the minimum was 54 deg F, the lowest in<br />
40
August. Winds were from the north early in the day and shifted around the south by late<br />
in the day. Wind speeds were light, averaging 4.7 mph.<br />
August 16<br />
A cold front had moved through the region late on the previous day and was located in<br />
southern <strong>Illinois</strong>. High pressure was moving south out of southwest Ontario. The<br />
maximum temperature the previous day was 92 deg F, the warmest day in August. The<br />
cold front brought much cooler temperatures on August 16. There was no rainfall that<br />
day or the previous day. At O’Hare the maximum temperature was 77 deg F and the<br />
minimum was 77 deg F. Winds were north in the morning shifting to east by evening at<br />
an average speed of 9.5 mph<br />
August 28<br />
A high pressure system located over Quebec was providing southeast flow into the<br />
region. A stationary front was located to the southwest over Missouri and another<br />
stationary front was starting to move east as a cold front out of the plains. There was no<br />
rainfall that day or the previous day. At O’Hare the maximum temperature was 85 deg F<br />
and the minimum was 64 deg F. Winds were southeast at an average speed of 8.7 mph.<br />
September 9<br />
High pressure was located east over the Virginia/North Carolina border providing<br />
southerly flow into the region. A warm front was located over Wisconsin and a cold<br />
front was moving in from the west. There was no rainfall on this day but some scattered<br />
precipitation occurred the previous morning. At O’Hare the maximum temperature was<br />
85 deg F and the minimum was 67 deg F. Winds were from the south all day at an<br />
average speed of 9.4 mph.<br />
September 21<br />
High pressure was located over Missouri providing westerly flow into the region. A cold<br />
front had moved through the area the previous day with rainfall amounts around 0.25 in.<br />
There was no precipitation on this day. Winds were west to northwest most of the day<br />
shifting to east by evening. Winds speeds averaged 8.5 mph but were stronger prior to<br />
the wind shift.<br />
October 3<br />
A cold front had moved through the area the previous day and was located in southern<br />
<strong>Illinois</strong>. A second cold front was moving southeast into northern Wisconsin. Scattered<br />
showers occurred throughout the <strong>Chicago</strong> area with rainfall amounts above 0.5 in. At<br />
O’Hare the maximum temperature was 73 deg F and the minimum was 44 deg F. Winds<br />
were light and variable until afternoon when a shift to the northeast occurred. The<br />
average speed was 6.0 mph but was higher after the wind shift.<br />
41
October 18<br />
A high pressure system located over the southern plains (from southern Colorado to<br />
southern Missouri) dominated the weather in the region. A cold front was moving into<br />
southern Wisconsin in the morning but no precipitation occurred in the area. At O’Hare<br />
the maximum temperature was 70 deg F and the minimum was 38 deg F. Winds were<br />
from the southwest at an average speed of 6.1 mph.<br />
October 31<br />
High pressure located over eastern Canada dominated the weather in the region. A weak<br />
stationary front was located southwest over the Mississippi Valley. There had been no<br />
precipitation in the <strong>Chicago</strong> area for several days. At O’Hare the maximum temperature<br />
was 70 deg F and the minimum was 47 deg F. Winds were southeast at an average speed<br />
of 7.7 mph.<br />
November 8<br />
A cold front had moved through the area the previous day with light precipitation and a<br />
weak surface trough was moving into northwest <strong>Illinois</strong>. Rainfall this day was less than<br />
0.1 in. At O’Hare the maximum temperature was 48 deg F and the minimum was 32 deg<br />
F. Winds were southwest early shifting to west by afternoon and north by evening. The<br />
average speed was 5.8 mph.<br />
November 20<br />
A strong cold front had moved through the area the previous day. Low pressure located<br />
north of Lake Huron dominated the weather. Traces of snow fell this day and on the<br />
previous day. At O’Hare the maximum temperature was 29 deg F and the minimum was<br />
18 deg F. Winds were strong out of the west all day. The average speed was 16.2 mph.<br />
December 14<br />
A low pressure system was located east over western New York State and high pressure<br />
was located over eastern Kansas. A trace of snow fell in the morning; however there had<br />
been 6 in. of snow the previous day and a total of 15 in. were on the ground. At O’Hare<br />
the maximum temperature was 27 deg F and the minimum was 7 deg F. Winds were<br />
northwest early, shifting to west be early afternoon and to south by evening. This<br />
average speed was 6.5 mph.<br />
December 26<br />
Low pressure over Lake Superior was pulling a cold front into northwest Wisconsin. A<br />
high pressure system located from <strong>Illinois</strong> east to North Carolina dominated the weather.<br />
Light snow totaling 0.5 in. fell throughout the day. At O’Hare the maximum temperature<br />
was 19 deg F and the minimum was 3 deg F. Winds were southwest early shifting to<br />
west by evening. The average speed was 8.3 mph.<br />
42
Appendix IV (continued)<br />
Frequency of Wind Direction on Sampling Days<br />
Sampling Day N NNE NE ENE E ESE SE SSE S SSW SW WSW W WNW NW NNW CALM<br />
June 17, 2000 7 5 4 6 1 1<br />
June 29, 2000 1 1 1 1 5 3 11 1<br />
July 11, 2000 3 3 14 4<br />
July 23, 2000 3 4 7 4 1 5<br />
August 4, 2000 4 1 2 3 5 1 1 1 2 4<br />
August 16, 2000 8 4 4 6 1 1<br />
August 28, 2000 1 2 5 7 7 2<br />
September 9, 2000 17 7<br />
September 21, 2000 4 1 1 4 6 7 1<br />
October 3, 2000 1 3 2 4 1 1 1 2 3 1 1 4<br />
October 18, 2000 7 9 7 1<br />
October 31, 2000 3 2 8 9 2<br />
November 8, 2000 2 1 9 6 3 1 2<br />
November 20, 2000 5 14 5<br />
December 14, 2000 1 1 1 1 6 3 1 10<br />
December 26, 2001 1 10 9 4<br />
Total Hours 29 19 32 27 16 15 18 19 25 22 28 39 35 17 23 18 2<br />
Percent of Time 7.6 4.9 8.3 7.0 4.2 3.9 4.7 4.9 6.5 5.7 7.3 10.2 9.1 4.4 6.0 4.7 0.5<br />
43
Appendix V<br />
General Information for Selected Target Compounds<br />
The following is a general discussion of the nature and sources for each of selected target<br />
compounds (Reference 3).<br />
Acetaldehyde and Formaldehyde<br />
These compounds are both from a large family of chemical compounds called volatile<br />
organic compounds (VOCs) and fall within a chemical group called aldehydes and<br />
ketones which are structured to include a carbonyl group, double-bonded carbon and<br />
oxygen atoms.<br />
Formaldehyde is released into the <strong>air</strong> by burning wood, kerosene or natural gas, by<br />
automobiles, trucks and <strong>air</strong>craft through the burning of motor fuels and by cigarettes.<br />
Formaldehyde can off-gas from materials made with it, e.g., from glue or adhesive in<br />
press wood products, from preservatives in some paints and cosmetics, the coating that<br />
provides permanent press quality to fabrics and draperies. Formaldehyde is also a<br />
naturally occurring substance.<br />
Acetaldehyde is ubiquitous in the ambient environment. It is an intermediate product of<br />
higher plant respiration and is formed from the burning of wood, tobacco and roasting<br />
coffee. It is also released from automobiles, trucks and <strong>air</strong>craft burning motor fuels,<br />
from industrial processes which synthesize other chemicals, e.g., production of<br />
perfumes, polyester resins and basic dyes, and from its use as a solvent in the rubber,<br />
tanning and paper industries.<br />
Benzene<br />
Benzene is also a volatile organic compound and is from a chemical family called<br />
aromatics or cyclic compounds. Aromatic compounds are formed in a ring with a series<br />
of single and doubled bonded carbon atoms, e.g., benzene, which has six carbon atoms<br />
with one hydrogen atom attached to each carbon in the ring.<br />
Benzene is a constituent in motor fuels, is used as a solvent for fats, waxes, resins, oils<br />
inks, paint, plastics and rubber, in the extraction of oils from nuts and seeds and is used in<br />
photogravure printing. Benzene is also used in the manufacture of detergents, explosives,<br />
pharmaceuticals, and dyestuffs. Benzene is released in the <strong>air</strong> from the combustion of<br />
motor fuels, fugitive emissions from vehicle fueling and fuel storage, burning of coal and<br />
oil, industrial process and fugitive emissions and from tobacco smoking.<br />
1,3-butadiene<br />
This compound is also a volatile organic compound and is from a chemical family of<br />
straight chain compounds called alkenes that, when formed, contain carbon-carbon<br />
44
double bonds are called dienes. 1,3-butadiene is the most common and is used in the<br />
production of rubber and plastics. It is also used in copolymers including acrylics.<br />
1,3-butadiene is released from the burning motor fuels by automobiles, trucks and<br />
<strong>air</strong>craft, from refineries and chemical manufacturing facilities (especially the plastic and<br />
rubber industries). It is also released by incineration of products in which it is contained,<br />
e.g. rubber, plastics and resins.<br />
Chromium<br />
Chromium is a naturally occurring element found in rocks, animals, plants, soil and in<br />
volcanic dust and gases. It occurs in the environment in two major valence states,<br />
trivalent chromium (Cr III) and hexavalent chromium Cr (VI). Chromium (III) is<br />
essential to normal glucose, protein and fat metabolism and is thus an essential dietary<br />
element. Chromium (VI) is much more toxic than Chromium (III) and is know human<br />
carcinogen.<br />
The metal chromium is used mainly for making steel and other alloys. Chromium<br />
compounds, in either Chromium (III) or (VI) forms, are used for chrome plating, the<br />
manufacture of dyes and pigments, leather and wood preservation, and treatment of<br />
cooling tower water. Smaller amounts are used in drilling muds, textiles, and toner for<br />
coping machines.<br />
Dioxins<br />
A dioxin is any compound that contains the dibenzo-p-dioxin nucleus and remains one of<br />
the most toxic compounds known to man. Dioxins have no known technical use and are<br />
not intentionally produced. They are formed as unwanted byproducts of certain chemical<br />
processes during the manufacture of chlorinated intermediates and in the combustion of<br />
chlorinated materials.<br />
Dioxins are emitted into the atmosphere from a wide variety of processes such as waste<br />
incineration, combustion of solid and liquid fuels in stationary sources for heat and power<br />
generation, crematories, iron and steel foundries/scrap metal melting, combustion-aided<br />
metal recovery, kraft pulp and paper production/black liquor combustion, internal<br />
combustion engines, carbon regeneration, forest fires, organic chemical manufacture and<br />
use and Portland cement manufacture.<br />
Polycyclic Organic Compounds (PAHs)<br />
The term polycyclic organic compounds defines not one compound, but a broad class of<br />
compounds which generally includes all organic compounds with more than one benzene<br />
ring, and which have a boiling point above 212 degrees (F). Sixteen polycyclic aromatic<br />
hydocarbons (PAHs), a subset of the class of polycyclic compounds, were designated by<br />
USEPA as the compounds of interest as Urban Air <strong>Toxic</strong>s. Notable such compounds are<br />
napthalene, anthracene, phenanthrene and chrysene.<br />
45
The principal formation mechanism for PAHs occurs as part of the fuel combustion<br />
process in many different types of source categories. The combustion processes which<br />
are much more significant in terms of <strong>air</strong> emissions include stationary external<br />
combustion for heat and electricity generation, internal combustion engines and turbines,<br />
motor vehicles ( cars, trucks, and <strong>air</strong>craft), and a variety of industrial fuel combustion<br />
sources.<br />
Tetrachloroethylene (perchloroethylene)<br />
Perchloroethylene is an organic chemical used in many industrial processes and is<br />
considered as a probable and possible human carcinogen. Perchloroethylene is used for<br />
dry cleaning and textile processing, as a chemical intermediate and as a degreasing agent.<br />
It is also used for rubber coatings, solvent soaps, printing inks, adhesives and glues,<br />
sealants, polishes, lubricants and silicones.<br />
Nickel<br />
Nickel is a silvery-white metal that is usually found in nature as a component of silicate,<br />
sulfide or arsenic ores. The most predominant forms of nickel in the atmosphere are<br />
nickel sulfate, sulfide and complex oxides of nickel. Various forms of nickel are<br />
considered to be human carcinogens.<br />
Nickel is used for nickel alloys, electroplating baths, batteries, textile dyes, coins, spark<br />
plugs, machinery parts, stainless-steel, nickel-chrome wires and catalysts.<br />
Toluene<br />
Toluene is a man-made aromatic hydrocarbon produced mostly from petroleum. The<br />
chemical intermediate is the predominant feedstock in benzene production and a key<br />
octane-boosting component for gasoline blending. Toluene is also used as a raw material<br />
in the production of other chemicals and as a solvent in paints and coatings, inks,<br />
adhesives, cosmetics and pharmaceuticals.<br />
Toluene is released into the <strong>air</strong> from several man-made sources including emissions from<br />
motor vehicles and <strong>air</strong>craft exhaust, gasoline marketing, chemical and paint<br />
manufacturing and cigarette smoke. Air emissions also result from the production of<br />
polymers (nylon), plastic soda bottles and polyurethanes.<br />
46