Ward profile â Cinderford West - Forest of Dean District Council
Ward profile â Cinderford West - Forest of Dean District Council
Ward profile â Cinderford West - Forest of Dean District Council

You also want an ePaper? Increase the reach of your titles
YUMPU automatically turns print PDFs into web optimized ePapers that Google loves.
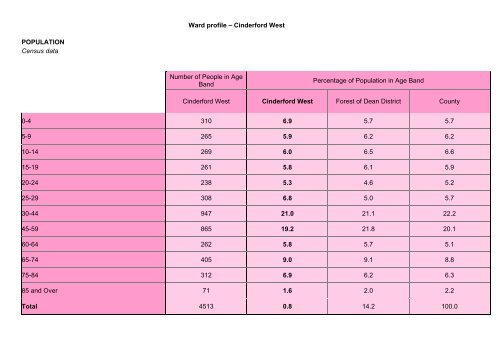
<strong>Ward</strong> <strong>pr<strong>of</strong>ile</strong> – <strong>Cinderford</strong> <strong>West</strong><br />
POPULATION<br />
Census data<br />
Number <strong>of</strong> People in Age<br />
Band<br />
Percentage <strong>of</strong> Population in Age Band<br />
<strong>Cinderford</strong> <strong>West</strong> <strong>Cinderford</strong> <strong>West</strong> <strong>Forest</strong> <strong>of</strong> <strong>Dean</strong> <strong>District</strong> County<br />
0-4 310 6.9 5.7 5.7<br />
5-9 265 5.9 6.2 6.2<br />
10-14 269 6.0 6.5 6.6<br />
15-19 261 5.8 6.1 5.9<br />
20-24 238 5.3 4.6 5.2<br />
25-29 308 6.8 5.0 5.7<br />
30-44 947 21.0 21.1 22.2<br />
45-59 865 19.2 21.8 20.1<br />
60-64 262 5.8 5.7 5.1<br />
65-74 405 9.0 9.1 8.8<br />
75-84 312 6.9 6.2 6.3<br />
85 and Over 71 1.6 2.0 2.2<br />
Total 4513 0.8 14.2 100.0
ETHNICITY<br />
2001, Office for National Statistics<br />
Number <strong>of</strong> People in Ethnic<br />
Group<br />
Percentage <strong>of</strong> Population in Ethnic Group<br />
<strong>Cinderford</strong> <strong>West</strong> <strong>Cinderford</strong> <strong>West</strong> <strong>Forest</strong> <strong>of</strong> <strong>Dean</strong> <strong>District</strong> County<br />
White 4461 98.8 99.1 97.1<br />
Non-White 52 1.2 0.9 2.9<br />
Mixed 24 0.5 0.5 0.9<br />
Black 0 0.0 0.1 0.6<br />
Asian 22 0.5 0.3 1.2<br />
Chinese or Other 15 0.3 0.2 0.4
HOUSING AND HOUSEHOLDS<br />
2004, MAIDeN Project<br />
2001, Office for National Statistics<br />
Number <strong>of</strong> Households in<br />
Category<br />
Percentage <strong>of</strong> Households in Category<br />
<strong>Cinderford</strong> <strong>West</strong> <strong>Cinderford</strong> <strong>West</strong> <strong>Forest</strong> <strong>of</strong> <strong>Dean</strong> <strong>District</strong> County<br />
Lone Person (non-pensioner) Households (2001) 274 14.0 11.0 14.5<br />
Lone Pensioner Households (2001) 347 17.7 14.6 14.9<br />
Lone Parent Households (2001) 103 5.2 4.6 5.1<br />
Lone Parent Households with Dependent<br />
Children (2001)<br />
Households with No Adult in Employment and<br />
Dependent Children (2001)<br />
Households Rented from a Social Landlord<br />
(2001)<br />
Number <strong>of</strong> Households Without Central Heating<br />
(2001)<br />
Number <strong>of</strong> Households with Shared Bathroom/<br />
Toilet (2001)<br />
109 5.5 4.7 5.1<br />
66 3.4 3.4 3.1<br />
392 20.0 14.3 13.7<br />
145 7.4 6.1 7.3<br />
6 0.3 0.2 0.3<br />
Households with No Car (2001) 519 26.4 16.2 18.7
Number <strong>of</strong> People in<br />
Category<br />
Percentage <strong>of</strong> People in Category<br />
<strong>Cinderford</strong> <strong>West</strong> <strong>Cinderford</strong> <strong>West</strong> <strong>Forest</strong> <strong>of</strong> <strong>Dean</strong> <strong>District</strong> County<br />
Number <strong>of</strong> People Claiming Housing Benefit<br />
(2004)<br />
353 7.8 4.6 5.0<br />
HEALTH<br />
2004, MAIDeN Project<br />
2001, Office for National Statistics<br />
Number <strong>of</strong> People in<br />
Category<br />
Percentage <strong>of</strong> Population in Category<br />
<strong>Cinderford</strong> <strong>West</strong> <strong>Cinderford</strong> <strong>West</strong> <strong>Forest</strong> <strong>of</strong> <strong>Dean</strong> <strong>District</strong> County<br />
All People with a Limiting Long-term Illness<br />
(2001)<br />
867 19.2 18.0 16.1<br />
People describing their Health as 'Good' (2001) 2874 63.7 68.0 70.5<br />
People describing their Health as 'Fairly Good'<br />
(2001)<br />
People describing their Health as 'Not Good'<br />
(2001)<br />
1198 26.5 23.6 21.9<br />
437 9.7 8.5 7.6<br />
All People who Provide Unpaid Care (2001) 458 10.1 10.6 9.9
People Providing 1 to 19 hours <strong>of</strong> Unpaid Care<br />
per Week (2001)<br />
People Providing 20 to 49 hours <strong>of</strong> Unpaid Care<br />
per Week (2001)<br />
People Providing Over 50 hours <strong>of</strong> Unpaid Care<br />
per Week (2001)<br />
294 6.5 7.5 7.3<br />
57 1.3 1.1 0.9<br />
107 2.4 2.0 1.7<br />
Number <strong>of</strong> Deaths from All Causes (1994-2003) 483 10.7 10.9 10.5<br />
Number <strong>of</strong> Deaths from All Causes in People<br />
Aged 75 and Under (1994-2003)<br />
Number <strong>of</strong> People Admitted to Hospital in an<br />
Emergency (2003)<br />
Number Under 5s Admitted to Hospital in an<br />
Emergency (2003)<br />
Number Over 75s Admitted to Hospital in an<br />
Emergency (2003)<br />
Number <strong>of</strong> People Admitted to Hospital Following<br />
Accidents (2003)<br />
Number <strong>of</strong> Under 5s Admitted to Hospital<br />
Following Accidents (2003)<br />
Number <strong>of</strong> Over 75s Admitted to Hospital<br />
Following Accidents (2003)<br />
212 4.7 4.3 3.8<br />
380 8.4 6.7 7.2<br />
23 6.9 8.5 10.3<br />
108 27.4 23.8 25.4<br />
201 4.5 4.4 4.8<br />
21 6.3 4.6 5.5<br />
53 13.5 14.4 16.9
SOCIAL SERVICES<br />
2004, MAIDeN Project<br />
Number <strong>of</strong> People in<br />
Category<br />
Percentage <strong>of</strong> Population in Category<br />
<strong>Cinderford</strong> <strong>West</strong> <strong>Cinderford</strong> <strong>West</strong> <strong>Forest</strong> <strong>of</strong> <strong>Dean</strong> <strong>District</strong> County<br />
Number <strong>of</strong> Social Services Open and Active<br />
Cases (2002)<br />
Number <strong>of</strong> Social Services Open and Active<br />
Cases Involving Under 5s (2002)<br />
Number <strong>of</strong> Social Services Open and Active<br />
Cases Involving Over 75s (2002)<br />
132 2.9 2.5 2.5<br />
10 3.0 1.2 1.1<br />
57 14.5 14.2 14.1<br />
Number <strong>of</strong> Social Services Referrals (2004) 386 8.6 6.3 6.1<br />
Number <strong>of</strong> Social Services Referrals Involving<br />
Under 5s (2003)<br />
Number <strong>of</strong> Social Services Referrals Involving<br />
Over 75s (2004)<br />
19 5.7 2.1 1.9<br />
174 44.2 41.6 42.1<br />
Number <strong>of</strong> Looked After Children (2001) 13 0.3 0.3 0.5
EDUCATION AND QUALIFICATIONS<br />
2004, MAIDeN Project<br />
2001, Office for National Statistics<br />
Number <strong>of</strong> People in<br />
Category<br />
Percentage <strong>of</strong> Population in Category<br />
<strong>Cinderford</strong> <strong>West</strong> <strong>Cinderford</strong> <strong>West</strong> <strong>Forest</strong> <strong>of</strong> <strong>Dean</strong> <strong>District</strong> County<br />
Number <strong>of</strong> People with No Qualifications (2001) 1225 27.1 21.6 17.8<br />
Number <strong>of</strong> People with Level One Qualifications<br />
(2001)<br />
Number <strong>of</strong> People with Level four or five<br />
Qualifications (2001)<br />
Number <strong>of</strong> Children Eligible for Free School<br />
Meals (2001)<br />
700 15.5 13.5 12.8<br />
273 6.0 11.9 15.1<br />
70 6.3 5.1 5.4<br />
Number <strong>of</strong> Tests in<br />
Category<br />
Percentage <strong>of</strong> Tests in Category<br />
<strong>Cinderford</strong> <strong>West</strong> <strong>Cinderford</strong> <strong>West</strong> <strong>Forest</strong> <strong>of</strong> <strong>Dean</strong> <strong>District</strong> County<br />
Number <strong>of</strong> Low Scoring Key Stage 1, 2 and 3<br />
Tests (2004)<br />
175 38.4 23.0 22.5
EMPLOYMENT<br />
2004, MAIDeN Project<br />
2001, Office for National Statistics<br />
Number <strong>of</strong> People in<br />
Category<br />
Percentage <strong>of</strong> Population in Category<br />
<strong>Cinderford</strong> <strong>West</strong> <strong>Cinderford</strong> <strong>West</strong> <strong>Forest</strong> <strong>of</strong> <strong>Dean</strong> <strong>District</strong> County<br />
Number <strong>of</strong> People that are Unemployed (2001) 122 2.7 2.1 1.8<br />
Number <strong>of</strong> People aged 16 to 24 that are<br />
Unemployed (2001)<br />
Number <strong>of</strong> People aged Over 50 that are<br />
Unemployed (2001)<br />
Number <strong>of</strong> Unemployed People that have Never<br />
Worked (2001)<br />
Number <strong>of</strong> People that are Long-term<br />
Unemployed (2001)<br />
Number <strong>of</strong> People that are Economically Inactive<br />
that are Permanently Sick or Disabled (2001)<br />
44 9.8 5.9 4.4<br />
28 1.5 1.2 1.0<br />
6 0.1 0.2 0.1<br />
41 0.9 0.6 0.5<br />
182 4.0 3.4 2.7<br />
Number <strong>of</strong> Registered Childcare Places (2003) 113 13.4 15.2 18.9
CRIME, DISORDER AND COMMUNITY SAFETY<br />
2004, MAIDeN Project<br />
Number <strong>of</strong> Events in<br />
Category<br />
County rate (1 = average, 2 = double etc)<br />
<strong>Cinderford</strong> <strong>West</strong> <strong>Cinderford</strong> <strong>West</strong> <strong>Forest</strong> <strong>of</strong> <strong>Dean</strong> <strong>District</strong> County<br />
Number <strong>of</strong> Domestic Burglaries (2003-2004) 20 1.0 0.9 1.4<br />
Number <strong>of</strong> Thefts From Motor Vehicles (2003-<br />
2004)<br />
73 1.6 0.8 1.1<br />
Number <strong>of</strong> Thefts Of Motor Vehicles (2003-2004) 24 0.5 0.3 0.4<br />
Number <strong>of</strong> Violent Crimes (2003-2004) 75 1.7 1.2 1.6<br />
Number <strong>of</strong> Serious and Fatal Road Traffic<br />
Accidents (2001-2004)<br />
5 0.1 0.2 0.2<br />
Number <strong>of</strong> People in<br />
Category<br />
Percentage <strong>of</strong> Population in Category<br />
<strong>Cinderford</strong> <strong>West</strong> <strong>Cinderford</strong> <strong>West</strong> <strong>Forest</strong> <strong>of</strong> <strong>Dean</strong> <strong>District</strong> County<br />
Number <strong>of</strong> Young Offenders Resident in Area<br />
(2003)<br />
16 0.4 0.5 0.9