biodiversity of butterflies from districts kotli, mirpur and ... - Zsp.com.pk
biodiversity of butterflies from districts kotli, mirpur and ... - Zsp.com.pk
biodiversity of butterflies from districts kotli, mirpur and ... - Zsp.com.pk

Create successful ePaper yourself
Turn your PDF publications into a flip-book with our unique Google optimized e-Paper software.
Pakistan J. Zool., vol. 39(1), pp. 27-34, 2007.<br />
Biodiversity <strong>of</strong> Butterflies <strong>from</strong> Districts Kotli,<br />
Mirpur <strong>and</strong> Bhimber, Azad Kashmir<br />
MUHAMMAD RAFIQUE KHAN, MUHAMMAD ATHER RAFI, M. MUNIR,<br />
SHOUKAT HUSSAIN, MIRZA WASIM BAIG AND M. WAHEED KHAN<br />
University College <strong>of</strong> Agriculture, Rawalakot, Azad Kashmir, Pakistan (MRK, MM, SH, MWB), Insect Pest<br />
Management Institute, National Agriculture Research Centre, Islamabad, Pakistan (MAR) <strong>and</strong> Department <strong>of</strong><br />
Computer Sciences, Azad Jammu <strong>and</strong> Kashmir University, Muzaffarabad, Pakistan (MWK)<br />
Abstract.- The adult <strong>butterflies</strong> were collected <strong>from</strong> 7 localities <strong>of</strong> district Kotli, 10 localities <strong>of</strong> district Mirpur<br />
<strong>and</strong> 10 localities <strong>from</strong> district Bhimber throughout the year 2000 ( <strong>from</strong> Kotli) <strong>and</strong> 1999 (<strong>from</strong> Mirpur <strong>and</strong> Bhimber).<br />
A total <strong>of</strong> 16 species <strong>from</strong> Kotli, 20 species <strong>from</strong> Mirpur <strong>and</strong> 19 species <strong>from</strong> Bhimber belonging to 7 families <strong>and</strong> 30<br />
genera were collected. Diversity was calculated by using the Shannon-Wiener's diversity index along with its<br />
equitability <strong>com</strong>ponent, Margalef’s index, Simpson's index <strong>and</strong> Nakmura's R1 index. The calculated values <strong>of</strong><br />
diversity indices showed that <strong>from</strong> Kotli, lowest diversity was calculated <strong>from</strong> Sensah <strong>and</strong> Dongi <strong>and</strong> highest diversity<br />
was calculated <strong>from</strong> Fateh Pur, Khuiretta <strong>and</strong> Holar. From Mirpur, the lowest diversity was calculated <strong>from</strong> Khari<br />
Sharif <strong>and</strong> Mangla where as the highest diversity was calculated <strong>from</strong> Mirpur city <strong>and</strong> Islam Garh. From Bhimber, the<br />
lowest diversity was calculated <strong>from</strong> Bernala, Kot Jamel <strong>and</strong> Kadala, where as the highest diversity was calculated<br />
<strong>from</strong> Chumb, Berhing <strong>and</strong> Choki. None <strong>of</strong> the species reported to be threatened to be<strong>com</strong>e extinct nor any species<br />
reported to be favoured by enriched flora. The richness, evenness <strong>and</strong> abundance were found to be normal in the<br />
surveyed area.<br />
Key words: Biodiversity <strong>of</strong> <strong>butterflies</strong>, diversity indices, abundance <strong>of</strong> <strong>butterflies</strong>, Azad Kashmir.<br />
INTRODUCTION<br />
Butterflies are regarded as the symbol <strong>of</strong><br />
beauty <strong>and</strong> grace since the dawn <strong>of</strong> the time <strong>and</strong> are<br />
best known insect due to their diurnal habitats <strong>and</strong><br />
are readily recognized by their bright colours,<br />
shapes <strong>and</strong> graceful flights, which give pleasure to<br />
everyone (Oven, 1971; Dal, 1978). Butterflies are<br />
found almost in every part <strong>of</strong> the world where ever<br />
the flowering plants are found; inhabiting even very<br />
high altitudes except Arctic <strong>and</strong> Antarctic <strong>and</strong><br />
mountainous which are covered with perpetual snow<br />
<strong>and</strong> glaciers (Hassan, 1997). Systematically the<br />
<strong>butterflies</strong> have been studied since 18th century <strong>and</strong><br />
19,238 species had been documented by 1998<br />
(Heppner, 1998) world wide. This figure is not<br />
constant because <strong>of</strong> the continuous discovery <strong>of</strong> new<br />
<strong>butterflies</strong> (Gooden, 1977; Stokoe, 1974; Alatolo,<br />
1981; Green <strong>and</strong> Huang, 1998; Roberts, 2001) but<br />
the fauna <strong>of</strong> the area under study is not well<br />
documented <strong>and</strong> the <strong>biodiversity</strong> <strong>of</strong> the <strong>butterflies</strong><br />
<strong>from</strong> the area under study was never calculated<br />
0030-9923/2007/0001-0027 $ 8.00/0<br />
Copyright 2007 Zoological Society <strong>of</strong> Pakistan.<br />
before except a few attempts such as Khan et al.<br />
(2003, 2004) <strong>and</strong> Rafi et al. (2000) <strong>and</strong> this is the<br />
first attempt to calculate the distributional diversity,<br />
which will be continuously monitored with the<br />
passage <strong>of</strong> time to observe any changes in the <strong>biodiversity</strong><br />
<strong>of</strong> <strong>butterflies</strong> in this area <strong>of</strong> Azad Kashmir.<br />
Biological diversity or <strong>biodiversity</strong> is<br />
important scientifically, socially, economically,<br />
educationally, culturally, aesthetically <strong>and</strong><br />
recreationally <strong>and</strong> it is the one <strong>of</strong> the major features<br />
<strong>of</strong> the animal <strong>com</strong>munities (Kempton <strong>and</strong> Tailor,<br />
1976; Kempton, 1979; Kempton <strong>and</strong> Wedderburn,<br />
1978; Maguran, 1988). It is the number <strong>of</strong> species<br />
present <strong>and</strong> their numerical <strong>com</strong>position. Diversity<br />
is the niche time stability dependent (Bowman, et<br />
al., 1971; McIntosh, 1967; Pielou, 1966, 1969,<br />
1975) which means if a large number <strong>of</strong> niche is<br />
present it will support higher diversity (Begon et al.,<br />
1966; Maguran, 1988; Rosenzweig, 1978; S<strong>and</strong>ers,<br />
1978). Generally homogeneous conditions yield low<br />
diversity whereas heterogeneous conditions yield<br />
higher diversity (Begon et al., 1966; May, 1975;<br />
Maguran, 1988).<br />
Diversity indices are a measure <strong>of</strong> a way in
28<br />
M.R. KHAN ET AL.<br />
which individuals in an ecological <strong>com</strong>munity are<br />
distributed among the species (Roultledge, 1979). A<br />
co-efficient <strong>of</strong> diversity is a convenient way <strong>of</strong><br />
demonstrating the variety <strong>of</strong> species present in a<br />
habitat or a sample <strong>and</strong> the abundance <strong>of</strong> the<br />
individuals within the species (McArthur, 1965).<br />
The measure <strong>of</strong> the diversity <strong>of</strong> the fauna will<br />
represent the number <strong>and</strong> the available niches<br />
present in the environment. If niche heterogeneity is<br />
great, it will support a more diverse fauna <strong>and</strong> thus<br />
will result in a higher coefficient or index <strong>of</strong><br />
diversity in that area or habitat (Gray, 1980).<br />
Azad Jammu <strong>and</strong> Kashmir is the librated part<br />
<strong>of</strong> the state <strong>of</strong> Jammu-Kashmir. It has an area <strong>of</strong><br />
13397 sq Km <strong>and</strong> only 13% area is cultivated. It is<br />
situated between longitude 73-75 <strong>and</strong> latitude 39-37.<br />
Average rainfall is approximately 150cm annually.<br />
The topography is mainly hilly <strong>and</strong> mountainous<br />
with valleys <strong>and</strong> plains in some places. Azad<br />
Jammu <strong>and</strong> Kashmir consists <strong>of</strong> 7 <strong>districts</strong>: namely:<br />
Muzzafarabad, Bagh, Poonch, Sudhnoti, Mirpur,<br />
Kotli <strong>and</strong> Bhimber.<br />
The present study <strong>of</strong> exploring the butterfly<br />
fauna <strong>and</strong> to calculate the diversity <strong>of</strong> <strong>butterflies</strong><br />
<strong>from</strong> Azad Kashmir was started in 1998 <strong>and</strong><br />
diversity <strong>of</strong> <strong>butterflies</strong> <strong>from</strong> 4 <strong>districts</strong> have already<br />
been published elsewhere (Khan et al., 2003, 2004).<br />
The present study <strong>of</strong> exploring the <strong>butterflies</strong> fauna<br />
<strong>and</strong> calculation <strong>of</strong> diversity <strong>from</strong> district Kotli,<br />
Mirpur <strong>and</strong> Bhimber was started in 1999 <strong>and</strong><br />
<strong>com</strong>pleted in 2000.<br />
the use <strong>of</strong> aerial nets <strong>and</strong> searching <strong>and</strong> picking<br />
method. The maximum number <strong>of</strong> specimens was<br />
collected because for the calculation <strong>of</strong> diversity<br />
abundance <strong>and</strong> richness both are needed. The<br />
collected specimens were brought to the laboratory<br />
<strong>and</strong> identified. Total number <strong>of</strong> specimens collected<br />
<strong>from</strong> district Kotli were 969 (Table II), <strong>from</strong> district<br />
Mirpur 2235 (Table IV) <strong>and</strong> <strong>from</strong> district Bhimber<br />
1708 (Table VI).<br />
MATERIALS AND METHODS<br />
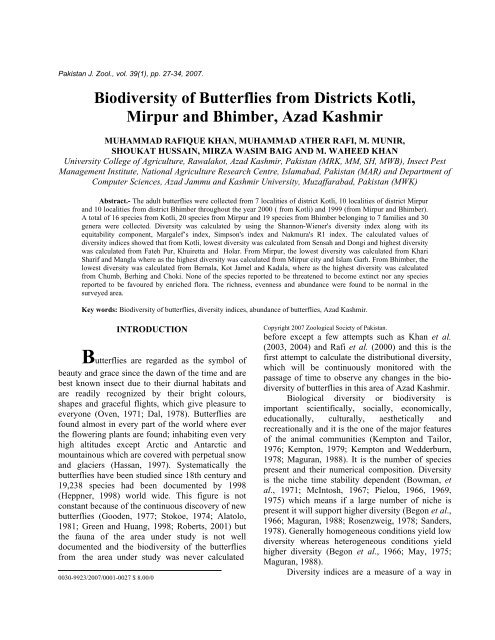
The specimens were collected <strong>from</strong> 7<br />
localities <strong>of</strong> district Kotli namely: Holar, Sensah,<br />
Sarsawa, Kotli city, Fateh Pur, Khuiretta <strong>and</strong> Dongi<br />
(Fig. 1) in 1999 <strong>and</strong> 10 localities <strong>from</strong> district<br />
Mirpur namely: Dudial, Palak, Chak Sawari, Islam<br />
Garh, Mirpur city, Mangla, Jatlan, Jery Kas <strong>and</strong><br />
Afzal Pur in 2001 <strong>and</strong> 10 localities <strong>from</strong> district<br />
Bhimber namely: Samahni, Choki, Mnghloora,<br />
Pindi Chunja, Bhimber city, Berhing, Kadala,<br />
Barnala, Kot Jamel <strong>and</strong> Chumb (Fig. 1) in 2000.<br />
The localities were visited fortnightly <strong>from</strong><br />
mid March to the end <strong>of</strong> October. All the efforts<br />
were made to collect the maximum specimens <strong>from</strong><br />
each locality by using different methods, such as,<br />
Fig. 1. Map <strong>of</strong> Districts Kotli, Mirpur <strong>and</strong><br />
Bhimber, Azad Kashmir showing the sampled<br />
sites.<br />
The rank lists were prepared <strong>from</strong> each<br />
locality <strong>of</strong> each district by the help <strong>of</strong> which the<br />
diversity indices were calculated. A collective rank<br />
list along with the lists <strong>of</strong> taxa collected <strong>from</strong> each<br />
locality <strong>of</strong> each district was also prepared (Tables II,<br />
IV, VI). To calculate the diversity <strong>of</strong> the <strong>butterflies</strong><br />
4 diversity indices were used namely: Shannon-<br />
Wiener's diversity index (Shannon <strong>and</strong> Wiener,<br />
1963) along with its equitability <strong>com</strong>ponent,
BUTTERFLIS OF AZAD KASHMIR 29<br />
Margalef’s index (Margalef, 1968, 1969), Simpson's<br />
index (Simpson, 1949) <strong>and</strong> Nakamura's RI index<br />
(Nakamura <strong>and</strong> Toshima, 1995, 1999).<br />
The form <strong>of</strong> the Shannon-Wiener' s diversity<br />
index used is H= -I (pi)log 2 pi), where, "pi" is the<br />
proportion with in the sample <strong>of</strong> the number <strong>of</strong> the<br />
individuals <strong>of</strong> "ith" species <strong>and</strong> it is denoted by<br />
"ni/N", where, "ni" is the total number <strong>of</strong><br />
individuals. But the form <strong>of</strong> the index used in the<br />
present study is: H=C {log 10 N-1/N∑(nrlog 10 nr)},<br />
where "N" is the total number <strong>of</strong> the individuals,<br />
"nr" is the rank abundance in "ith" species <strong>and</strong> "C"<br />
is the conversion factor <strong>from</strong> log 2 to log 10 .<br />
The form <strong>of</strong> the Shannon's equitability used<br />
is: J=H/H max , where, "H" is the Shannon- Wiener's<br />
diversity index <strong>and</strong> "H max " is the log 2 <strong>of</strong> "S", where,<br />
"S" is the total number <strong>of</strong> species in the sample.<br />
Shannon's equitability is derived <strong>from</strong> its<br />
diversity index <strong>and</strong> it is the ratio between the actual<br />
diversity <strong>of</strong> the sample <strong>and</strong> maximum diversity<br />
which occurs when all the species are equally<br />
abundant.<br />
The form <strong>of</strong> the Margalef’s index used is:<br />
D=S-1/LogeN, where "S" is the number <strong>of</strong> species<br />
<strong>and</strong> "N" is the total number <strong>of</strong> individuals.<br />
The Simpson's index used is D=I-∑(pi) 2<br />
where, "pi" proportion <strong>of</strong> "ith" species <strong>and</strong> is<br />
calculated as "ni/N", where, "ni" is the number <strong>of</strong><br />
individuals in "ith" species <strong>and</strong> "N" is the total<br />
number <strong>of</strong> individuals in the sample but the form <strong>of</strong><br />
the index used in the present study is: D=∑[ni(ni-<br />
1/N(N-I)], where, "ni" is the number <strong>of</strong> individuals<br />
in "ith" species <strong>and</strong> "N" is the total number <strong>of</strong><br />
individuals in the sample.<br />
The last index used is RI index (Nakamura,<br />
1995, 1999). The form <strong>of</strong> the index used is<br />
RI=∑Ri/S(M-l), where "S" is the number <strong>of</strong><br />
investigated species <strong>of</strong> insects, "M" is the number <strong>of</strong><br />
rank <strong>of</strong> abundance (0,1,2,3,.. .M-l) <strong>and</strong> "Ri" is the<br />
rank value <strong>of</strong> "ith" species in the sample.<br />
RESULTS AND DISCUSSION<br />
During the present study, 4 diversity indices<br />
were used. The first index used is the Shannon-<br />
Wiener's diversity index (Shannon-Wiener, 1963).<br />
This index is distribution dependent <strong>and</strong> suffers<br />
least <strong>from</strong> criticism <strong>of</strong> validity in biological data<br />
(Gray, 1980).<br />
The calculated values <strong>of</strong> this index at district<br />
Kotli ranged <strong>from</strong> 2.145 (Dongi)-3.29 (Sarsawa).<br />
Remaining all the stations yielded the values in<br />
between above mentioned values. Most <strong>of</strong> the sites<br />
yielded the values near the 3.2 (Holar, Kotli city,<br />
Fateh Pur <strong>and</strong> Khuiretta) (Table I).<br />
The calculated values <strong>of</strong> this index <strong>from</strong><br />
Mirpur yielded the lowest values at Khari Sharif<br />
(3.135) <strong>and</strong> highest values 3.75 at Mirpur city (3.75)<br />
<strong>and</strong> Islam Garh (3.70) where as remaining all the<br />
stations yielded the values between them 3.2<br />
(Mangla) - 3.60 (Afzal Pur) (Table III).<br />
The calculated values <strong>of</strong> this index <strong>from</strong><br />
different localities <strong>of</strong> district Bhimber ranged <strong>from</strong><br />
2.97 (Barnala) - 3.75 (Berhing) <strong>and</strong> remaining all<br />
the stations yielded the values between these values<br />
(Table V).<br />
The calculated values showed that <strong>butterflies</strong><br />
are well distributed almost at all the localities <strong>of</strong><br />
these three <strong>districts</strong> <strong>of</strong> Azad Kashmir. However, the<br />
more densely vegetated sites yielded slightly higher<br />
diversity values <strong>and</strong> barren <strong>and</strong> less vegetated areas<br />
yielded slightly lower diversity values.<br />
The Shannon's equitability's calculated values<br />
<strong>from</strong> district Kotli ranged <strong>from</strong> 0.707 (Dongi) -<br />
0.903 (Sarsawa) <strong>and</strong> remaining all the sites yielded<br />
the values between these two (Table I). Whereas<br />
<strong>from</strong> Mirpur district the lowest equitability values<br />
were obtained <strong>from</strong> Mangla (0.785) <strong>and</strong><br />
Chakasawary (0.717) <strong>and</strong> the highest equitability<br />
values were obtained <strong>from</strong> Islam Garh (0.905)<br />
(Table III). Remaining all the sites yielded the<br />
equitability values ranged <strong>from</strong> 0.785 to 0.905.<br />
The calculated values <strong>of</strong> Shannon's<br />
equitability index <strong>from</strong> district Bhimber ranged<br />
<strong>from</strong> 0.781 (Barnala) to 0.910 (Choki). Remaining<br />
all the sites yielded the values in between these two<br />
(Table V), which means the equitability <strong>of</strong> the<br />
<strong>butterflies</strong> <strong>from</strong> all the three <strong>districts</strong> <strong>of</strong> Azad<br />
Kashmir is not very much different <strong>from</strong> each other.<br />
The calculated values <strong>of</strong> Shannon-Wiener' s<br />
diversity index very much coincide with the values<br />
<strong>of</strong> Shannon's equitability which means the evenness,<br />
richness <strong>and</strong> abundance <strong>of</strong> <strong>butterflies</strong> <strong>from</strong> all the<br />
localities <strong>of</strong> the sampled <strong>districts</strong> support normal<br />
distribution <strong>and</strong> none <strong>of</strong> the above sampled stations<br />
showed disturbed <strong>com</strong>munities, because the values
30<br />
M.R. KHAN ET AL.<br />
<strong>of</strong> Shannon's diversity index in perturbed situations<br />
is usually more than 4.5 (Pieloul, 1966, 1969, 1975).<br />
Table I. Calculated values <strong>of</strong> diversity indices <strong>from</strong> different localities <strong>of</strong> District Kotli, Azad Kashmir.<br />
S.No.<br />
Name <strong>of</strong> place<br />
Shannon-Wiener’s<br />
index (H’)<br />
Shannon’s<br />
Equitability J’<br />
Margalef’s<br />
index (d)<br />
Simpson’s index<br />
D 1-D 1/D<br />
R1 Index<br />
1 Holar 3.278 0.754 2.078 0.087 0.912 11.422 0.600<br />
2 Sensah 2.74 0.711 2.521 0.134 0.865 7.440 0.571<br />
3 Sarsawah 3.298 0.903 2.464 0.1 06 0.893 9.400 0.583<br />
4 Kotli City 3.199 0.874 2.450 0.123 0.876 8.101 0.583<br />
5 Fateh Pur 3.278 0.827 2.557 0.152 0.847 6.578 0.583<br />
6 Khuiretta 3.274 0.832 2.216 0.143 0.856 6.944 0.590<br />
7 Dongi 2.415 0.707 2.378 0.162 0.834 6.142 0.600<br />
Table II.-<br />
The collective rank list along with the list <strong>of</strong> Taxa collected <strong>from</strong> different localities <strong>of</strong> District Kotli, Azad<br />
Kashmir.<br />
Rank Name <strong>of</strong> Taxa Abundance Sarsawa Sensah Holar Kotli<br />
city<br />
Khuiretta Nikyal Dongi<br />
1 Pieris brassicae 229 17 70 14 33 41 35 19<br />
2 Papilio philoxenus 173 27 41 13 20 31 25 16<br />
3 Gonepteryx rhamni 113 13 29 15 17 19 11 9<br />
4 Argynnis kamala 79 9 19 13 12 14 7 5<br />
5 Argynnis hyperbius, 67 12 15 18 9 6 5 2<br />
6 Colias erate 64 13 19 11 12 - 9 -<br />
7 Pontia daplidice 47 9 18 - 9 6 5 -<br />
8 Vanessa cardui 43 - 10 9 6 8 7 3<br />
9 Papilio machaon 41 4 15 10 - 6 - 6<br />
10 Danaus chrysippus 31 12 - 9 6 - 3 1<br />
11 Catopsila crocale 26 9 6 - 4 3 1 3<br />
12 Colias electo 19 - 7 6 - 4 1 1<br />
13 Colias fieldi 17 3 4 5 - 2 3 -<br />
14 Aglais urticae 12 1 2 - 4 3 - 2<br />
15 Phalantha phalantha 6 1 2 - 1 - 2 -<br />
16 Papilio polyctor 2 - 1 - 1 - - -<br />
No <strong>of</strong> Individuals ∑N=969 N=130 N=258 N=123 N=134 N=143 N= 109 N=67<br />
No <strong>of</strong> Species 13 15 11 13 12 13 11<br />
Table III.<br />
Calculated values <strong>of</strong> diversity indices <strong>from</strong> different localities <strong>of</strong> District Mirpur, Azad Kasmir.<br />
S.No.<br />
Name <strong>of</strong> place<br />
Shannon-Wiener’s<br />
index (H)<br />
Shannon’s<br />
Equitability J’<br />
Margalef’s<br />
index (d)<br />
Simpson’s index<br />
D 1-D 1/D<br />
R1 Index<br />
1 Dudia1 3.431 0.822 2.925 0.127 0.872 7.818 0.558<br />
2 Pa1ak 3.374 0.830 2.667 0.114 0.885 8.733 0.566<br />
3 Chaksawari 3.454 0.717 3.022 0.099 0.900 10.010 0.566<br />
4 Mirpur city 3.754 0.900 3.015 0.088 0.911 11.286 0.558<br />
5 Mang1a 3.210 0.785 3.119 0.167 0.833 5.988 0.562<br />
6 Afza1 Pur 3.600 0.880 2.780 0.094 0.905 10.593 0.562<br />
7 Jery Kas 3.472 0.888 2.748 0.1 05 0.894 9.451 0.571<br />
8 KhariSharif 3.135 0.802 2.779 0.155 0.844 6.430 0.571<br />
9 Aka1 Garh 3.324 0.872 2.868 0.116 0.884 8.620 0.576
BUTTERFLIS OF AZAD KASHMIR 31<br />
10 Islam Garh 3.700 0.905 2,797 0.082 0.918 12.195 0.562<br />
Table IV.-<br />
The collective rank list along with the list <strong>of</strong> Taxa collected <strong>from</strong> localities <strong>of</strong> District Kotli, Azad Kashmir.<br />
Rank<br />
Name <strong>of</strong> Taxa<br />
Abundance<br />
Dudial<br />
Mangla<br />
Mirpur city<br />
Khari Sharif<br />
Akal Garh<br />
Islam Garh<br />
Chak Sawari<br />
Palak<br />
Jari Kas<br />
Afzal Pur<br />
1 Pieris brassicae 491 99 61 45 49 23 35 30 61 36 52<br />
2 Junonia orithya 312 40 21 35 25 15 40 21 41 23 51<br />
3 Colias erate 214 31 11 24 16 11 30 14 36 14 27<br />
4<br />
Danaus<br />
200 25 14 30 9 4 35 12 27 14 30<br />
chrysippus<br />
5 Pontia daplidice 160 21 11 20 12 5 27 10 21 13 20<br />
6 Pieris canidia 159 19 9 17 13 9 21 11 19 14 27<br />
7 Danaus genutia 141 20 10 19 7 6 17 9 21 12 20<br />
8 Eurema hecabe 121 15 9 17 6 3 21 7 14 10 19<br />
9 Papilio polytes 90 17 5 14 3 - 19 5 11 6 10<br />
10 Pieris rapae 82 6 2 11 - 5 21 6 9 3 19<br />
11 Pieris ajaka 73 12 3 15 6 - 12 3 6 2 14<br />
12<br />
Papilio<br />
61 9 3 11 2 3 11 7 5 - 10<br />
demoleus<br />
13 Colias fieldi 50 7 3 9 - 2 7 4 - 7 11<br />
14 Graphium<br />
31 6 - 5 2 - 5 2 3 5 3<br />
cloanthus<br />
15 Vanessa cardui 19 3 1 4 - 5 2 1 1 2 -<br />
16 Papilio polyctor 12 2 1 3 1 1 - - 1 2 -<br />
17 Papilio<br />
9 - 3 1 2 - 1 1 - - 1<br />
machaon<br />
18 Euthalia garuda 5 - 1 - 1 - 1 - 1 - 1<br />
19 Ariadne merione 3 1 - 1 - - - - - - 1<br />
20 Danaus<br />
limniace<br />
2 1 - - - 1 - - - - -<br />
No <strong>of</strong><br />
∑N=2235 N=334 N=168 N=281 N=154 N=93 N=305 N=143 N=277 N=163 N=316<br />
Individuals<br />
No <strong>of</strong> Species 18 17 18 15 13 17 16 16 15 17<br />
Table V.<br />
Calculated values <strong>of</strong> diversity indices <strong>from</strong> different localities <strong>of</strong> district Bhimber, Azad Kasmir.<br />
S.No.<br />
Name <strong>of</strong> place<br />
Shannon-Wiener’s<br />
index (H)’<br />
Shannon’s<br />
Equitability J’<br />
Margalef’s<br />
index (d)<br />
Simpson’s index<br />
D 1-D 1/D<br />
R1 Index<br />
1 Pindi Chunja 3.460 0.885 3.151 0.110 0.889 9.041 0.571<br />
2 Chumb 3.638 0.856 3.253 0.099 0.900 10.060 0.555<br />
3 Kot J amil 3.166 0.883 2.278 0.126 0.874 7.936 0.590<br />
4 Barnalah 2.977 0.781 2.612 0.163 0.836 6.116 0.576<br />
5 Samahni 3.009 0.790 2.423 0.156 0.843 6.397 0.673<br />
6 Berhing 3.754 0.900 3.016 0.087 0.913 11.494 0.556<br />
7 Choki 3.643 0.910 2.739 0.087 0.913 11.494 0.566<br />
8 Bhimber city 3.325 0.873 2.426 0.116 0.883 8.583 0.576<br />
9 Mangloora 3.428 0.900 3.116 0.094 0.905 10.559 0.583<br />
10 Kadalah 3.004 0.788 2.903 0.165 0.834 6.049 0.673
32<br />
M.R. KHAN ET AL.<br />
Table VI.-<br />
The collective rank list along with the list <strong>of</strong> Taxa collected <strong>from</strong> different localities <strong>of</strong> District Bhimber, Azad<br />
Kashmir.<br />
Rank<br />
Name <strong>of</strong> Taxa<br />
Abundance<br />
Berhing<br />
Choki<br />
Bhimber city<br />
Samahni<br />
Chumb<br />
Bernala<br />
Kot Jamal<br />
Pindi<br />
Chunja<br />
Mangloora<br />
Kadala<br />
1 Pieris brassicae 340 49 37 45 51 45 37 25 13 11 27<br />
2<br />
Danuas<br />
252 31 19 25 45 35 36 21 11 9 20<br />
chrysippus<br />
3 Colias erate 216 35 16 35 41 39 21 14 5 7 3<br />
4 Colias electo 172 19 21 17 26 26 17 15 14 8 9<br />
5 Peris ajaka 140 26 17 21 13 13 9 21 11 9 -<br />
6<br />
Danuas<br />
95 21 19 23 9 5 4 5 2 - 7<br />
limniace<br />
7 Junonia orithya 88 13 24 11 3 19 - 7 9 2 -<br />
8 Pontia daplidice 66 5 31 9 - 7 5 - 5 3 1<br />
9<br />
Papilio<br />
61 17 15 - 5 5 4 3 - 5 7<br />
demoleus<br />
10 Pieris rapae 47 15 11 5 - 9 3 - 1 3 -<br />
11<br />
Papilio<br />
41 11 13 - 5 3 - 4 2 - 3<br />
machaon<br />
12 Pieris canidia 42 10 6 6 - 13 2 - 3 - 2<br />
13 Danaus genutia 31 9 - 3 2 11 1 2 - 3 -<br />
14 Catopsila<br />
29 6 - 7 5 4 - - 3 - 4<br />
pomana<br />
15 Eurema hecabe 27 - 2 3 - 8 - 7 4 2 1<br />
16 Papilio polytes 24 6 - - 5 7 2 - 1 1 2<br />
17 Ariadne merione 19 5 4 - 3 2 2 1 - 1 1<br />
18 Euthalia garuda 12 3 2 2 1 1 2 - 1 - -<br />
19 Satyrus spp. 6 1 2 - - 1 - - - 1 1<br />
No <strong>of</strong><br />
∑N=1708 N=282 N=239 N=212 N=214 N=253 N=145 N=125 N=85 N=65 N=88<br />
Individuals<br />
No <strong>of</strong> Species 18 16 14 14 19 14 12 15 14 14<br />
The calculated values <strong>of</strong> Margalef’s index<br />
<strong>from</strong> Kotli ranged <strong>from</strong> 2.078 (Holar) 2.55 (Fateh<br />
Pur). Remaining all the localities yielded the<br />
diversity values in between these two, indicating<br />
that richness was slightly higher at Fateh Pur <strong>and</strong><br />
was slightly lower at Holar (Table I). The yielded<br />
values <strong>of</strong> this index <strong>from</strong> all the localities visited<br />
indicate that there was no any big difference in the<br />
richness <strong>of</strong> <strong>butterflies</strong> in these <strong>districts</strong>.<br />
The calculated values <strong>of</strong> Margalef’s index<br />
<strong>from</strong> district Mirpur ranged <strong>from</strong> 2.66 (Palak) to<br />
3.02 (Chwawari). Remaining all the station yielded<br />
this index values <strong>from</strong> 2.77 to 3.01 (Table III),<br />
indicating that richness <strong>of</strong> <strong>butterflies</strong> <strong>from</strong> all the<br />
sites <strong>of</strong> this district did not show much difference in<br />
the <strong>butterflies</strong>' distribution.<br />
The calculated values <strong>of</strong> Margalef’s index<br />
<strong>from</strong> district Bhimber ranged <strong>from</strong> 2.27 sites (Kot<br />
Jamil) to 3.25 (Chumb). Remaining all the yielded<br />
the diversity values ranging <strong>from</strong> 2.42 to 3.01<br />
(Table V). Indicating that species richness was<br />
slightly lower at Kot Jamil <strong>and</strong> slightly higher at<br />
Chumb.<br />
The calculated values <strong>of</strong> Simpson's index (D)<br />
at district Kotli ranged <strong>from</strong> 0.087 (Holar) to 0.162<br />
(Dongi). The calculated values <strong>of</strong> Simposon's index<br />
(I-D) ranged <strong>from</strong> 0.834 (Dongi) to 0.912 (Holar).<br />
The calculated values <strong>of</strong> this index (I/D) ranged
BUTTERFLIS OF AZAD KASHMIR 33<br />
<strong>from</strong> 6.142 (Dongi) to 11.499 (Holar) (Table I).<br />
The Simpson's index is sampled size<br />
dependent <strong>and</strong> values decrease with the increase in<br />
sample size. Therefore, its reciprocal <strong>from</strong> I-D or<br />
I/D is usually used in ecological data, which<br />
indicates that the calculated values <strong>of</strong> index<br />
increases with increasing diversity (James <strong>and</strong><br />
Shugart, 1970).<br />
During the present study, both the reciprocal<br />
forms <strong>of</strong> the index were used <strong>and</strong> calculated values<br />
(D) <strong>of</strong> this index <strong>from</strong> district Mir Pur ranged <strong>from</strong><br />
0.082, 0.088 (Islamgaragh <strong>and</strong> Mirpur City<br />
respectively) to 0.155 (Khari Sharif). The calculated<br />
values <strong>of</strong> I-D, ranged <strong>from</strong> 0.833 (Mangla) to 0.918<br />
(Islam Garh). The calculated values <strong>of</strong> I/D ranged<br />
<strong>from</strong> 6.430 (Chechian) to 11.286 (Mirpur city)<br />
which indicates that species abundance was highest<br />
at Mirpur City <strong>and</strong> was lowest at Khari Sharif. The<br />
calculated values <strong>of</strong> Simpson's index (D) at sites <strong>of</strong><br />
district Bhimber ranged <strong>from</strong> 0.087 (Berhring <strong>and</strong><br />
Choki respectively) to 0.165 (Kadala).<br />
The calculated values <strong>of</strong> I-D ranged <strong>from</strong><br />
0.834 (Kadala) to 0.913 (Bhering <strong>and</strong> Choki<br />
respectively). The calculated values <strong>of</strong> I/D ranged<br />
<strong>from</strong> 6.049 (Kadala) to 11.494 (Berhing <strong>and</strong> Choki,<br />
respectively). The highest abundance was obtained<br />
<strong>from</strong>, Berhing <strong>and</strong> Choki, <strong>and</strong> lowest abundance<br />
was obtained <strong>from</strong> Kadala. Berhing <strong>and</strong> Choki are<br />
adjacent sites to each other <strong>and</strong> the flora <strong>of</strong> both the<br />
sites is almost the same. The highest abundance<br />
obtained is due to dense flowering plants.<br />
The last index used is R1 index <strong>of</strong> Nakamura<br />
(Nakamura <strong>and</strong> Toshima, 1995, 1999). The index<br />
shows the number <strong>of</strong> species <strong>and</strong> individuals in the<br />
sampled area. If the calculated values go near to 1 it<br />
indicates that more <strong>and</strong> more species <strong>and</strong><br />
individuals are recorded <strong>from</strong> the area.<br />
The calculated values <strong>of</strong> this index <strong>from</strong> Kotli<br />
ranged <strong>from</strong> 0.0575 (Sensah) to 0.600 (Holar <strong>and</strong><br />
Dongi, respectively). Remaining all the stations<br />
yielded the values between these values (Table I),<br />
indicating that the number <strong>of</strong> species <strong>and</strong><br />
individuals is not very much different at all the<br />
sampled sites <strong>of</strong> this district.<br />
The calculated values <strong>of</strong> RI <strong>from</strong> Mirpur<br />
district ranged <strong>from</strong> 0.558 (Dudial) to 0.571<br />
(Jerykas <strong>and</strong> Khari Sharif) (Table III).<br />
The calculated values <strong>of</strong> RI index <strong>from</strong> all the<br />
sites <strong>of</strong> district Bhimber ranged <strong>from</strong> 0.555<br />
(Chumb) to 0.673 (Kadala <strong>and</strong> Samahani) (Table<br />
V).<br />
The calculated values <strong>of</strong> all indices <strong>from</strong> all<br />
the sampled sited <strong>of</strong> district Kotli, Mirpur <strong>and</strong><br />
Bhimber showed that despite the big difference in<br />
the total number <strong>of</strong> individuals there was not a big<br />
difference in diversity <strong>of</strong> <strong>butterflies</strong> in the area<br />
under the present study.<br />
The present study is the first study <strong>of</strong> this<br />
type in the area. Therefore, it is very difficult to say<br />
whether any species is supported by the enriched<br />
flora or any species is at the verge <strong>of</strong> extinction.<br />
Therefore, it is suggested that the area under<br />
present study should be continuously monitored to<br />
observe any changes in the diversity <strong>of</strong> the<br />
<strong>butterflies</strong>, because the changes in the diversity can<br />
only be observed through continuous monitoring<br />
<strong>and</strong> <strong>com</strong>paring the data <strong>of</strong> very year.<br />
REFERENCES<br />
ALATOLO, 1981. Problems in measurement <strong>of</strong> ecology. Gikos,<br />
37: 199-205.<br />
BEGON, M., HARPER, 1.L. AND TOWNSEND, C.R., 1966.<br />
Ecology: Individual populations <strong>and</strong> <strong>com</strong>munities, 3rd<br />
Edn. Blackwell Science Ltd., Cambridge, pp: 348.<br />
BOWMAN, K.O., HUTCHINSON, K., ODUM, E.P. AND<br />
SHENTON, L.R., 1971. Comments on the distribution<br />
<strong>of</strong> indices <strong>of</strong> diversity. In: Statistical ecology (eds. G.P.<br />
Patel, E.C. Pielou <strong>and</strong> W.E. Water), vol. 3, pp. 315-366.<br />
Pennsylvania state university park, PA.<br />
DAL, B., 1978. The <strong>butterflies</strong> <strong>of</strong> northern Europe. Croom<br />
Helm, London, PP.128..<br />
GOODEN, R., 1977. The wonderful world <strong>of</strong> <strong>butterflies</strong> <strong>and</strong><br />
moths. Hamlyn Pub. Group Ltd., London, pp. 96.<br />
GRAY, J.S., 1980.Why do ecological monitoring Mar. Poll.<br />
Bull., 11: 62-66.<br />
GREEN, J. AND HUANG, J., 1998. Butterflies <strong>of</strong> South<br />
Vancouver Isl<strong>and</strong>. Co-op Report. Royal British<br />
Columbia Museum. Available online at:<br />
http://rbcm.rcbm.gov.bc.ca/nh_papers/anneh/text/cover<br />
page.html.<br />
HASSAN, S.A., 1997. Biogeography <strong>and</strong> diversity <strong>of</strong> <strong>butterflies</strong><br />
<strong>of</strong> North West Himalaya. In: Biodiversity <strong>of</strong> Pakistan<br />
(eds. S.A. Mutfti, C.A. Wood <strong>and</strong> S.A. Hassan), pp.<br />
181-204. Pakistan Museum <strong>of</strong> Natural History,<br />
Islamabad, Florida Museum <strong>of</strong> National History,<br />
Gainesville, USA.<br />
HEPPNER, J., 1998. Classification <strong>of</strong> Lepidoptera. Part I<br />
Introduction. Holarctic. Lep. Vol. 5, Supplement 1, pp.
34<br />
M.R. KHAN ET AL.<br />
148.<br />
JAMES, F.C. AND SHUGART, H.H., 1970. A quantitative<br />
method <strong>of</strong> habitat description. Auduvon Field Notes,<br />
December 1970, pp. 727-736.<br />
KEMPTON, R.A., 1979. Structure <strong>of</strong> species abundance <strong>and</strong><br />
measurement <strong>of</strong> diversity. Biometrics, 35: 307-322.<br />
KEMPTON, RA AND TAILOR, L.R, 1976. Models <strong>and</strong><br />
statistics <strong>and</strong> species diversity. Nature, 262: 818-820.<br />
KEMPTON, R.A. AND WEDDERBURN, R.W.M., 1978. A<br />
<strong>com</strong>parison <strong>of</strong> three measures <strong>of</strong> species diversity.<br />
Biometrics. 34: 25-27.<br />
KHAN, M.R, AHMED, R., KHAN, M.R, HAY A T, A <strong>and</strong><br />
KHALID, M., 2003. Diversity <strong>of</strong> <strong>butterflies</strong> <strong>from</strong><br />
District Bagh, Azad Kashmir. Pakistan J. biol. Sci., 6:<br />
2007-2009.<br />
KHAN, M.R., NASIM, M., KHAN, M R.AND. RAFI, M.A,<br />
2004. Diversity <strong>of</strong> <strong>butterflies</strong> <strong>from</strong> District<br />
Muzaffarabad, Azad Kashmir. Pakistan J. biol. Sci., 7:<br />
324-327.<br />
KHAN, M.R., RAFI, M. A., ILYAS, M. AND TSAFDAR, M.,<br />
2000. Distribution <strong>and</strong> diversity <strong>of</strong> genus Papilio<br />
(Lepidoptera: Papilionidae) in Rawalpindi <strong>and</strong><br />
Islamabad. Pakistan J. Sci., 51: 1-3.<br />
McARTHUR, R.H., 1965. Patterns <strong>of</strong> species diversity. Biol.<br />
Rev., 40: 510-33.<br />
MAGURAN, A.E., 1988. Ecological diversity <strong>and</strong> its<br />
measurement. Princeton University Press, pp. 168.<br />
MARGALEF, S. R, 1968. Perspective in ecological theory.<br />
University <strong>of</strong> Chicago press, Chicago <strong>and</strong> London, pp.<br />
111.<br />
MARGALEF, S. R., 1969. Diversity <strong>and</strong> stability: A practical<br />
proposal: a model <strong>of</strong> inters- dependence. Bookhaven<br />
Symp. Biol., 22: 25-37.<br />
MAY, R.M., 1975. Patterns <strong>of</strong> species <strong>of</strong> abundance <strong>and</strong><br />
diversity. In: Ecology <strong>and</strong> evolution <strong>of</strong> <strong>com</strong>munities<br />
(eds. M.L. Cody <strong>and</strong> J.M. Diamond), pp. 61-129.<br />
Harvard University Press, Cambridge, MA.<br />
McINTOSH, R.P., 1967. An index <strong>of</strong> diversity <strong>and</strong> the relation<br />
<strong>of</strong> certain concept Top diversity. Ecology, 48: 392-404.<br />
NAKAMURA, H. AND TOSHIMA, H., 1995. Environmental<br />
evaluation by distribution <strong>of</strong> <strong>butterflies</strong> on the case in<br />
Kagawa prefecture using the RI index. Japan J.<br />
environ. Ent. Zool., 6: 143-159.<br />
NAKAMURA, H. AND TOSHIMA, H., 1999. A method for<br />
environmental evaluation using indicator groups <strong>of</strong><br />
<strong>butterflies</strong> <strong>and</strong> RI index. Japan J. environ. Ent. Zool.,<br />
10: 143-159.<br />
OWEN, D.F., 1971. Tropical butteflies. Clarendon press,<br />
Oxford. pp. 214.<br />
SMART, P., 1989. The illustrated encyclopedia <strong>of</strong> the butterfly<br />
world. Salam<strong>and</strong>er Books Ltd., London, United<br />
Kingdom. pp. 275.<br />
PIELOU, E.C., 1966. Species diversity <strong>and</strong> pattern diversity in<br />
the study <strong>of</strong> ecological succession. J. Theor. Biol., 10:<br />
370-383.<br />
PIELOU, E.C., 1969. An introduction <strong>of</strong> mathematical ecology,<br />
John Wiley, New York.<br />
PIELOU, E.C., 1975. Ecological diversity. John Wiley, New<br />
York.<br />
RAFI, M.A., KHAN, M.R. AND IRSHAD, M., 2000.<br />
Papiolinid (Swallowtails) <strong>butterflies</strong> <strong>of</strong> Pakistan. Gul<br />
Awan Printers, pp. 33.<br />
ROBERTS, T.J., 2001. Butterflies <strong>of</strong> Pakistan. Oxford<br />
University Press, London <strong>and</strong> New York, pp. 200.<br />
ROSENZWEIG, M.L., 1995. Species diversity in space <strong>and</strong><br />
time. Cambridge University Press, New York, pp. 234.<br />
ROUTLEDGE, R.D., 1979. Diversity indices: which ones are<br />
admissible. J. theor. Biol., 76: 503-515.<br />
SANDERS, H.L., 1978. Marine benthic diversity: A<br />
<strong>com</strong>parative study. Am. Natural., 2: 243-282.<br />
SHANNON, E.R. AND WEINER, W., 1963. The mathematical<br />
theory <strong>of</strong> <strong>com</strong>munication. University <strong>of</strong> Illinois Press,<br />
Urbana, Illinois, pp. 117.<br />
STOKOE, W.J., 1974. The observers book <strong>of</strong> <strong>butterflies</strong>. W.J.<br />
Frederick Warne <strong>and</strong> Co., London. Pp. 191.<br />
THOMAS, G., ISAAC, D.K. AND JAGDISH, C.P., 1992.<br />
Common <strong>butterflies</strong> <strong>of</strong> India. World Wide Fund for<br />
Nature-India, Oxford University Press, Oxford, New<br />
York. pp. 67.<br />
(Received 28 July 2004, revised 30 November 2005)