Transitioning from - Value Chain Group
Transitioning from - Value Chain Group
Transitioning from - Value Chain Group

Create successful ePaper yourself
Turn your PDF publications into a flip-book with our unique Google optimized e-Paper software.
T r a N S I T I O N I N g F r O M S & O P T O I B P<br />
strategic management issues and opportunities.<br />
This more mature process is now becoming known<br />
in the industry as Integrated Business Planning<br />
(IBP).<br />
S&OP/IBP requires a combination of people<br />
exhibiting the appropriate supporting behaviors, a<br />
process that is regular and routine, and tools with<br />
the ability to process aggregate and detail plans,<br />
facts, and assumptions. Properly implemented,<br />
the process provides both leadership and<br />
management with regular and routine visibility and<br />
transparency of past and projected performance.<br />
Key performance indicators and metrics are an<br />
integral part of the IBP process. The most current<br />
and best view of the business, both quantitative<br />
and qualitative, allows leadership and management<br />
the opportunity to make the best decisions at the<br />
optimal time helping to ensure optimum business<br />
results.<br />
Industry research continues to show that<br />
companies that do S&OP/IBP get benefits <strong>from</strong><br />
the process. Further, those companies that do it<br />
well get significantly greater benefits than those<br />
that only operate with basic demand, supply, and<br />
inventory balancing in the near term.<br />
The best place to start an S&OP/IBP improvement<br />
project is to get an independent view of the state<br />
of your current S&OP process today. From this<br />
diagnostic, a plan to move <strong>from</strong> S&OP to IBP can<br />
be developed and implemented. Companies that<br />
implement IBP fully in line with the best practices<br />
can expect continued improvement in business<br />
results and should gain an edge on competitors<br />
that operate with a less mature process or no<br />
process at all.<br />
As one company leader stated, “IBP is a team sport<br />
at the highest level of the organization.”<br />
It Pays to Do Integrated Business Planning Well<br />
Put simply, companies that do Integrated Business<br />
Planning well achieve greater benefits than<br />
companies that do not. This is the conclusion <strong>from</strong><br />
independent studies by such research firms as AMR,<br />
Aberdeen, and Ventana as well as the performance<br />
gains documented by Oliver Wight clients.<br />
Here is a sampling of the range of improvements<br />
achieved by 40 Oliver Wight clients:<br />
•<br />
•<br />
•<br />
•<br />
•<br />
•<br />
Increased Demand Plan Accuracy by 18 to 25%<br />
Increased Sales Revenue by 10 to 15%<br />
Increased On-Time Delivery by 10 to 50%<br />
Inventory Reduction by 18 to 46%<br />
Safety Stock Reduction by 11 to 45%<br />
Increased Productivity by 30 to 45%<br />
The above results should cause companies to ask:<br />
“What if our company improved its performance by<br />
the above amounts How would it impact customer<br />
satisfaction How would it improve our financial<br />
performance”<br />
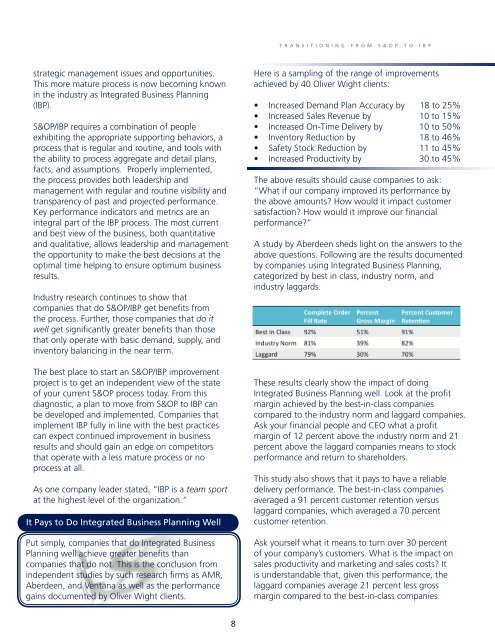
A study by Aberdeen sheds light on the answers to the<br />
above questions. Following are the results documented<br />
by companies using Integrated Business Planning,<br />
categorized by best in class, industry norm, and<br />
industry laggards.<br />
These results clearly show the impact of doing<br />
Integrated Business Planning well. Look at the profit<br />
margin achieved by the best-in-class companies<br />
compared to the industry norm and laggard companies.<br />
Ask your financial people and CEO what a profit<br />
margin of 12 percent above the industry norm and 21<br />
percent above the laggard companies means to stock<br />
performance and return to shareholders.<br />
This study also shows that it pays to have a reliable<br />
delivery performance. The best-in-class companies<br />
averaged a 91 percent customer retention versus<br />
laggard companies, which averaged a 70 percent<br />
customer retention.<br />
Ask yourself what it means to turn over 30 percent<br />
of your company’s customers. What is the impact on<br />
sales productivity and marketing and sales costs It<br />
is understandable that, given this performance, the<br />
laggard companies average 21 percent less gross<br />
margin compared to the best-in-class companies.<br />
8