Media Kit - Australia's Best Magazines
Media Kit - Australia's Best Magazines
Media Kit - Australia's Best Magazines
- No tags were found...

Create successful ePaper yourself
Turn your PDF publications into a flip-book with our unique Google optimized e-Paper software.
Demographics<br />
2011 media kit<br />
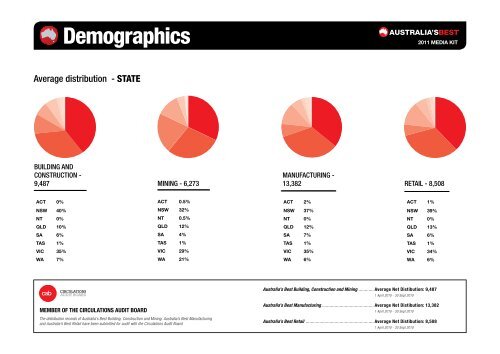
Average distribution - STATE<br />
Building AND<br />
Construction -<br />
9,487<br />
mining - 6,273<br />
MANUFACTURING -<br />
13,382<br />
RETAIL - 8,508<br />
ACT 0%<br />
ACT 0.5%<br />
ACT 2%<br />
ACT 1%<br />
NSW 40%<br />
NSW 32%<br />
NSW 37%<br />
NSW 39%<br />
NT 0%<br />
NT 0.5%<br />
NT 0%<br />
NT 0%<br />
QLD 10%<br />
QLD 12%<br />
QLD 12%<br />
QLD 13%<br />
SA 6%<br />
SA 4%<br />
SA 7%<br />
SA 6%<br />
TAS 1%<br />
TAS 1%<br />
TAS 1%<br />
TAS 1%<br />
VIC 35%<br />
VIC 29%<br />
VIC 35%<br />
VIC 34%<br />
WA 7%<br />
WA 21%<br />
WA 6%<br />
WA 6%<br />
Australia’s <strong>Best</strong> Building, Construction and Mining ............. Average Net Distibution: 9,487<br />
1 April 2010 - 30 Sept 2010<br />
Member of the circulations audit board<br />
The distribution records of Australia’s <strong>Best</strong> Building, Construction and Mining, Australia’s <strong>Best</strong> Manufacturing<br />
and Australia’s <strong>Best</strong> Retail have been submitted for audit with the Circulations Audit Board.<br />
Australia’s <strong>Best</strong> Manufacturing .......................................... Average Net Distibution: 13,382<br />
1 April 2010 - 30 Sept 2010<br />
Australia’s <strong>Best</strong> Retail ....................................................... Average Net Distibution: 8,508<br />
1 April 2010 - 30 Sept 2010