Earnings Update FY12
Earnings Update FY12
Earnings Update FY12

Create successful ePaper yourself
Turn your PDF publications into a flip-book with our unique Google optimized e-Paper software.
<strong>Earnings</strong> <strong>Update</strong><br />
<strong>FY12</strong>
Kotak Bank - Standalone Highlights (<strong>FY12</strong>)<br />
<strong>FY12</strong> PAT<br />
` 1,085 cr<br />
(` 818 cr)<br />
up 33% yoy<br />
Restructured<br />
Loans - Net<br />
` 30 cr<br />
(` 67 cr)<br />
0.08% of Net Loans<br />
* Excluding acquired stressed assets<br />
Figures in brackets are FY11 numbers<br />
Networth<br />
` 7,946 cr<br />
(` 6,796 cr)<br />
CAR<br />
17.5% (19.9%)<br />
as per Basel II<br />
Loans<br />
` 39,079 cr<br />
(` 29,329 cr)<br />
up 33% yoy<br />
Tier 1<br />
15.7% (18.0%)<br />
as per Basel II<br />
Net<br />
NPA *<br />
0.57% (0.50%)<br />
CASA<br />
` 12,402 cr<br />
(` 8,791 cr)<br />
32% of total deposits<br />
2
Consolidated Highlights (<strong>FY12</strong>)<br />
<strong>FY12</strong> PAT<br />
` 1,832 cr<br />
(` 1,567 cr)<br />
up 17% yoy<br />
NIM<br />
4.8% (5.2%)<br />
* Excluding acquired stressed assets<br />
Figures in brackets are FY11 numbers<br />
Networth<br />
` 12,901 cr<br />
(` 10,963 cr)<br />
RoA<br />
2.2% (2.4%)<br />
Loans<br />
` 53,144 cr<br />
(` 41,242 cr)<br />
up 29% yoy<br />
Total Assets<br />
` 92,349 cr<br />
(` 73,681 cr)<br />
up 25% yoy<br />
Net<br />
NPA *<br />
0.49% (0.43%)<br />
Book Value<br />
` 174.2 per share<br />
(` 148.8 per share)<br />
3
Consolidated Advances & Investments<br />
` cr<br />
As on<br />
Dec 31, 2011<br />
As on<br />
Mar 31, 2011<br />
As on<br />
Mar 31, 2012<br />
Commercial vehicles & Construction equipment 7,540 6,251 7,798<br />
Agriculture Finance 4,894 4,220 5,714<br />
Auto loans 9,771 8,550 10,600<br />
Mortgage Loans 7,935 6,877 8,333<br />
Personal loans 1,689 1,307 1,868<br />
Corporate Banking 16,698 10,916 14,168<br />
Others 4,320 3,121 4,663<br />
Total Advances 52,847 41,242 53,144<br />
Investments/ Treasury Assets * 19,902 18,279 23,261<br />
Total Advances and Investments 72,749 59,521 76,405<br />
* Does not include policy holders’ investments<br />
4
Consolidated PAT<br />
` cr FY03 FY07 FY08 FY09 FY10 FY11 <strong>FY12</strong><br />
Kotak Mahindra Bank 45 141 294 276 561 818 1,085<br />
Kotak Mahindra Prime 11 57 101 157 166 318 385<br />
Kotak Securities 24 256 409 107 260 182 126<br />
Kotak Mahindra Capital Company 31 68 115 13 24 52 6<br />
Kotak Mahindra Old Mutual Life<br />
Insurance<br />
(42) (58) (72) 14 69 101 203<br />
Kotak Mahindra AMC & Trustee Co 3 12 8 16 73 17 22<br />
International subsidiaries - 35 64 24 80 51 (11)<br />
Kotak Investment Advisors (1) - 13 48 40 33 36<br />
Kotak Mahindra Investments 15 27 43 14 34 24 15<br />
Total 86 538 975 669 1,307 1,596 1,867<br />
Minority Interest, Equity Affiliates,<br />
others<br />
(13) - 16 (17) - (29) (35)<br />
Consolidated PAT 73 538 991 652 1,307 1,567 1,832<br />
5
Consolidated PAT – Quarterly<br />
` cr Q3<strong>FY12</strong> Q4FY11 Q4<strong>FY12</strong><br />
Kotak Mahindra Bank 276 249 297<br />
Kotak Mahindra Prime 104 87 97<br />
Kotak Securities 24 36 50<br />
Kotak Mahindra Capital Company 4 30 5<br />
Kotak Mahindra Old Mutual Life Insurance 47 71 57<br />
Kotak Mahindra AMC & Trustee Co 3 3 3<br />
International subsidiaries (4) 15 3<br />
Kotak Investment Advisors 7 6 10<br />
Kotak Mahindra Investments 3 6 6<br />
Total 464 503 528<br />
Minority Interest, Equity Affiliates, others (1) (12) (7)<br />
Consolidated PAT 463 491 521<br />
6
(`cr )<br />
Consolidated PAT – Quarterly Trend<br />
600<br />
500<br />
400<br />
300<br />
200<br />
100<br />
-<br />
240<br />
211<br />
2008 2009 2010 2011 2012<br />
` cr 2008 2009 2010 2011 2012<br />
Q1 146 150 257 328 416<br />
Q2 242 160 300 364 432<br />
Q3 363 131 331 384 463<br />
Q4 240 211 419 491 521<br />
419<br />
491<br />
Q1 Q2 Q3 Q4<br />
521<br />
7
Consolidated Profit (PBT) Mix<br />
PBT<br />
`cr<br />
PAT<br />
`cr<br />
151<br />
58%<br />
68%<br />
-28%<br />
59%<br />
37%<br />
53%<br />
43%<br />
18%<br />
67%<br />
2% 4%<br />
FY03 FY07<br />
-7%<br />
FY08 -6% FY09 FY10 FY11 <strong>FY12</strong><br />
73<br />
2%<br />
773 1,424 1,033 1,883 2,274 2,673<br />
11%<br />
10%<br />
13% 14%<br />
Financing Capital Market Insurance Asset Management<br />
23%<br />
59%<br />
6%<br />
4%<br />
15%<br />
75%<br />
8%<br />
7%<br />
82%<br />
538 991 652 1,307 1,567 1,832<br />
8<br />
3%
Consolidated Key Financials<br />
15,573 21,985 22,498<br />
FY07 FY08 FY09 FY10 FY11 <strong>FY12</strong><br />
49.6<br />
Advances (` cr) Total Assets (` cr)<br />
29,724<br />
41,242<br />
53,144<br />
28,631<br />
FY07 FY08 FY09 FY10 FY11 <strong>FY12</strong><br />
3,233<br />
40,597 40,234<br />
5,824 6,523<br />
55,115<br />
Book Value per share (`) Networth (` cr)<br />
84.5<br />
94.3<br />
113.6<br />
148.8<br />
FY07 FY08 FY09 FY10 FY11 <strong>FY12</strong><br />
174.2<br />
7,911<br />
73,681<br />
92,349<br />
10,963 12,901<br />
FY07 FY08 FY09 FY10 FY11 <strong>FY12</strong><br />
9
Consolidated Key Ratios<br />
2.3<br />
2.9<br />
RoA (%) RoE (%)<br />
1.6<br />
2.7<br />
2.4<br />
FY07 FY08 FY09 FY10 FY11 <strong>FY12</strong><br />
4.9<br />
5.2<br />
2.2<br />
NIM (%) NPA (%)<br />
5.8 5.8<br />
5.2<br />
4.8<br />
FY07 FY08 FY09 FY10 FY11 <strong>FY12</strong><br />
19.6<br />
22.3<br />
10.5<br />
18.2<br />
16.4<br />
FY07 FY08 FY09 FY10 FY11 <strong>FY12</strong><br />
0.5<br />
0.2<br />
0.9<br />
0.3<br />
2.3<br />
2.2<br />
1.2 1.1<br />
15.4<br />
* Excluding acquired<br />
stressed assets portfolio<br />
1.1 1.1<br />
0.4<br />
FY07 FY08 FY09 FY10 FY11 <strong>FY12</strong><br />
Gross NPA (%) * Net NPA (%)*<br />
0.5<br />
10
Integrated Financial Services<br />
Life Insurance<br />
Banking<br />
Capital Markets<br />
Asset<br />
Management<br />
11
Financing Business<br />
15,573<br />
21,985 22,498<br />
29,724<br />
41,242<br />
FY07 FY08 FY09 FY10 FY11 <strong>FY12</strong><br />
768<br />
Advances (` cr) Net NPA (%)*<br />
53,144<br />
Consumer Commercial Corporate<br />
Mar-09<br />
1.2%<br />
2.1%<br />
Jun-09<br />
Mar-10<br />
1.1%<br />
Net Interest Income (` cr) $ PAT (` cr) $<br />
1,449<br />
1,869<br />
2,233<br />
2,680<br />
27%<br />
32%<br />
41%<br />
3,218<br />
* Excluding acquired<br />
stressed assets portfolio<br />
FY07 FY08 FY09 FY10 FY11 <strong>FY12</strong><br />
FY07 FY08 FY09 FY10 FY11 <strong>FY12</strong><br />
$ of financing entities<br />
12<br />
225<br />
438 447<br />
761<br />
Mar-11<br />
0.4%<br />
1,160<br />
0.5%<br />
Mar-12<br />
1,485
Bank Key Ratios<br />
0.9%<br />
1.1%<br />
RoA (%) NPA (%)<br />
1.0%<br />
1.7% 1.8% 1.8%<br />
FY07 FY08 FY09 FY10 FY11 <strong>FY12</strong><br />
13.5%<br />
8.8%<br />
CAR & Tier I (%)<br />
18.7% 20.0% 18.4% 19.9% 17.5%<br />
14.5% 16.1% 15.4% 18.0% 15.7%<br />
FY07 FY08 FY09 FY10 FY11 <strong>FY12</strong><br />
CAR % Tier I (%)<br />
0.5%<br />
0.2%<br />
1.0%<br />
0.4%<br />
2.5% 2.4%<br />
1.3% 1.3%<br />
* Excluding acquired<br />
stressed assets portfolio<br />
1.2% 1.2%<br />
0.5% 0.6%<br />
FY07 FY08 FY09 FY10 FY11 <strong>FY12</strong><br />
Gross NPA (%) * Net NPA (%) *<br />
Asset Quality<br />
• Net restructured loans outstanding in the Bank (as % of<br />
net advances) as on<br />
� Mar 31, 2011 - ` 67 cr (0.23%)<br />
� Dec 31, 2011 - ` 38 cr (0.10%)<br />
� Mar 31, 2012 - ` 30 cr (0.08%)<br />
• PCR# as on Mar 31, 2012 - 70.14%<br />
# as per RBI circular.<br />
13
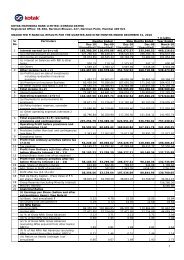
Bank Profit and Loss<br />
` cr Q3<strong>FY12</strong> Q4FY11 Q4<strong>FY12</strong> FY11 <strong>FY12</strong><br />
Net Interest Income 651 565 688 2,097 2,513<br />
Other Income 282 248 254 781 977<br />
Net Total Income 933 813 942 2,878 3,490<br />
Employee Cost 226 218 225 751 872<br />
Other Operating Expenses 264 227 272 802 963<br />
Operating Expenditure 490 445 497 1,553 1,835<br />
Operating Profit 444 368 445 1,325 1,655<br />
Provision & contingencies 31 (7) 4 137 55<br />
PBT 413 375 441 1,188 1,600<br />
Provision for Tax 137 126 144 370 515<br />
PAT 276 249 297 818 1,085<br />
14
Bank Segment performance<br />
` cr Q3<strong>FY12</strong> Q4FY11 Q4<strong>FY12</strong> FY11 <strong>FY12</strong><br />
Corporate/Wholesale Banking 265 170 296 544 997<br />
Retail Banking 145 99 121 339 566<br />
Treasury & BMU* 3 106 22 305 35<br />
Unallocated Income - - 2 - 2<br />
Total 413 375 441 1,188 1,600<br />
* Balance Sheet Management Unit<br />
15
Bank Advances & Investments<br />
` cr<br />
` cr<br />
As on<br />
Dec 31, 2011<br />
As on<br />
Dec 31, 2011<br />
As on<br />
Mar 31, 2011<br />
As on<br />
Mar 31, 2011<br />
As on<br />
Mar 31, 2012<br />
Commercial vehicles & Construction equipment 7,540 6,251 7,798<br />
Agriculture Finance 4,894 4.220 5,714<br />
Mortgage loans 7,935 6,877 8,333<br />
Personal loans 1,689 1,305 1,868<br />
Corporate Banking 15,492 9,417 12,785<br />
Others 2,221 1,259 2,581<br />
Total Advances 39,772 29,329 39,079<br />
As per segmental classification<br />
As on<br />
Mar 31, 2012<br />
Retail 19.634 17,672 21,062<br />
Corporate 20,139 11,657 18,017<br />
Total Advances 39,772 29,329 39,079<br />
Investment / Treasury Assets 18,438 17,121 21,567<br />
Total Advances and Investments 58,210 46,451 60,646<br />
16
Bank Balance Sheet<br />
` cr<br />
` cr<br />
As on<br />
Dec 31, 2011<br />
As on<br />
Dec 31, 2011<br />
As on<br />
Mar 31, 2011<br />
As on<br />
Mar 31, 2011<br />
As on<br />
Mar 31, 2012<br />
Net Worth 7,670 6,796 7,946<br />
Deposits 38,385 29,261 38,537<br />
CA 6,189 5,460 7,352<br />
SA 4,426 3,331 5,050<br />
Term Deposit 21,841 15,388 22,531<br />
Certificate of Deposit 5,929 5,082 3,604<br />
Borrowings 15,242 11,724 16,595<br />
Other Liabilities and Provisions 2,876 3,070 2,588<br />
Total 64,173 50,851 65,666<br />
As on<br />
Mar 31, 2012<br />
Cash, Bank and Call 3,430 2,471 2,635<br />
Investments 18,438 17,121 21,567<br />
Government Securities 15,360 13,198 16,587<br />
Other Securities 3,078 3,923 4,980<br />
Advances 39,772 29,329 39,079<br />
Fixed Assets & Other Assets 2,533 1,930 2,385<br />
Total 64,173 50,851 65,666<br />
17
Consumer Banking - Liabilities<br />
� 500 Branches in CY13<br />
� Increased cross sell of<br />
asset products<br />
� Savings account interest<br />
deregulation positive<br />
impact<br />
o savings balances<br />
o number of savings accounts<br />
� Added over 1.73 lac<br />
customer accounts for the<br />
quarter<br />
� TD sweep to total deposit<br />
ratio at 7%<br />
� Focus on affluent<br />
segment<br />
400<br />
350<br />
300<br />
250<br />
200<br />
150<br />
100<br />
50<br />
CA deposit ` cr *<br />
-<br />
SA deposit ` cr<br />
CASA %<br />
* excl IPO float<br />
135<br />
105<br />
313<br />
178<br />
No of Branches / ATM’s<br />
387<br />
217<br />
492<br />
249<br />
710<br />
321<br />
848<br />
355<br />
FY07 FY08 FY09 FY10 FY11 <strong>FY12</strong><br />
1,360<br />
887<br />
22<br />
2,734<br />
1,518<br />
27<br />
Branches ATMs<br />
3,418<br />
1,700<br />
4,992 5,460<br />
2,471 3,331<br />
7,352<br />
5,050<br />
33 31 30 32<br />
900<br />
800<br />
700<br />
600<br />
500<br />
400<br />
300<br />
200<br />
100<br />
-<br />
18<br />
YoY<br />
35%<br />
YoY<br />
52%
Consumer Banking - Assets<br />
� Focus on SENP and cross<br />
sell to bank branch<br />
� Continued focus on Auto<br />
Sector<br />
� Mortgages growth in select<br />
territories<br />
� Selective growth in personal<br />
loans<br />
� Continued low delinquencies<br />
24%<br />
25%<br />
48% 45% 44%<br />
Advances break up<br />
1% 1% 4%<br />
10%<br />
3%<br />
8%<br />
3%<br />
8%<br />
4%<br />
27% 29% 22%<br />
30%<br />
37% 39% 39%<br />
50% 50% 49%<br />
FY07 FY08 FY09 FY10 FY11 <strong>FY12</strong><br />
Car Mortgage PL Others<br />
` cr 7,357 10,600 10,876 13,074 17,170 21,608<br />
19<br />
YoY<br />
26%
Commercial Financing<br />
� Focus on Bharat<br />
(semi urban / rural areas)<br />
� Asset focused branches<br />
in rural areas<br />
� Priority sector target met<br />
consistently<br />
� Consistent growth in Agri<br />
� Gold loans launched<br />
selectively<br />
6%<br />
17%<br />
77%<br />
15%<br />
24%<br />
61% 58%<br />
Advances break up<br />
8%<br />
34%<br />
18%<br />
15%<br />
5% 10%<br />
12%<br />
34% 32% 33%<br />
48% 48% 45%<br />
FY07 FY08 FY09 FY10 FY11 <strong>FY12</strong><br />
CE/CV Agri Capital Market Others<br />
` cr 3,900 6,992 7,028 9,168 12,988 17,182<br />
20<br />
YoY<br />
32%
Wholesale Banking<br />
� Largely Working Capital<br />
� Focus on quality end of credit<br />
curve<br />
� Continued focus on<br />
Transaction Banking<br />
o Vendor Financing, CMS<br />
and Operative Accounts<br />
o Focus on FX flows with<br />
increased treasury<br />
coverage<br />
o Custody & Transaction<br />
services<br />
� Continued to deepen franchise<br />
across all customer segments<br />
� Focus on Govt. business<br />
3,041<br />
243<br />
3,836<br />
Funded & Non funded (` cr)<br />
927<br />
4,228<br />
1,819<br />
7,325<br />
3,232<br />
10,916<br />
6,490<br />
14,168<br />
FY07 FY08 FY09 FY10 FY11 <strong>FY12</strong><br />
Funded Non Funded<br />
8,207<br />
21<br />
YoY<br />
30%
Kotak Mahindra Prime<br />
` cr Q3<strong>FY12</strong> Q4FY11 Q4<strong>FY12</strong> FY11 <strong>FY12</strong><br />
Total income 474 365 470 1,373 1,805<br />
Profit before tax 152 130 143 482 570<br />
Profit after tax 104 87 97 318 385<br />
` cr<br />
As on<br />
Dec 31, 2011<br />
As on<br />
Mar 31, 2011<br />
As on<br />
Mar 31, 2012<br />
Total Advances 12,379 11,145 13,386<br />
Car Advances 9,737 8,489 10,577<br />
Net NPA* 22 30 22<br />
Net NPA* (%) 0.2 0.3 0.2<br />
CAR (%) 16.8 15.5 16.3<br />
ROA (%) - annualised 2.9 3.1 2.9<br />
* Excluding acquired stressed assets portfolio<br />
22
Kotak Mahindra Life Insurance<br />
� All past losses recovered now<br />
� Traditional / ULIP a healthy<br />
mix now<br />
� Healthy solvency ratio<br />
� Focus on long term savings<br />
and protection.<br />
413<br />
Gross Premium (` cr)<br />
546 588 1,722 1,773<br />
57<br />
72<br />
120<br />
249<br />
155<br />
184<br />
288<br />
280<br />
97 157 184<br />
685<br />
354<br />
374<br />
436<br />
Q3<strong>FY12</strong> Q4FY11 Q4<strong>FY12</strong> FY11 <strong>FY12</strong><br />
Individual Regular Single Group Renewal<br />
Q3<strong>FY12</strong> Q4FY11 Q4<strong>FY12</strong> FY11 <strong>FY12</strong><br />
Capital (` cr) 562 562 562 562 562<br />
Solvency ratio (%) 3.04 2.67 3.06 2.67 3.06<br />
Individual Regular 97 157 184 685 436<br />
Single 72 249 184 280 374<br />
Group 57 120 155 288 354<br />
Renewal 413 546 588 1,722 1,773<br />
Total 639 1,072 1,111 2,976 2,937<br />
23
Kotak Mahindra Life Insurance cont’d<br />
47<br />
71<br />
PAT (` cr) AUM (` cr)<br />
57<br />
101<br />
203<br />
Q3<strong>FY12</strong> Q4FY11 Q4<strong>FY12</strong> FY11 <strong>FY12</strong><br />
Branches Sum Assured (` ‘000 cr)<br />
204 202 204<br />
Q3<strong>FY12</strong> FY11 <strong>FY12</strong><br />
1,680<br />
147<br />
3,011<br />
3,941<br />
130<br />
6,710<br />
8,592<br />
164<br />
9,724<br />
FY07 FY08 FY09 FY10 FY11 <strong>FY12</strong><br />
Q3<strong>FY12</strong> FY11 <strong>FY12</strong> 24
Kotak Securities<br />
4<br />
Market ADV (` ‘000 cr) ADV (` cr) - KS<br />
7<br />
26 45<br />
16<br />
29<br />
12 20 16 23<br />
19 14<br />
FY07 FY08 FY09 FY10 FY11 <strong>FY12</strong><br />
35<br />
38<br />
77<br />
39<br />
Cash Future Option<br />
96<br />
31<br />
` cr Q3<strong>FY12</strong> Q4FY11 Q4<strong>FY12</strong> FY11 <strong>FY12</strong><br />
Total income 134 169 178 738 610<br />
Profit before tax 37 56 74 272 191<br />
Profit after tax 24 36 50 182 126<br />
Market Share (%) 2.9 2.9 2.9 3.4 2.9<br />
Kotak Securities services more than 7.5 lac secondary market customers thru 1,365 branches & franchises.<br />
3,715<br />
5,301<br />
3,293<br />
3,925<br />
4,648<br />
4,034<br />
FY07 FY08 FY09 FY10 FY11 <strong>FY12</strong><br />
25
Kotak Mahindra Capital Co.<br />
Client Transaction Size (USD mn)<br />
Institutional Placement Programme (IPP) 94<br />
Private equity investment by Wolfensohn Capital and FMO 26<br />
Lead Managers to Tax Free Bond issues ND<br />
Lead Manager to Tax Free Bond issue ND<br />
Sale of block in Kotak Mahindra Bank 280<br />
` cr Q3<strong>FY12</strong> Q4FY11 Q4<strong>FY12</strong> FY11 <strong>FY12</strong><br />
Total income 22 60 22 154 79<br />
Profit before tax 6 40 7 70 9<br />
Profit after tax 4 30 5 52 6<br />
26
Kotak Mahindra Asset Management<br />
Offshore<br />
Funds<br />
18%<br />
Insurance<br />
17%<br />
AUM ` 47,850 cr AUM ` 45,977 cr<br />
Alternate<br />
Asset<br />
10%<br />
PMS<br />
4%<br />
Domestic<br />
MF Equity<br />
8%<br />
Mar 31, 2011<br />
Domestic<br />
MF Debt<br />
43%<br />
Offshore<br />
Funds<br />
17%<br />
Insurance<br />
21%<br />
PMS<br />
3%<br />
Alternate<br />
Asset<br />
11%<br />
Domestic<br />
MF Debt<br />
41%<br />
Domestic<br />
MF Equity<br />
7%<br />
Mar 31, 2012<br />
27
Kotak Mahindra AMC and Trustee Co.<br />
� Close to 9.6 lac folios<br />
� 83 Branches<br />
� Regulatory challenges<br />
Average Assets Under Management ` cr<br />
` cr # Q3<strong>FY12</strong> Q4FY11 Q4<strong>FY12</strong> FY11 <strong>FY12</strong><br />
Total income 27 33 27 119 125<br />
Profit before tax 4 5 4 25 31<br />
Profit after tax 3 3 3 17 22<br />
Average AUM (` bn) 302 323 262 305 308<br />
Average AUM - Equity (` bn) 33 38 32 44 34<br />
# AMC & Trustee Co<br />
12,835<br />
19,740<br />
18,127<br />
34,880<br />
30,472 30,766<br />
FY07 FY08 FY09 FY10 FY11 <strong>FY12</strong><br />
28
Kotak Investment Advisors<br />
� Corpus advised / managed –<br />
` 2,981 cr<br />
Reality Fund<br />
� 49 Investments<br />
� Corpus advised / managed –<br />
` 2,030 cr<br />
Private Equity Fund<br />
� 33 Investments<br />
Domestic realty funds raised during <strong>FY12</strong> - committed corpus ` 509 cr<br />
Propose to launch Infrastructure fund with SMBC and Brookfield<br />
` cr Q3<strong>FY12</strong> Q4FY11 Q4<strong>FY12</strong> FY11 <strong>FY12</strong><br />
Total income 23 26 24 96 97<br />
Profit before tax 11 10 14 49 52<br />
Profit after tax 7 6 10 33 36<br />
29
Geographical Presence<br />
Wide National Footprint ….. ….. With Multiple Points of Presence<br />
Business Mar - 2012<br />
Banking 355<br />
Car Finance 66<br />
Life Insurance 204<br />
Securities 1,365<br />
Mutual Fund 83<br />
Total 2,073<br />
International offices situated in London, New<br />
York, California, Dubai, Abu Dhabi, Bahrain,<br />
Mauritius & Singapore<br />
30
Bank Awards & Recognition<br />
Award for Excellence<br />
Best Companies to work for 2010& 2009 by Great places to work Institute India<br />
Best Private Bank by Finance Asia Country<br />
Best Local Cash Management Bank Asia Money 2011 and 2010<br />
“The ingenious 100” Award by IDG India’s CIO Magazine for Storage Virtualization &<br />
Ingenious Technology Solutions<br />
Ranked # 1 in 17 categories including range of investment products / advisory<br />
services by Euromoney<br />
Ranked #2 in India for companies with “Best Corporate Governance<br />
Practices” – IR Global Rankings 2010<br />
Awarded Hewitt Best Employers in India 2011 & 2009; only Bank to be in top 25<br />
Awarded Bronze in the “Best Local Trade Bank in India” category of Trade and<br />
Forfaiting Review Awards 2011<br />
Kotak Bank Annual Report 2010-11 was awarded Platinum - “Best among<br />
Banking, APAC” and Gold in the “Most Creative Report, APAC” in the LACP<br />
Vision Awards, USA<br />
Awarded Remmy for the “Best Recruitment Ad 2012” in the BFSI category<br />
31
Awards & Recognition<br />
2011:Best Investment Bank in India<br />
(Sixth year in a row)<br />
2011: Best Equity House<br />
(Second year in a row)<br />
2011: Best Domestic Investment Bank<br />
(Fifth year in a row)<br />
Lipper Fund Award 2011 for Kotak Bond Regular – ‘Best Fund over 10 years<br />
Bond Indian Rupee’<br />
Best Debt Fund House of the year 2009 Outlook Money NDTV Profit Awards<br />
2009 & 2010<br />
2011: Best Domestic Equity House<br />
(Fourth year in a row)<br />
2010: Best Investment Bank in India<br />
Best Broker in India 2010<br />
Best Local Brokerage 2010<br />
Award for Excellence<br />
2011: Best Bank for Equity Finance in India<br />
(Real Estate)<br />
(Second year in a row)<br />
32
Disclaimer<br />
This presentation is for information purposes only and does not constitute an offer, solicitation or advertisement with respect to<br />
the purchase or sale of any security of Kotak Mahindra Bank Limited (the “Bank”) and no part of it shall form the basis of or be<br />
relied upon in connection with any contract or commitment whatsoever. No offering of securities of the Bank will be made except<br />
by means of a statutory offering document containing detailed information about the Bank.<br />
This presentation is not a complete description of the Bank. Certain statements in the presentation contain words or phrases that<br />
are forward looking statements. All forward-looking statements are subject to risks, uncertainties and assumptions that could<br />
cause actual results to differ materially from those contemplated by the relevant forward looking statement. Any opinion, estimate<br />
or projection herein constitutes a judgment as of the date of this presentation, and there can be no assurance that future results<br />
or events will be consistent with any such opinion, estimate or projection. The information in this presentation is subject to<br />
change without notice, its accuracy is not guaranteed, it may be incomplete or condensed and it may not contain all material<br />
information concerning the Bank. We do not have any obligation to, and do not intend to, update or otherwise revise any<br />
statements reflecting circumstances arising after the date of this presentation or to reflect the occurrence of underlying events,<br />
even if the underlying assumptions do not come to fruition.<br />
All information contained in this presentation has been prepared solely by the Bank. No information contained herein has been<br />
independently verified by anyone else. No representation or warranty (express or implied) of any nature is made nor is any<br />
responsibility or liability of any kind accepted with respect to the truthfulness, completeness or accuracy of any information,<br />
projection, representation or warranty (expressed or implied) or omissions in this presentation. Neither the Bank nor anyone else<br />
accepts any liability whatsoever for any loss, howsoever, arising from any use or reliance on this presentation or its contents or<br />
otherwise arising in connection therewith. This presentation may not be used, reproduced, copied, distributed, shared, or<br />
disseminated in any other manner.<br />
The distribution of this document in certain jurisdictions may be restricted by law and persons into whose possession this<br />
presentation comes should inform themselves about, and observe, any such restrictions.<br />
Figures for the previous period/ year have been regrouped wherever necessary to conform to current period’s / year’s<br />
presentation. Totals in some columns/ rows may not agree due to rounding off.<br />
Contact<br />
Jaimin Bhatt / R Sundarraman<br />
Kotak Mahindra Bank Limited<br />
Tel: +91 22 6672 6000, Fax: +91 22 6672 6430<br />
E-mail: investor.relations@kotak.com<br />
33