8 MB - University of Toronto Magazine
8 MB - University of Toronto Magazine
8 MB - University of Toronto Magazine
- No tags were found...

You also want an ePaper? Increase the reach of your titles
YUMPU automatically turns print PDFs into web optimized ePapers that Google loves.
Leading Edge<br />
The problem is that different mechanisms<br />
in the brain might be working together to<br />
produce similar symptoms in patients.<br />
In an effort to tease apart these different<br />
mechanisms and to find ways to predict how<br />
different types <strong>of</strong> depression will respond to<br />
treatments, the researchers are recruiting 300<br />
patients and 100 healthy subjects at six academic<br />
centres across Canada. The study will take three<br />
years. The researchers will look to see which<br />
gene variants the study participants have and<br />
which proteins those genes produce, with a<br />
particular focus on those known to play a role<br />
in depression or in how the body processes antidepressants.<br />
The researchers will also assess<br />
the patients for anxiety and how clearly they are<br />
able to think, take their family medical history<br />
and note any traumatic life events. Finally, they<br />
will use EEG to map brainwave activity and<br />
functional magnetic resonance imaging to track<br />
bloodflow to see what’s going on in the depressed<br />
– or recovering – person’s brain.<br />
These data are being collected at three points<br />
in the study: before starting on medication, two<br />
weeks after starting, and at the eight-week mark.<br />
All patients will take the same drug, escitalopram.<br />
Kennedy’s aim is to find out what distinguishes<br />
the people who do well quickly, the people who<br />
do well eventually and the people who never do<br />
well on a given antidepressant. It may be that<br />
people with a certain combination <strong>of</strong> genes plus<br />
certain brain imaging and blood results can be<br />
identified in advance as good responders. “We<br />
believe if we combine enough <strong>of</strong> these markers,<br />
we will be able to predict the right treatment for<br />
individual patients,” he says.<br />
Kennedy expects that, once it is easier to predict<br />
who benefits from what, drug companies<br />
will begin to target their medications more specifically.<br />
Rather than claiming only 40 per cent<br />
<strong>of</strong> all depressed patients improved, for instance,<br />
they might be able to claim 80 or 90 per cent in<br />
particular subpopulations – groups that will be<br />
objectively identified through biomarkers.<br />
In the end, says Kennedy, biomarkers will not<br />
only help confirm which people do have depression,<br />
what type <strong>of</strong> depression they have and<br />
what medication might work best, they may also<br />
point the way to the causes – leading to novel<br />
treatments. – Alison Motluk<br />
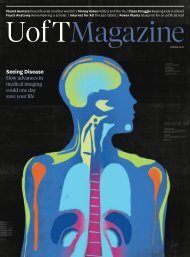
Property Value<br />
<strong>Toronto</strong>’s land-use maps are<br />
important planning tools but they lack<br />
detail and are <strong>of</strong>ten out-<strong>of</strong>-date.<br />
Not for much longer<br />
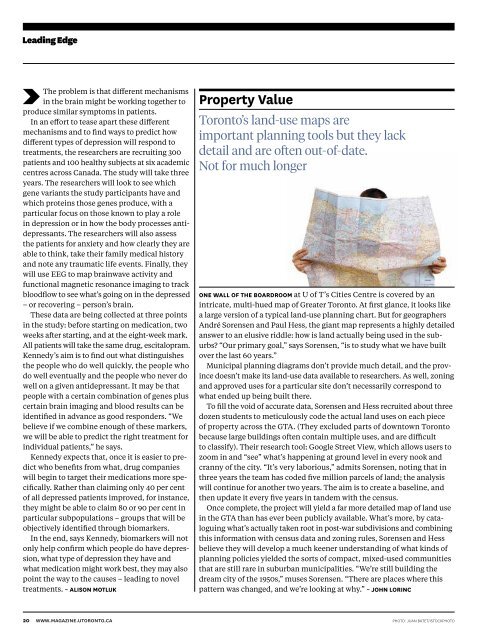
One wall <strong>of</strong> the boardroom at U <strong>of</strong> T’s Cities Centre is covered by an<br />
intricate, multi-hued map <strong>of</strong> Greater <strong>Toronto</strong>. At first glance, it looks like<br />
a large version <strong>of</strong> a typical land-use planning chart. But for geographers<br />
André Sorensen and Paul Hess, the giant map represents a highly detailed<br />
answer to an elusive riddle: how is land actually being used in the suburbs<br />
“Our primary goal,” says Sorensen, “is to study what we have built<br />
over the last 60 years.”<br />
Municipal planning diagrams don’t provide much detail, and the province<br />
doesn’t make its land-use data available to researchers. As well, zoning<br />
and approved uses for a particular site don’t necessarily correspond to<br />
what ended up being built there.<br />
To fill the void <strong>of</strong> accurate data, Sorensen and Hess recruited about three<br />
dozen students to meticulously code the actual land uses on each piece<br />
<strong>of</strong> property across the GTA. (They excluded parts <strong>of</strong> downtown <strong>Toronto</strong><br />
because large buildings <strong>of</strong>ten contain multiple uses, and are difficult<br />
to classify). Their research tool: Google Street View, which allows users to<br />
zoom in and “see” what’s happening at ground level in every nook and<br />
cranny <strong>of</strong> the city. “It’s very laborious,” admits Sorensen, noting that in<br />
three years the team has coded five million parcels <strong>of</strong> land; the analysis<br />
will continue for another two years. The aim is to create a baseline, and<br />
then update it every five years in tandem with the census.<br />
Once complete, the project will yield a far more detailed map <strong>of</strong> land use<br />
in the GTA than has ever been publicly available. What’s more, by cataloguing<br />
what’s actually taken root in post-war subdivisions and combining<br />
this information with census data and zoning rules, Sorensen and Hess<br />
believe they will develop a much keener understanding <strong>of</strong> what kinds <strong>of</strong><br />
planning policies yielded the sorts <strong>of</strong> compact, mixed-used communities<br />
that are still rare in suburban municipalities. “We’re still building the<br />
dream city <strong>of</strong> the 1950s,” muses Sorensen. “There are places where this<br />
pattern was changed, and we’re looking at why.” – John Lorinc<br />
20 WWW.MAGAZINE.UTORONTO.CA<br />
photo: Juan Batet/iSTOCKPHOTO