CALCIUM AND MAGNESIUM: THE SECONDARY COUSINS 1 ...
CALCIUM AND MAGNESIUM: THE SECONDARY COUSINS 1 ...
CALCIUM AND MAGNESIUM: THE SECONDARY COUSINS 1 ...

You also want an ePaper? Increase the reach of your titles
YUMPU automatically turns print PDFs into web optimized ePapers that Google loves.
<strong>CALCIUM</strong> <strong>AND</strong> <strong>MAGNESIUM</strong>: <strong>THE</strong> <strong>SECONDARY</strong> <strong>COUSINS</strong><br />
George Rehm, University of Minnesota<br />
1. Introduction<br />
In the discipline of soil fertility, sulfur (S), calcium (Ca), and magnesium (Mg) are put<br />
into the category of secondary nutrients, rather than primary or macronutrients.<br />
Frequently, Ca and Mg are grouped with potassium (K) and referred to as the basic<br />
cations. Sulfur and K are discussed in separate lessons. This lesson will focus on the<br />
importance of Ca and Mg in Minnesota soils and their role in plant nutrition.<br />
At this point, it’s important to introduce some chemistry that pertains to reactions of Ca<br />
and Mg in soils. Calcium and Mg exist in soils as cations. A cation is an ion with a<br />
positive electrical charge. Both Ca and Mg have two positive electrical charges and are<br />
written as Ca ++ and Mg ++ respectively. The clay-size particles and soil organic matter<br />
have negative electrical charges on their surface (refer to the Soil Organic Matter<br />
Chapter). There is a fundamental principle of chemistry which states that similar<br />
electrical charges repel each other while opposite charges are attracted to each other. So,<br />
Ca ++ and Mg ++ are attracted to, and are in close association with, negative electrical<br />
charges that exist on clay-size and organic matter particles.<br />
The association of cations with both soil and organic matter particles is drawn in Figure<br />
1. This figure intends to show that there is no actual “locking” of cations to soil particles.<br />
There is an “association” between a cation with 2 positive charges and 2<br />
negative charges on the soil particle.<br />
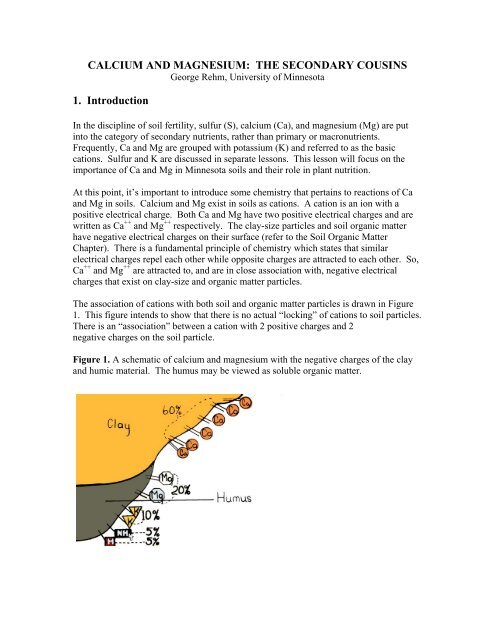
Figure 1. A schematic of calcium and magnesium with the negative charges of the clay<br />
and humic material. The humus may be viewed as soluble organic matter.
In Figure 1, 60% of the exchange sites are occupied by Ca ++ , while 20% are occupied by<br />
Mg ++ . The remainder are occupied by K + (10%), NH 4 + (5%) and H + (5%). The K + , NH 4<br />
+<br />
and H + are all cations. They have one instead of two positive charges. The percentages<br />
in Figure 1 are for illustration purposes only. These percentages can vary over a wide<br />
range as will be discussed later.<br />
2. IMPORTANCE IN PLANT GROWTH<br />
2a. Calcium<br />
2b. Magnesium<br />
2a. Calcium<br />
Calcium is part of every plant cell. Much of the Ca in plants is part of the cell walls in a<br />
compound called calcium pectate. Without adequate Ca, cell walls would collapse and<br />
plants would not remain upright. Calcium is not mobile in plants. It does not easily<br />
move from old leaves to young leaves. Deficiency symptoms for Ca are rare in<br />
agriculture and a deficiency of this nutrient is not a concern in Minnesota.<br />
Calcium also has a positive effect on soil properties. This nutrient improves soil structure<br />
thereby increasing water penetration, and providing a more favorable soil environment<br />
for growth of plant roots and soil microorganisms.<br />
Calcium is abundant in all Minnesota soils. The concentration<br />
in a form usable by plants may be as low as 300 to 500 ppm in<br />
acid soils to more than 7,000 ppm in highly calcareous soils.<br />
Calcium is not needed in a fertilizer program. Even at the low<br />
levels, there is adequate Ca ++ for crop growth. When<br />
concentrations of Ca are high, free Ca ++ reacts with phosphate<br />
to form insoluble calcium phosphate.<br />
2b. Magnesium<br />
Magnesium is a component of the chlorophyll molecule. Therefore, it is essential for<br />
photosynthesis. As might be expected, plants that are deficient in Mg have an overall<br />
light green color. In corn, the veins are mainly white when concentrations are<br />
inadequate.<br />
In Minnesota, deficiency symptoms in corn and vegetable crops<br />
have been observed where soil pH values are very acid (less than<br />
5.0). . Guidelines for the use of Mg in a fertilizer program are listed<br />
in Table 1.
Table 1. Guidelines for use of magnesium for production of corn.<br />
Corn<br />
Vegetables<br />
Relative Mg to Mg to<br />
Level Exchangeable Mg Apply Exchangeable Mg Apply<br />
ppm lb. /acre ppm lb. /acre<br />
Low 0 to 50 10 - 20 (b)* 0 to 50 20 (b)<br />
50 - 100 (br) 100 (br)<br />
Medium 51 to 150 trial 51 to 100 10 (b)<br />
0 50 (br)<br />
High 151+ 0 100+ 0<br />
0 0<br />
Source: (3)<br />
*b = band fertilizer; br = broadcast application<br />
The double salt of potassium and magnesium sulfate (0-0-22-22-11) and magnesium sulfate<br />
MgSO 4 (Epsom salts) are the two choices for application of Mg in a fertilizer program when<br />
the results of a soil test indicate a need. Dolomitic lime is also a good source of Mg. The<br />
concentration ranges from 8% to approximately 11% Mg. For fields that have been limed with<br />
dolomitic limestone, there should be no need to supply Mg in a fertilizer program.<br />
3. <strong>CALCIUM</strong> <strong>AND</strong> MAGNEISUM BALANCE<br />
3a. Ratio is not Constant in Soils<br />
The term, “balance”, is frequently over used in the discipline of soil fertility. There are some<br />
who believe that there is an actual “balance” between Ca and Mg in soils that has an impact on<br />
crop yield. This “balance” is frequently referred to as “cation ratios”. Following this thinking,<br />
there is a belief that if a ratio of Ca to Mg is not in an ideal range, plant growth or crop yields<br />
will be negatively affected.<br />
Looking to Figure 1, Ca and Mg are attracted to the negative electrical charges in the form of<br />
Ca ++ and Mg ++ ions. The negative electrical charges are referred to as exchange sites.<br />
Those who believe in Ca – Mg balance, believe that 60% to 80% of the negative exchange sites<br />
should be occupied by Ca ++ and 10% to 20% of the exchange sites should be occupied by<br />
Mg ++ . This Ca ++ and Mg ++ is defined as exchangeable. Exchangeable Ca and Mg can be<br />
easily measured with routine laboratory procedures and it is easy to calculate ratios of<br />
exchangeable Ca ++ to exchangeable Mg ++ . Supposedly if the ratio of Ca ++ and Mg ++ is not<br />
acceptable, application of materials containing Ca and Mg can be used to correct the ratio and<br />
improve crop production.
3a. Ratio Is Not Constant in Soils<br />
In soils in the northern Corn Belt, the ratio of Ca to Mg varies over a wide range (Table 2).<br />
This ratio also changes with cropping because uptake (lb./acre) is different for these secondary<br />
nutrients (Table 3). The data in Tables 2 and 3 come from Wisconsin. In Minnesota, the level<br />
of exchangeable Mg ranges from 50 ppm or less to more than 800 ppm.<br />
Table 2. Ratios of exchangeable Ca to exchangeable Mg in some Wisconsin soils.<br />
Soil Series Ca/Mg Ratio Soil Series Ca/Mg Ratio<br />
Antigo 4.0:1 Marley 4.0:1<br />
Almena 3.2:1 Norden 8.1:1<br />
Boone 1.0:1 Onaway 6.7:1<br />
Dubuque 4.0:1 Ontonagon 4.0:1<br />
Gale 4.3:1 Pella 3.9:1<br />
Freer 3.7:1 Plainfield 6.1:1<br />
Kewaunee 3.1:1 Plano 3.3:1<br />
Marathon 7.7:1 Poygam 4.3:1<br />
Source: (4)<br />
Table 3. Change in the ratio of exchangeable Ca to exchangeable Mg with cropping in<br />
Wisconsin.<br />
Ca:Mg Ratio<br />
Soil Series Virgin Cropped<br />
Plainfield sand 7.9:1 8.7:1<br />
Boone loamy sand 1.5:1 1:1<br />
Gale silt loam 2.6:1 4.3:1<br />
Ontonagon silt loam 3.9:1 4.2:1<br />
Source: (4)<br />
4. CATION RATIOS <strong>AND</strong> CROP YIELDS<br />
The impact of cation ratios on crop production has been the focus of research for several years.<br />
The impact of this ratio on alfalfa grown on contrasting soils in Wisconsin is shown in Table 4.<br />
The ratio was changed by adding various amounts of either Ca or Mg. The results were rather<br />
conclusive. The Ca:Mg ratio which varied over a wide range for each soil had no negative<br />
effect on alfalfa yield.
Table 4. Effect of various Ca:Mg ratios on yield of alfalfa grown on two soils in Wisconsin.<br />
Yield<br />
Ca:Mg Ratio Theresa silt loam Plainfield loamy sand_<br />
- - - - - - - - - - - ton dry matter/acre- - - - - - - - - - - - - -<br />
2.28 3.31 -<br />
3.40 3.31 -<br />
4.06 3.40 -<br />
4.76 3.40 -<br />
5.25 3.50 -<br />
8.44 3.22 -<br />
2.64 - 4.14<br />
2.92 - 4.28<br />
3.48 - 4.35<br />
4.81 - 4.12<br />
7.58 - 4.30<br />
8.13 4.35<br />
Source: (5)<br />
Researchers in Ohio, working with corn and soybeans, also concluded that the Ca:Mg ratio had<br />
no effect on crop yield (Table 5). They grew corn or soybeans at several research sites. The<br />
Ca:Mg ratio was measured on soil samples collected at each site before planting. The ratios<br />
from the 5 fields having the highest yields and the 5 fields having the lowest yields are reported<br />
in Table 5. The information collected from this study leads to the obvious conclusion that the<br />
Ca:Mg ratio was not related to both corn and soybean yields.<br />
Consider corn yields measured in 1975. The Ca:Mg ratio in 5 fields having the highest yields<br />
ranged from 5.7 to 26.8. Likewise, the ratio varied from 5.8 to 21.5 in the 5 fields that had the<br />
lowest yields.<br />
Table 5. Ranges in the Ca:Mg in Ohio soils and relative yield of corn and soybeans.<br />
Relative Yield Corn (75) Corn (76) Soybeans (77) Soybeans (78)<br />
- - - - - - - - - - - - - - - - -Ca:Mg Ratio- - - - - - - - - - -<br />
Highest Five 5.7 to 26.8 5.7 to 14.3 5.7 to 14.0 5.7 to 26.8<br />
Lowest Five 5.8 to 21.5 5.0 to 16.1 2.3 to 16.1 6.8 to 21.5 ___<br />
Source: (1)<br />
The relationship of the Ca:Mg ratio and crop production is a major theme in the debate<br />
between those marketing either dolomitic or calcitic limestone. Magnesium in dolomitic<br />
limestone is thought to have a negative impact on production because it changes the Ca:Mg<br />
ratio in soils.<br />
Recently, this claim was tested in field trials in Olmsted County. The site selected had an<br />
initial pH of 5.6. The treatments used are listed in Table 6. The lime (either calcitic or<br />
dolomitic) was applied at a rate of supply 3500 lb. Effective Neutralizing Power per acre.<br />
Magnesium was applied as magnesium sulfate (Epsom salts). Therefore, the amount of applied
Mg increased progressively in treatments 1 through 4. The lime as well as the fertilizer needed<br />
for optimum yield was broadcast and incorporated before planting.<br />
Table 6. Alfalfa (seeding year) and soybean yield as affected by application of either calcitic<br />
or dolomitic lime with and without additional magnesium.<br />
Mg<br />
Crop<br />
Treatment # Lime Source Applied Alfalfa (1 st cut) Soybeans<br />
lb./acre ton D.M./acre bu./acre<br />
1 Calcitic 0 1.42 46.0<br />
2 Calcitic 300 1.29 46.3<br />
3 Dolomitic 0 1.51 49.3<br />
4 Dolomitic 300 1.47 46.3 __<br />
Source:<br />
Without the use of lime the yield was 1.24 tons dry matter per acre. Soybean yield without<br />
liming was 42.4 bu. per acre. There was a positive response to liming and this would be<br />
expected given the initial pH of 5.6.<br />
Increasing the amount of Mg in the soil system had no negative impact on crop production.<br />
These yields lead to the conclusion that even high amounts of Mg in the soil are not<br />
detrimental. Therefore, the choice between calcitic and dolomitic lime should be based on the<br />
cost of the product rather than the perceived impact of Mg on production.<br />
5. SUMMARY<br />
Although differing in relative amounts found in Minnesota, the chemistry of Ca and Mg in<br />
soils and their impact on crop growth is similar. Calcium is well supplied naturally in soils and<br />
none is needed in a fertilizer program. Magnesium can be deficient when sandy soils are very<br />
acid (pH less than 5.0). As soil pH increases, the supply of available calcium and magnesium<br />
increases.<br />
Contrary to the thinking of some, the ratio of exchangeable calcium to exchangeable<br />
magnesium has no impact on crop production. Likewise, high levels of magnesium do not<br />
decrease yield. Therefore, agronomic benefits of calcitic and dolomitic limestone are equal if<br />
equivalent rates of Effective Neutralizing Power are applied. Purchase should be dictated by<br />
cost.
REFERENCES<br />
1. McLean, E.O., R.C. Hartwig, D.J. Eckert and G.B. Triplett. 1983. Basic cation<br />
saturation ratios as a basis for fertilizing and liming agronomic crops: II.<br />
Field Studies. Agron. J. 75:635-639<br />
2. Rehm, G. 1994. Soil cation ratios for crop production. North Central Regional<br />
Extension Publication 533. Available at<br />
www.extension.umn.edu/distribution/cropsystems/DC6437.html (verified August 13,<br />
2008).<br />
3. Rehm, G., C. Rosen and M. Schmitt. 1994. Magnesium for crop production in<br />
Minnesota. University of Minnesota Extension publication FO-00725-GO. Available<br />
at www.extension.umn.edu/distribution/cropsystems/DC0725.html (verified August<br />
13, 2008).<br />
4. Schulte, E.E. and K.A. Kelling. 1985. Soil calcium to magnesium ratios- should you<br />
be concerned University of Wisconsin Extension Bulletin G2986.<br />
5. Simson, C.R., R.B. Corey and M.E. Sumner. 1979. Effect of varying Ca:Mg ratios on<br />
yield and composition of corn and alfalfa. Commun. Soil Sci. and Plant Anal. 10:153-<br />
162.