Spreading with evaporation and condensation in one-component ...
Spreading with evaporation and condensation in one-component ...
Spreading with evaporation and condensation in one-component ...

Create successful ePaper yourself
Turn your PDF publications into a flip-book with our unique Google optimized e-Paper software.
PHYSICAL REVIEW E 82, 021603 2010<br />
<strong>Spread<strong>in</strong>g</strong> <strong>with</strong> <strong>evaporation</strong> <strong>and</strong> <strong>condensation</strong> <strong>in</strong> <strong>one</strong>-comp<strong>one</strong>nt fluids<br />
Ryohei Teshigawara <strong>and</strong> Akira Onuki<br />
Department of Physics, Kyoto University, Kyoto 606-8502, Japan<br />
Received 3 May 2010; revised manuscript received 23 June 2010; published 11 August 2010<br />
We <strong>in</strong>vestigate the dynamics of spread<strong>in</strong>g of a small liquid droplet <strong>in</strong> gas <strong>in</strong> a <strong>one</strong>-comp<strong>one</strong>nt simple fluid,<br />
where the temperature is <strong>in</strong>homogeneous around 0.9T c <strong>and</strong> latent heat is released or generated at the <strong>in</strong>terface<br />
upon <strong>evaporation</strong> or <strong>condensation</strong> <strong>with</strong> T c be<strong>in</strong>g the critical temperature. In the scheme of the dynamic van<br />
der Waals theory, the hydrodynamic equations conta<strong>in</strong><strong>in</strong>g the gradient stress are solved <strong>in</strong> the axisymmetric<br />
geometry. We assume that the substrate has a f<strong>in</strong>ite thickness <strong>and</strong> its temperature obeys the thermal diffusion<br />
equation. A precursor film then spreads ahead of the bulk droplet itself <strong>in</strong> the complete wett<strong>in</strong>g condition.<br />
Cool<strong>in</strong>g the substrate enhances <strong>condensation</strong> of gas onto the advanc<strong>in</strong>g film, which mostly takes place near the<br />
film edge <strong>and</strong> can be the dom<strong>in</strong>ant mechanism of the film growth <strong>in</strong> a late stage. The generated latent heat<br />
produces a temperature peak or a hot spot <strong>in</strong> the gas region near the film edge. On the other h<strong>and</strong>, heat<strong>in</strong>g the<br />
substrate <strong>in</strong>duces <strong>evaporation</strong> all over the <strong>in</strong>terface. For weak heat<strong>in</strong>g, a steady-state circular th<strong>in</strong> film can be<br />
formed on the substrate. For stronger heat<strong>in</strong>g, <strong>evaporation</strong> dom<strong>in</strong>ates over <strong>condensation</strong>, lead<strong>in</strong>g to eventual<br />
disappearance of the liquid region.<br />
DOI: 10.1103/PhysRevE.82.021603<br />
PACS numbers: 68.03.Fg, 68.08.Bc, 44.35.c, 64.70.F<br />
I. INTRODUCTION<br />
Extensive efforts have been made on the static <strong>and</strong> dynamic<br />
properties of wett<strong>in</strong>g transitions for various fluids <strong>and</strong><br />
substrates both theoretically <strong>and</strong> experimentally 1. In particular,<br />
spread<strong>in</strong>g of a liquid has been studied by many<br />
groups 1–8 s<strong>in</strong>ce it is of great importance <strong>in</strong> a number of<br />
practical situations such as lubrication, adhesion, <strong>and</strong> pa<strong>in</strong>t<strong>in</strong>g.<br />
Hydrodynamic theories were developed for spread<strong>in</strong>g of<br />
an <strong>in</strong>volatile liquid droplet <strong>in</strong> gas <strong>in</strong> an early stage of the<br />
theoretical research 1,4,7–9. A unique feature revealed by<br />
experiments 2,10–13 is that a th<strong>in</strong> precursor film is formed<br />
ahead of the liquid droplet itself <strong>in</strong> the complete wett<strong>in</strong>g<br />
condition. Hardy first reported its formation ascrib<strong>in</strong>g its orig<strong>in</strong><br />
to <strong>condensation</strong> at the film edge 2, but it has been<br />
observed also for <strong>in</strong>volatile fluids 10–13. To underst<strong>and</strong><br />
nanometer-scale spread<strong>in</strong>g processes, a number of microscopic<br />
simulations have been performed ma<strong>in</strong>ly for fluids<br />
composed of cha<strong>in</strong>like molecules 14–21.<br />
However, underst<strong>and</strong><strong>in</strong>g of the wett<strong>in</strong>g dynamics of volatile<br />
liquids is still <strong>in</strong>adequate. We mention some examples<br />
where <strong>evaporation</strong> <strong>and</strong> <strong>condensation</strong> come <strong>in</strong>to play. In their<br />
molecular-dynamics simulation 19, Koplik et al. observed<br />
<strong>evaporation</strong> of a droplet <strong>and</strong> a decrease <strong>in</strong> the contact angle<br />
upon heat<strong>in</strong>g a substrate <strong>in</strong> the partial wett<strong>in</strong>g condition. In<br />
their experiment 22, Guéna et al. observed that a weakly<br />
volatile droplet spread as an <strong>in</strong>volatile droplet <strong>in</strong> an <strong>in</strong>itial<br />
stage but disappeared after a long time due to <strong>evaporation</strong> <strong>in</strong><br />
the complete wett<strong>in</strong>g condition. In a near-critical <strong>one</strong>comp<strong>one</strong>nt<br />
fluid 23, Hegseth et al. observed that a bubble<br />
was attracted to a heated wall even when it was completely<br />
wetted by liquid <strong>in</strong> equilibrium at zero heat flux, where the<br />
apparent contact angle of a bubble <strong>in</strong>creased <strong>with</strong> the heat<br />
flux.<br />
In addition to spread<strong>in</strong>g on a heated or cooled substrate,<br />
there are a variety of situations such as droplet <strong>evaporation</strong><br />
24–28, boil<strong>in</strong>g on a heated substrate 29–31, <strong>and</strong> motion<br />
of a bubble suspended <strong>in</strong> liquid 32,33, where latent heat<br />
generated or released at the <strong>in</strong>terface drastically <strong>in</strong>fluences<br />
the hydrodynamic processes. In particular, a large temperature<br />
gradient <strong>and</strong> a large heat flux should be produced around<br />
the edge of a liquid film or the contact l<strong>in</strong>e of a droplet or<br />
bubble on a substrate 28,30. The temperature <strong>and</strong> velocity<br />
profiles should be highly s<strong>in</strong>gular <strong>in</strong> these narrow regions.<br />
Here, an experiment by Höhmann <strong>and</strong> Stephan 31 is noteworthy.<br />
They observed a sharp drop <strong>in</strong> the substrate temperature<br />
near the contact l<strong>in</strong>e of a grow<strong>in</strong>g bubble <strong>in</strong> boil<strong>in</strong>g.<br />
Furthermore, we should stress relevance of the Marangoni<br />
flow <strong>in</strong> multicomp<strong>one</strong>nt fluids <strong>in</strong> two-phase hydrodynamics<br />
25,29,34, where temperature <strong>and</strong> concentration variations<br />
cause a surface tension gradient <strong>and</strong> a balance of the tangential<br />
stress <strong>in</strong>duces a flow on the droplet scale.<br />
In hydrodynamic theories, the gas-liquid transition has<br />
been <strong>in</strong>cluded <strong>with</strong> the aid of a phenomenological <strong>in</strong>put of<br />
the <strong>evaporation</strong> rate on the <strong>in</strong>terface J. Some authors 24–26<br />
assumed the form Jr,t=J 0 /r e t 2 −r 2 1/2 for a th<strong>in</strong> circular<br />
droplet as a function of the distance r from the droplet center,<br />
where r e t is the film radius <strong>and</strong> J 0 is a constant 35. In the<br />
framework of the lubrication theory, Anderson <strong>and</strong> Davis<br />
36 exam<strong>in</strong>ed spread<strong>in</strong>g of a th<strong>in</strong> volatile droplet on a<br />
heated substrate by assum<strong>in</strong>g the form J=T I −T cx /K ,<br />
where T I is the <strong>in</strong>terface temperature, T cx is the saturation<br />
coexistence temperature, <strong>and</strong> K is a k<strong>in</strong>etic coefficient. In<br />
these papers, the dynamical processes <strong>in</strong> the gas have been<br />
neglected.<br />
Various mesoscopic coarse-gra<strong>in</strong>ed simulation methods<br />
have also been used to <strong>in</strong>vestigate two-fluid hydrodynamics,<br />
where the <strong>in</strong>terface has a f<strong>in</strong>ite thickness. We mention phase<br />
field models of fluids mostly treat<strong>in</strong>g <strong>in</strong>compressible b<strong>in</strong>ary<br />
mixtures 37–52, where the gradient stress is <strong>in</strong>cluded <strong>in</strong><br />
the hydrodynamic equations see a review <strong>in</strong> Ref. 39. In<br />
particular, some authors numerically studied liquid-liquid<br />
phase separation <strong>in</strong> heat flow 38,43,47,51, but these authors<br />
treated symmetric b<strong>in</strong>ary mixtures <strong>with</strong>out latent heat. Recently,<br />
<strong>one</strong> of the present authors developed a phase field<br />
model for compressible fluids <strong>with</strong> <strong>in</strong>homogeneous temperature,<br />
which is called the dynamic van der Waals model<br />
1539-3755/2010/822/02160314<br />
021603-1<br />
©2010 The American Physical Society
RYOHEI TESHIGAWARA AND AKIRA ONUKI<br />
48,49. In its framework, we may describe gas-liquid transitions<br />
<strong>and</strong> convective latent heat transport <strong>with</strong>out assum<strong>in</strong>g<br />
any <strong>evaporation</strong> formula. In <strong>one</strong> of its applications 28, it<br />
was used to <strong>in</strong>vestigate <strong>evaporation</strong> of an axisymmetric<br />
droplet on a heated substrate <strong>in</strong> a <strong>one</strong>-comp<strong>one</strong>nt system.<br />
Our f<strong>in</strong>d<strong>in</strong>g there is that <strong>evaporation</strong> occurs mostly near the<br />
contact l<strong>in</strong>e. We also mention the lattice Boltzmann method<br />
to simulate the cont<strong>in</strong>uum equations, where the molecular<br />
velocity takes discrete values 44–47,52. However, this<br />
method has not yet been fully developed to describe <strong>evaporation</strong><br />
<strong>and</strong> <strong>condensation</strong>.<br />
In this paper, we will simulate spread<strong>in</strong>g us<strong>in</strong>g the dynamic<br />
van der Waals model 48,49. We will treat a <strong>one</strong>comp<strong>one</strong>nt<br />
fluid <strong>in</strong> a temperature range around 0.9T c , where<br />
the gas <strong>and</strong> liquid densities are not much separated. Namely,<br />
we will approach the problem relatively close to the critical<br />
po<strong>in</strong>t. Then the mean free path <strong>in</strong> the gas is not long, so that<br />
the temperature may be treated to be cont<strong>in</strong>uous across an<br />
<strong>in</strong>terface <strong>in</strong> n<strong>one</strong>quilibrium. When the gas is dilute, the phase<br />
field approach becomes more difficult to treat gas flow produced<br />
by <strong>evaporation</strong> <strong>and</strong> <strong>condensation</strong>. It is known that the<br />
temperature near an <strong>in</strong>terface changes sharply <strong>in</strong> the gas over<br />
the mean free path dur<strong>in</strong>g <strong>evaporation</strong> 53.<br />
The organization of this paper is as follows. In Sec. II, we<br />
will present the dynamic equations <strong>with</strong> appropriate boundary<br />
conditions. In Sec. III, the simulation method will be<br />
expla<strong>in</strong>ed. In Sec. IV, numerical results of spread<strong>in</strong>g will be<br />
given for cool<strong>in</strong>g <strong>and</strong> heat<strong>in</strong>g the substrate.<br />
II. DYNAMIC VAN DER WAALS THEORY<br />
When we discuss phase transitions <strong>with</strong> <strong>in</strong>homogeneous<br />
temperature, the free-energy functional is not well def<strong>in</strong>ed. In<br />
such cases, we should start <strong>with</strong> an entropy functional <strong>in</strong>clud<strong>in</strong>g<br />
a gradient contribution, which is determ<strong>in</strong>ed by the<br />
number density n=nr,t <strong>and</strong> the <strong>in</strong>ternal energy density e<br />
=er,t <strong>in</strong> <strong>one</strong>-comp<strong>one</strong>nt fluids. Here, we present m<strong>in</strong>imal<br />
forms of the entropy functional <strong>and</strong> the dynamic equations<br />
needed for our simulation.<br />
A. Entropy formalism<br />
We <strong>in</strong>troduce a local entropy density Ŝ=Ŝr,t consist<strong>in</strong>g<br />
of regular <strong>and</strong> gradient terms as 48,49<br />
Ŝ = nsn,e − 1 2 Cn2 .<br />
2.1<br />
Here s=sr,t is the entropy per particle depend<strong>in</strong>g on n <strong>and</strong><br />
e. The coefficient C of the gradient term can depend on n<br />
49, but it will be assumed to be a positive constant <strong>in</strong>dependent<br />
of n. The gradient entropy is negative <strong>and</strong> is particularly<br />
important <strong>in</strong> the <strong>in</strong>terface region. The entropy functional<br />
is the space <strong>in</strong>tegral S b drŜ <strong>in</strong> the bulk region. As a<br />
function of n <strong>and</strong> e, the temperature T is determ<strong>in</strong>ed from<br />
= 1 S b<br />
= n s . 2.2<br />
T e<br />
n en<br />
The generalized chemical potential ˆ <strong>in</strong>clud<strong>in</strong>g the gradient<br />
part is of the form<br />
PHYSICAL REVIEW E 82, 021603 2010<br />
ˆ =−T S b<br />
= − TC<br />
n<br />
e<br />
2 n, 2.3<br />
where =−Tns/n e is the usual chemical potential per<br />
particle. In equilibrium T <strong>and</strong> ˆ are homogeneous constants.<br />
In the van der Waals theory 54, fluids are characterized<br />
by the molecular volume v 0 <strong>and</strong> the pair-<strong>in</strong>teraction energy .<br />
As a function of n <strong>and</strong> e, s is written as<br />
s = k B lne/n + v 0 n 3/2 1/v 0 n −1 + s 0 , 2.4<br />
where s 0 /k B =lnv 0 m/3 2 3/2 +5/2 <strong>with</strong> m be<strong>in</strong>g the molecular<br />
mass. We def<strong>in</strong>e T as <strong>in</strong> Eq. 2.2 to obta<strong>in</strong> the wellknown<br />
van der Waals expressions for the <strong>in</strong>ternal energy e<br />
<strong>and</strong> the pressure p=n+Tns−e,<br />
e =3nk B T/2−v 0 n 2 ,<br />
p = nk B T/1−v 0 n − v 0 n 2 .<br />
The critical density, temperature, <strong>and</strong> pressure read<br />
2.5<br />
2.6<br />
n c =1/3v 0 , T c =8/27k B , p c = /27v 0 , 2.7<br />
respectively. Macroscopic gas-liquid coexistence <strong>with</strong> a planar<br />
<strong>in</strong>terface is realized for TT c <strong>and</strong> at the saturated vapor<br />
pressure p= p cx T.<br />
With the <strong>in</strong>troduction of the gradient entropy, there arises<br />
a length def<strong>in</strong>ed by<br />
= C/2k B v 0 1/2 ,<br />
2.8<br />
<strong>in</strong> addition to the molecular diameter v 1/3 0 . From Eq. 2.3<br />
the correlation length is def<strong>in</strong>ed by −2 =/n T /TC, so<br />
is proportional to as<br />
/ = n2v 0 k B TK T 1/2 ,<br />
2.9<br />
where K T =n/p T /n is the isothermal compressibility. The<br />
<strong>in</strong>terface thickness is of order <strong>in</strong> two-phase coexistence <strong>and</strong><br />
the surface tension is estimated as<br />
k B T1−T/T c 3/2 /v 0 , 2.10<br />
1/3<br />
<strong>in</strong> the mean-field theory see the Appendix. The ratio /v 0<br />
should be of order unity for real simple fluids. However, we<br />
may treat as an arbitrary parameter <strong>in</strong> our phase field<br />
scheme.<br />
In our previous paper 49, the <strong>in</strong>ternal energy density<br />
conta<strong>in</strong>s a positive gradient part <strong>in</strong> addition to the regular<br />
part e expressed <strong>in</strong> terms of T <strong>and</strong> n as <strong>in</strong> Eq. 2.5. Namely,<br />
the total <strong>in</strong>ternal energy density is the sum e+Kn 2 /2,<br />
where the coefficient K may depend on n. The gradient term<br />
<strong>in</strong> the Helmholtz free-energy density is then of the form<br />
Mn 2 /2 <strong>with</strong> M =CT+K. In this paper, however, we assume<br />
C0 <strong>and</strong> K=0 for simplicity, neglect<strong>in</strong>g the gradient<br />
energy. This approximation should not affect the essential<br />
aspects of the dynamical effects <strong>in</strong> this paper.<br />
B. Hydrodynamic equations<br />
We set up the hydrodynamic equations from the pr<strong>in</strong>ciple<br />
of positive entropy production <strong>in</strong> n<strong>one</strong>quilibrium 55. The<br />
mass density =mn obeys the cont<strong>in</strong>uity equation,<br />
021603-2
SPREADING WITH EVAPORATION AND CONDENSATION …<br />
<br />
=− · v,<br />
t 2.11<br />
where v is the velocity field assumed to vanish on all the<br />
boundaries. In the presence of an externally applied potential<br />
field Ur per unit mass, we write the equation for the<br />
momentum density v as<br />
<br />
t v =− · vv + J − J − U. 2.12<br />
In our previous work 49 we set U=gz for a gravitational<br />
field <strong>with</strong> g be<strong>in</strong>g the gravity acceleration. We note that U<br />
may also represent the van der Waals <strong>in</strong>teraction between the<br />
fluid particles <strong>and</strong> the solid depend<strong>in</strong>g the distance from the<br />
wall 1. The stress tensor is divided <strong>in</strong>to three parts. vv is<br />
the <strong>in</strong>ertial part. J = ij is the reversible part <strong>in</strong>clud<strong>in</strong>g the<br />
gradient stress tensor,<br />
ij = p − CTn 2 n + 1 2 n2 ij + CT i n j n,<br />
2.13<br />
where p is the van der Waals pressure <strong>in</strong> Eq. 2.6. Hereafter<br />
i =/x i <strong>with</strong> x i represent<strong>in</strong>g x, y, orz. J = ij is the viscous<br />
stress tensor expressed as<br />
ij = i v j + j v i + −2/3 · v ij , 2.14<br />
<strong>in</strong> terms of the shear viscosity <strong>and</strong> the bulk viscosity .<br />
Includ<strong>in</strong>g the k<strong>in</strong>etic-energy density <strong>and</strong> the potential energy,<br />
we def<strong>in</strong>e the total energy density by e T =e+v 2 /2+U. It<br />
is a conserved quantity governed by 56<br />
<br />
t e T =− · e T v + J − J · v − T, 2.15<br />
where is the thermal conductivity. With these hydrodynamic<br />
equations <strong>in</strong>clud<strong>in</strong>g the gradient contributions, the entropy<br />
density Ŝ <strong>in</strong> Eq. 2.1 obeys<br />
Ŝ<br />
t + ·Ŝv − Cn · v n − T T = ˙v + ˙<br />
,<br />
T<br />
2.16<br />
where the right-h<strong>and</strong> side is the non-negative-def<strong>in</strong>ite entropy<br />
production rate <strong>with</strong><br />
˙v = ij j v i ,<br />
ij<br />
˙ = T 2 /T.<br />
2.17<br />
In pass<strong>in</strong>g, the constant s 0 <strong>in</strong> Eq. 2.4 may be omitted <strong>in</strong> Eq.<br />
2.16 ow<strong>in</strong>g to the cont<strong>in</strong>uity equation 2.11.<br />
C. Boundary conditions<br />
We assume the no-slip boundary condition,<br />
v = 0,<br />
2.18<br />
on all the boundaries for simplicity. However, a number of<br />
molecular-dynamics simulations have shown that a slip of<br />
the fluid velocity tangential to the wall becomes significant<br />
around a mov<strong>in</strong>g contact l<strong>in</strong>e 57. On the basis of their<br />
molecular-dynamics simulation 58, Qian et al. proposed to<br />
use a generalized Navier boundary condition on a solid<br />
boundary <strong>in</strong> the cont<strong>in</strong>uum limit. In our work, even under the<br />
no-slip boundary condition, a significant velocity field is <strong>in</strong>duced<br />
around a contact l<strong>in</strong>e 28 or an advanc<strong>in</strong>g film edge.<br />
We assume the surface entropy density s n s <strong>and</strong> the surface<br />
energy density e s n s depend<strong>in</strong>g on the fluid density at<br />
the surface, written as n s . The total entropy <strong>in</strong>clud<strong>in</strong>g the<br />
surface contribution is of the form<br />
S tot = drŜ + da s ,<br />
2.19<br />
where da is the surface <strong>in</strong>tegral over the boundaries. The<br />
total fluid energy is given by<br />
E tot = dre + 1 2 v2 + U + dae s .<br />
2.20<br />
We assume that there is no strong adsorption of the fluid<br />
particles onto the boundary walls. The fluid density is cont<strong>in</strong>uously<br />
connected from the bulk to the boundary surfaces;<br />
for example, we have n s x,y,t=lim z→+0 nr,t at z=0. Then<br />
the total particle number of the fluid <strong>in</strong> the cell is the bulk<br />
<strong>in</strong>tegral N=drn.<br />
We assume that the temperatures <strong>in</strong> the fluid <strong>and</strong> <strong>in</strong> the<br />
solid are cont<strong>in</strong>uously connected at the surfaces. The temperature<br />
on the substrate is then well def<strong>in</strong>ed <strong>and</strong> we may<br />
<strong>in</strong>troduce the surface Helmholtz free-energy density<br />
f s = e s − T s .<br />
As the surface boundary condition, we require<br />
2.21<br />
Cˆ b · n = −1 f s<br />
, 2.22<br />
T n sT<br />
where ˆ b is the outward surface normal unit vector. In the<br />
literature 1, this boundary condition is obta<strong>in</strong>ed <strong>in</strong> equilibrium<br />
<strong>with</strong> homogeneous T by m<strong>in</strong>imization of the total<br />
Helmholtz G<strong>in</strong>zburg-L<strong>and</strong>au free energy,<br />
F tot = dre − TŜ + daf s .<br />
2.23<br />
We assume the boundary condition 2.22 even <strong>in</strong> n<strong>one</strong>quilibrium,<br />
while us<strong>in</strong>g F tot <strong>in</strong> the bulk region <strong>with</strong> <strong>in</strong>homogeneous<br />
temperature is not appropriate. The use of Eqs. 2.16,<br />
2.19, <strong>and</strong> 2.22 now yields the total entropy <strong>in</strong>creas<strong>in</strong>g rate<br />
<strong>in</strong> our theory 55,<br />
d<br />
dt S tot = dr ˙v + ˙<br />
T<br />
PHYSICAL REVIEW E 82, 021603 2010<br />
+ da ˆ b · T + ė s<br />
, 2.24<br />
T<br />
where ė s =e s /t=e s /n s n s /t. The first term <strong>in</strong> the<br />
right-h<strong>and</strong> side is the bulk entropy production rate, while the<br />
second term is the surface <strong>in</strong>tegral of the heat flux from the<br />
solid divided by T or the entropy <strong>in</strong>put from the solid to the<br />
bulk fluid.<br />
021603-3
RYOHEI TESHIGAWARA AND AKIRA ONUKI<br />
In this paper, we present simulation results <strong>with</strong> U=0 for<br />
simplicity. In our previous work 49 a large gravity field<br />
was assumed <strong>in</strong> boil<strong>in</strong>g. In future we should <strong>in</strong>vestigate the<br />
effect of the long-range van der Waals <strong>in</strong>teraction <strong>in</strong> the wett<strong>in</strong>g<br />
dynamics.<br />
III. SIMULATION METHOD<br />
In our phase field simulation, we <strong>in</strong>tegrated the cont<strong>in</strong>uity<br />
equation 2.11, the momentum equation 2.12, <strong>and</strong> the entropy<br />
equation 2.16, not us<strong>in</strong>g the energy equation 2.15,<br />
as <strong>in</strong> our previous simulation 28. With this method, if there<br />
is no applied heat flow, temperature <strong>and</strong> velocity gradients<br />
tend to vanish at long times <strong>in</strong> the whole space <strong>in</strong>clud<strong>in</strong>g the<br />
<strong>in</strong>terface region. This numerical stability is achieved because<br />
the heat production rate ˙v+˙0 appears explicitly <strong>in</strong> the<br />
entropy equation, so that dS tot /dt0 <strong>in</strong> Eq. 2.24 <strong>with</strong>out<br />
applied heat flow. We then obta<strong>in</strong> smooth variations of the<br />
temperature <strong>and</strong> velocity near the film edge those around the<br />
contact l<strong>in</strong>e of an evaporat<strong>in</strong>g droplet <strong>in</strong> Ref. 28.<br />
It is worth not<strong>in</strong>g that many authors have encountered a<br />
parasitic flow around a curved <strong>in</strong>terface <strong>in</strong> numerically solv<strong>in</strong>g<br />
the hydrodynamic equations <strong>in</strong> two-phase states 52,59.<br />
It rema<strong>in</strong>s nonvanish<strong>in</strong>g even when the system should tend<br />
to equilibrium <strong>with</strong>out applied heat flow. It is an artificial<br />
flow s<strong>in</strong>ce its magnitude depends on the discretization<br />
method.<br />
A. Fluid <strong>in</strong> a cyl<strong>in</strong>drical cell<br />
We suppose a cyl<strong>in</strong>drical cell. Our model fluid is <strong>in</strong> the<br />
region 0zH <strong>and</strong> 0r=x 2 +y 2 1/2 L, where H<br />
=300x <strong>and</strong> L=400x <strong>with</strong> x be<strong>in</strong>g the simulation mesh<br />
length. The velocity field v vanishes on all the boundaries. In<br />
this axisymmetric geometry, all the variables are assumed to<br />
depend only on z, r, <strong>and</strong> t. The <strong>in</strong>tegration of the dynamic<br />
equations is on a 200400 lattice <strong>in</strong> the fluid region. We set<br />
x=/2, where is def<strong>in</strong>ed <strong>in</strong> Eq. 2.8. We will measure<br />
space <strong>in</strong> units of . Then H=150 <strong>and</strong> L=200 <strong>in</strong> units of .<br />
The transport coefficients are proportional to n as<br />
= = 0 mn, = k B 0 n. 3.1<br />
These coefficients are larger <strong>in</strong> liquid than <strong>in</strong> gas by the<br />
density ratio n /n g 5 <strong>in</strong> our simulation. The k<strong>in</strong>ematic<br />
viscosity 0 =/mn is a constant. We will measure time <strong>in</strong><br />
units of the viscous relaxation time,<br />
0 = 2 / 0 = C/2k B v 0 0 ,<br />
3.2<br />
on the scale of . The time mesh size of our simulation is<br />
t=0.01 0 . Away from the criticality, the thermal diffusivity<br />
D T =/C p is of order 0 <strong>and</strong> the Pr<strong>and</strong>tl number Pr= 0 /D T<br />
is of order unity, so 0 is also the thermal relaxation time on<br />
the scale of . Here, the isobaric specific heat C p per unit<br />
volume is of order n far from the criticality, while it grows <strong>in</strong><br />
its vic<strong>in</strong>ity. With Eq. 3.1, there arises a dimensionless number<br />
given by<br />
= m 2 0 / 2 = m 2 / 2 0 .<br />
3.3<br />
The transport coefficients are proportional to 0 1/2 . For<br />
He 3 , for example, the critical temperature is T c =3.32 K <strong>and</strong>,<br />
PHYSICAL REVIEW E 82, 021603 2010<br />
by sett<strong>in</strong>g =27k B T c /8 from Eq. 2.7, we have 1/2 <br />
= 0 m/ 1/2 =2.0310 −8 cm near the gas-liquid critical<br />
po<strong>in</strong>t. In this paper we set =0.06, for which sound waves<br />
are well def<strong>in</strong>ed as oscillatory modes for wavelengths longer<br />
than see Fig. 6 49.<br />
We will measure velocities <strong>in</strong> units of / 0 = 0 /. Another<br />
velocity unit is the capillary velocity / <strong>with</strong> be<strong>in</strong>g<br />
the liquid viscosity. At T=0.875T c , the surface tension is<br />
calculated as<br />
= 0.082k B T c /v 0 = 0.66p c .<br />
3.4<br />
Us<strong>in</strong>g Eqs. 3.1 <strong>and</strong> 3.2 <strong>and</strong> sett<strong>in</strong>g =0.06 we f<strong>in</strong>d /<br />
0.03/ 0 0.5/ 0 . These velocity units are of the same<br />
order, much exceed<strong>in</strong>g the film speed <strong>and</strong> the gas velocity<br />
near the film edge discussions regard<strong>in</strong>g Fig. 4.<br />
The temperature at the top z=H is fixed at T H , while the<br />
sidewall at r=L is thermally <strong>in</strong>sulat<strong>in</strong>g or ˆ b·T=T/r=0<br />
at r=L. As the boundary condition of the density, we set<br />
n/z=0 on the top plate at z=H <strong>and</strong> n/r=0 on the sidewall<br />
at r=L. On the substrate z=0, it is given by<br />
v 0 n<br />
z =− 1,<br />
3.5<br />
where 1 arises from the short-range <strong>in</strong>teraction between the<br />
fluid <strong>and</strong> the solid wall 1,45. From Eqs. 2.19–2.22 this<br />
can be the case if e s =const <strong>and</strong> s = 1 C/v 0 n s +const,<br />
where the constant terms are <strong>in</strong>dependent of n. We treat 1<br />
as a parameter <strong>in</strong>dependent of T around T=0.875T c . For example,<br />
at T=0.875T c , the contact angle is /2 at 1 =0,<br />
0.32 at 1 =0.05 28, <strong>and</strong> zero at 1 = 1c 0.06. The wall<br />
is completely wetted by liquid for 1 1c <strong>in</strong> equilibrium.<br />
B. Solid substrate<br />
In our previous work, we assumed a constant temperature<br />
at the bottom plate z=0 28,48,49. In this paper, we suppose<br />
the presence of a sold wall <strong>in</strong> the region −H w z0 <strong>and</strong> 0<br />
r=x 2 +y 2 1/2 L, where its thickness is H w =100x=50<br />
=H/3. The temperature <strong>in</strong> the solid obeys the thermal diffusion<br />
equation<br />
C w<br />
T<br />
t = w 2 T,<br />
3.6<br />
where C w is the heat capacity per unit volume <strong>and</strong> w is the<br />
thermal conductivity of the solid. The temperature Tr,z,t is<br />
cont<strong>in</strong>uous across the substrate z=0. In our simulation, the<br />
thermal diffusivity <strong>in</strong> the solid is given by D w = w /C w<br />
=400 0 , while the thermal diffusivity of the fluid D T is of<br />
order 0 away from the criticality. Thus, the thermal relaxation<br />
time <strong>in</strong> the substrate is H w 2 /D w =25 0 , which is shorter<br />
than typical spread<strong>in</strong>g times to follow. Because D w D T ,we<br />
<strong>in</strong>tegrated Eq. 3.6 us<strong>in</strong>g the implicit Crank-Nicolson<br />
method on a 100400 lattice.<br />
In this paper, the temperature T at the substrate bottom<br />
z=−H w is held fixed at a constant T w . That is, for any r, we<br />
assume<br />
021603-4
SPREADING WITH EVAPORATION AND CONDENSATION …<br />
Tr,− H w = T w .<br />
3.7<br />
Heat<strong>in</strong>g cool<strong>in</strong>g of the fluid occurs when T w is higher<br />
lower than the <strong>in</strong>itial fluid temperature T 0 . There is no heat<br />
flux through the sidewall, so T/r=0 at r=L as <strong>in</strong> the fluid<br />
region. From the energy conservation at the boundary, the<br />
heat flux on the substrate surface is cont<strong>in</strong>uous as<br />
w T z=−0 = T z=+0 ,<br />
3.8<br />
where T=T/z. This holds if there is no appreciable variation<br />
of the surface energy density e s . We def<strong>in</strong>e the parameter<br />
= /nv 0 w = k B 0 /v 0 w .<br />
3.9<br />
Then T z=−0 =n s v 0 T z=+0 on the substrate. In this paper,<br />
is set equal to 0.002 or 0.2. We found that the boundary<br />
temperature at z=0 is nearly isothermal at T=T w for <br />
=0.002 but considerably <strong>in</strong>homogeneous around the edge for<br />
=0.2 see Figs. 4, 5, <strong>and</strong> 8 below.<br />
C. Preparation of the <strong>in</strong>itial state <strong>and</strong> weak adsorption preexist<strong>in</strong>g<br />
before spread<strong>in</strong>g<br />
To prepare the <strong>in</strong>itial state, we first placed a semispheric<br />
liquid droplet <strong>with</strong> radius R=40 on the substrate z=0 <strong>with</strong><br />
gas surround<strong>in</strong>g it. Here, we set 1 =0 to suppress adsorption<br />
of the fluid to the solid. The temperature <strong>and</strong> pressure were<br />
T=T 0 =0.875T c <strong>and</strong> p= p cx T 0 =0.573p c on the coexistence<br />
l<strong>in</strong>e <strong>in</strong> the fluid. The liquid <strong>and</strong> gas densities were those on<br />
the coexistence curve, n 0 −1<br />
0<br />
=0.579v 0 <strong>in</strong> liquid <strong>and</strong> n g<br />
=0.123v −1 0 <strong>in</strong> gas. The entropy difference between the two<br />
phases is 2.1k B per particle. The total particle number is N<br />
=2n 0 −n 0 g R 3 /3+n 0 g L 2 H=1.6110 6 3 /v 0 . The particle<br />
number <strong>in</strong> the droplet is about 5% of N.<br />
Next, we waited for an equilibration time of 10 4 <strong>with</strong><br />
1 =0. The contact angle was kept at /2 <strong>and</strong> ˆ b·n=0 on<br />
all the boundary surfaces. As will be shown <strong>in</strong> the Appendix,<br />
the liquid <strong>and</strong> gas pressures were slightly changed to 0.608p c<br />
<strong>and</strong> 0.575p c , respectively. The pressure difference p<br />
=0.033p c is equal to 2/R from the Laplace law, where is<br />
<strong>in</strong> Eq. 3.4. As a result, the liquid density was <strong>in</strong>creased to<br />
0.583v −1 0 <strong>and</strong> the droplet radius was decreased to 38. Thus,<br />
the fluid nearly reached equilibrium <strong>with</strong> =/2 or <strong>with</strong>out<br />
excess boundary adsorption. After this equilibration we hereafter<br />
set t=0 as the orig<strong>in</strong> of the time axis.<br />
At t=0, we changed the wett<strong>in</strong>g parameter 1 <strong>in</strong> the<br />
boundary condition 3.5 from 0 to 0.061 to realize the complete<br />
wett<strong>in</strong>g condition. Before appreciable spread<strong>in</strong>g, weak<br />
adsorption of the fluid has been <strong>in</strong>duced on the substrate <strong>in</strong> a<br />
short time of order unity <strong>in</strong> units of 0 . For small 1 <strong>and</strong><br />
away from the contact l<strong>in</strong>e, this pre-exist<strong>in</strong>g density deviation,<br />
written as nz, is of the exp<strong>one</strong>ntial form<br />
nz = 1 /v 0 e −z/ ,<br />
3.10<br />
<strong>in</strong> terms of the correlation length . Note that homogeneity of<br />
ˆ <strong>in</strong> Eq. 2.3 yields −2 − 2 /z 2 n=0 <strong>in</strong> the l<strong>in</strong>ear order,<br />
lead<strong>in</strong>g to Eq. 3.10 under Eq. 3.5. The z <strong>in</strong>tegration of<br />
nz is the excess adsorption<br />
PHYSICAL REVIEW E 82, 021603 2010<br />
ad = 2 1 /v 0 .<br />
3.11<br />
In the gas at T=0.875T c , Eq. 2.9 gives =1.68, lead<strong>in</strong>g to<br />
ad =0.24/v 0 . We shall see that this pre-exist<strong>in</strong>g adsorption<br />
is <strong>one</strong> order of magnitude smaller than that due to a precursor<br />
film 2.5/v 0 <strong>in</strong> Fig. 6 below.<br />
IV. SPREADING ON A COOLED SUBSTRATE<br />
We present numerical results of spread<strong>in</strong>g on a cooler<br />
substrate after the change of 1 . In <strong>one</strong> case, the bottom<br />
temperature T w at z=−H w was lowered at t=0 from T 0<br />
=0.875T c to 0.870T c . In the other case, we kept T w =T 0 even<br />
for t0. The top temperature at z=H was unchanged from<br />
T 0 . Subsequently, spread<strong>in</strong>g occurred <strong>with</strong> an <strong>in</strong>crease <strong>in</strong> the<br />
liquid fraction due to <strong>condensation</strong> from gas to a precursor<br />
film. The fluid temperature near the film edge became significantly<br />
higher than the substrate temperature <strong>in</strong> these<br />
cases.<br />
However, ahead of the film, a new liquid region a r<strong>in</strong>g <strong>in</strong><br />
our geometry appeared on the substrate for slightly deeper<br />
cool<strong>in</strong>g say, for T w =0.868T c or for slightly larger 1 say,<br />
for 1 =0.065. Such dew nucleation is another problem beyond<br />
the scope of this paper 60.<br />
A. Evolution on long <strong>and</strong> short time scales<br />
We first exam<strong>in</strong>e spread<strong>in</strong>g <strong>in</strong> the cooled case T w<br />
=0.870T c T 0 for =0.002 <strong>and</strong> 0.2. In the early stage,<br />
strong disturbances are <strong>in</strong>duced around the contact l<strong>in</strong>e, as <strong>in</strong><br />
the case of droplet heat<strong>in</strong>g <strong>in</strong> the partial wett<strong>in</strong>g condition<br />
28. For example, at t=25, the maximum gas velocity is<br />
v g =0.089 <strong>and</strong> the contact l<strong>in</strong>e velocity is 0.14 for =0.2.<br />
For t200, a precursor film becomes well def<strong>in</strong>ed <strong>with</strong> reduced<br />
typical velocities.<br />
Figure 1 displays droplet shapes <strong>in</strong> later times t500 for<br />
=0.002 <strong>and</strong> 0.2, where the liquid is divided <strong>in</strong>to the droplet<br />
body <strong>in</strong> the region rr th <strong>and</strong> the precursor film <strong>in</strong> the region<br />
r th rr e t. While r e t <strong>in</strong>creases <strong>in</strong> time, r th is nearly<br />
p<strong>in</strong>ned around 52.5=0.26L. In our simulation, this p<strong>in</strong>n<strong>in</strong>g<br />
occurred for t200. The film thickness f also only weakly<br />
depends on time be<strong>in</strong>g about 5 for =0.02 <strong>and</strong> 0.2 see the<br />
film profiles <strong>in</strong> Fig. 6 below. From the droplet profile<br />
around r=r th the apparent contact angle ap decreases <strong>in</strong> time<br />
roughly as t −b <strong>with</strong> b0.7 for 20t310 3 . However,<br />
considerable uncerta<strong>in</strong>ties arise <strong>in</strong> the def<strong>in</strong>itions of r th <strong>and</strong><br />
ap s<strong>in</strong>ce the droplet height r th ap approaches f for our<br />
small droplet. On the other h<strong>and</strong>, <strong>in</strong> the previous experiments<br />
on <strong>in</strong>volatile droplets 4–6,8, the droplet radius R was relatively<br />
large such that the droplet volume much exceeded the<br />
volume of a possible precursor film. As regard the droplet<br />
body, they confirmed Tanner’s law derived from hydrodynamics<br />
4 the droplet radius <strong>in</strong>creases slowly as Rt <strong>with</strong><br />
0.1 <strong>and</strong> the apparent contact angle decreases as ap<br />
t − <strong>with</strong> 0.3.<br />
Figure 2 gives the edge position r e t <strong>and</strong> the particle<br />
number <strong>in</strong> the total liquid region N t as functions of time t<br />
for =0.2 <strong>in</strong> the cooled case <strong>with</strong> T w =0.870T c <strong>and</strong> <strong>in</strong> the<br />
noncooled case <strong>with</strong> T w =T 0 =0.875T c . In the early stage,<br />
r e t represents the droplet edge start<strong>in</strong>g <strong>with</strong> the <strong>in</strong>itial drop-<br />
021603-5
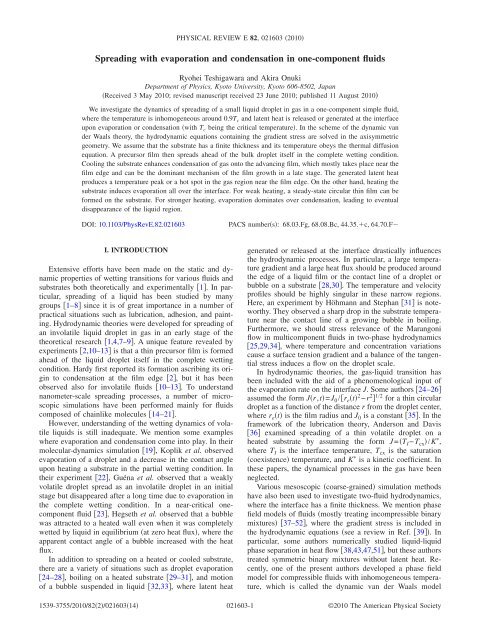
RYOHEI TESHIGAWARA AND AKIRA ONUKI<br />
Z<br />
40<br />
20<br />
let radius =38. It exceeds r th =52.5 for t170. In these<br />
cooled <strong>and</strong> noncooled cases, r e t <strong>and</strong> N t grow <strong>in</strong> time due<br />
to <strong>condensation</strong>. We calculate N t from<br />
r e t<br />
t=500 t=1000 t=2000<br />
t=3000 t=4000 t=5000<br />
0<br />
0 20 40 60 80 100 120 140 160 180<br />
r = 52.5 r<br />
th<br />
40<br />
Λ=0.2<br />
20<br />
0<br />
0 20 40 60 80 100 120 140 160 180<br />
Z<br />
0<br />
r=r e<br />
r th = 52.5<br />
Λ=0.2 t=500<br />
r<br />
L<br />
z <strong>in</strong>t r,t<br />
N t dznr,t, 4.1<br />
=20<br />
drr0<br />
where the <strong>in</strong>terface height is at z=z <strong>in</strong>t r,t <strong>in</strong> the range 0<br />
rr e t. z <strong>in</strong>t r,t is determ<strong>in</strong>ed by<br />
nr,z <strong>in</strong>t ,t = n 0 + n g 0 /2,<br />
Λ=0.002<br />
t=4000<br />
0 r<br />
L<br />
r=r e<br />
4.2<br />
where n 0 =0.579v 0 −1 <strong>and</strong> n g 0 =0.123v 0 −1 are the densities on the<br />
coexistence curve at T=0.875T c . In our case, the film is so<br />
Z<br />
Λ=0.2<br />
FIG. 1. Color onl<strong>in</strong>e Shapes of an axisymmetric small droplet<br />
spread<strong>in</strong>g on a cooler substrate <strong>with</strong> T w =0.870T c at various times<br />
t500 for =0.002 top <strong>and</strong> 0.2 middle <strong>in</strong> the r-z plane. The<br />
system temperature was <strong>in</strong>itially T 0 =0.875T c at t=0. The boundary<br />
position between the ma<strong>in</strong> body of the droplet <strong>and</strong> the precursor<br />
film is fixed at r=r th =52.5 at these times for =0.02 <strong>and</strong> 0.2. The<br />
edge position r e t of the film <strong>in</strong>creases <strong>with</strong> time as illustrated <strong>in</strong><br />
the bottom plates.<br />
r e /L<br />
1<br />
0.8<br />
0.6<br />
Λ=0.2<br />
0.4<br />
T w< T0<br />
T w= T0<br />
0.2<br />
0 2 4 6 8<br />
10 -3 t<br />
N (t) /N(0)<br />
4<br />
3<br />
Λ=0.2<br />
2<br />
T w < T0<br />
T w = T0<br />
1<br />
0 2 4 6 8<br />
10 -3 t<br />
FIG. 2. Color onl<strong>in</strong>e Time evolutions of the edge position r e t<br />
divided by L left <strong>and</strong> the particle number <strong>in</strong> the droplet N t<br />
divided by N 0 right for =0.2. The upper curve corresponds to<br />
T w =0.870T c T 0 red, while the lower <strong>one</strong> corresponds to T w<br />
=0.875T c =T 0 green. The <strong>in</strong>terface curve is determ<strong>in</strong>ed by Eq.<br />
4.2. The film edge reaches the sidewall at t10 4 . Condensation<br />
occurs faster <strong>in</strong> the cooled case T w T 0 than <strong>in</strong> the noncooled case<br />
T w =T 0 .<br />
10 Q b<br />
3<br />
0<br />
-1<br />
-2<br />
PHYSICAL REVIEW E 82, 021603 2010<br />
(a)<br />
(a)<br />
T = 0.870T<br />
(b)<br />
t=500<br />
t=2000<br />
t=5000<br />
(a)<br />
(b)<br />
Λ=0.2<br />
Λ=0.002<br />
(b)<br />
-3<br />
0 0.2 0.4 0.6 0.8 1<br />
r = r/L<br />
r th<br />
FIG. 3. Color onl<strong>in</strong>e Heat flux on the substrate Q b r,t as a<br />
function of r <strong>in</strong> units of /v 0 0 for T w =0.870T c T 0 <strong>with</strong> <br />
=0.002 <strong>and</strong> 0.2 at t=500 left, 2000 middle, <strong>and</strong> 5000 right. A<br />
negative peak at the film edge <strong>in</strong>dicates transport of latent heat from<br />
the fluid to the solid. At long times this absorption becomes weaker<br />
<strong>and</strong> there appears a heat flow from the solid to the fluid for rr th .<br />
th<strong>in</strong> <strong>and</strong> there is no unique def<strong>in</strong>ition of z <strong>in</strong>t . Then N t starts<br />
from the <strong>in</strong>itial number N 0=0.6710 5 3 /v 0 <strong>and</strong> becomes<br />
a few times larger at t10 4 . In the time region 20t3<br />
10 3 , we roughly obta<strong>in</strong><br />
r e t − r e 0t 0.6 , N t − N 0t 1.1 , 4.3<br />
both for T w /T c =0.870 <strong>and</strong> 0.875. For t20, dr r /dt <strong>and</strong> the<br />
maximum gas velocity are of order 0.1.<br />
In Fig. 3, we display the heat flux on the substrate Q b r,t<br />
for the same runs. From Eq. 3.8 it is def<strong>in</strong>ed <strong>in</strong> terms of the<br />
temperature gradient T=T/z as<br />
Q b r,t =− w T z=−0 =−T z=+0 .<br />
4.4<br />
Negative peaks <strong>in</strong>dicate absorption of latent heat from the<br />
fluid to the substrate around the film edge. However, at long<br />
times t=510 3 <strong>in</strong> the figure heat is from the solid to the<br />
fluid <strong>in</strong> the region of the droplet body rr th . The amplitude<br />
of Q b r,t around the peak is larger for =0.002 than for<br />
=0.2, obviously because heat is more quickly transported<br />
for smaller or for larger w . Also Q b r,t is sensitive to<br />
T 0 −T w . For example, <strong>in</strong> the noncooled case T w =T 0 , the<br />
m<strong>in</strong>ima of Q b r,t became about half of those <strong>in</strong> Fig. 3 not<br />
shown here. In our previous simulation 28, a positive peak<br />
of Q b r,t was found at the contact l<strong>in</strong>e of an evaporat<strong>in</strong>g<br />
droplet.<br />
In Fig. 4, we present the temperature near the edge at t<br />
=10 3 <strong>in</strong> color <strong>in</strong> the upper panel <strong>and</strong> the substrate temperature<br />
at z=0 <strong>in</strong> the lower panel, where =0.2 <strong>and</strong> T w<br />
=0.870T c T 0 . The fluid temperature exhibits a hot spot <strong>in</strong><br />
the gas side produced by latent heat. The substrate temperature<br />
is maximum at the film edge. Such a temperature variation<br />
<strong>in</strong> the solid should be measurable 31. In this run, the<br />
peak height of the hot spot is T p −T w /T c =0.01. At t=10 3 ,<br />
the maximum gas velocity is v g =0.014 around the hot spot,<br />
while the mean velocity <strong>in</strong> the film near the edge is of order<br />
0.01. The correspond<strong>in</strong>g Reynolds number v g f / 0 <strong>in</strong> the gas<br />
is small 0.07 here. Surpris<strong>in</strong>gly, the fastest velocity is the<br />
edge speed dr e /dt=0.04 <strong>in</strong> this case. It is possible when the<br />
film exp<strong>and</strong>s due to <strong>condensation</strong> near the film edge. On the<br />
w<br />
(a)<br />
(b)<br />
C<br />
021603-6
SPREADING WITH EVAPORATION AND CONDENSATION …<br />
PHYSICAL REVIEW E 82, 021603 2010<br />
0.2<br />
t=1000<br />
Λ=0.2<br />
0.570<br />
p/ p Λ=0.2<br />
c<br />
T/<br />
T<br />
0.576<br />
0.874 c<br />
Λ=0.2<br />
z/H<br />
c<br />
T / T<br />
0.1<br />
0<br />
-0.05<br />
0.25 0.3 0.35 0.4 0.45 0.5 0.55<br />
0.875<br />
0.873<br />
0.871<br />
0.25<br />
τ<br />
r/L<br />
1.4x10 -2 / 0 T/Tc<br />
0.868 0.880<br />
0.3 0.35 0.4 0.45 0.5 0.55<br />
r / L<br />
z=0<br />
FIG. 4. Color onl<strong>in</strong>e Temperature T around an advanc<strong>in</strong>g film<br />
edge at t=10 3 , where T w =0.870T c <strong>and</strong> =0.2. In the top, the color<br />
represents the temperature accord<strong>in</strong>g to the color map, <strong>and</strong> the velocity<br />
field is shown by arrows <strong>with</strong> its maximum be<strong>in</strong>g 1.4<br />
10 −2 / 0 . In the bottom, the substrate temperature at z=0 is plotted,<br />
which is maximum at the edge position due to a f<strong>in</strong>ite thermal<br />
conductivity of the solid.<br />
other h<strong>and</strong>, <strong>in</strong> the noncooled case T w =T 0 , the peak height<br />
was reduced to T p −T 0 =0.007T c <strong>and</strong> v g to 0.008 at t=10 3 .<br />
In Fig. 5, we show time evolution of the temperature<br />
maxima, denoted by T p <strong>and</strong> T sp , <strong>in</strong> the fluid <strong>and</strong> on the substrate<br />
at z=0, respectively, <strong>in</strong> the cooled case T w =0.870T c<br />
for =0.2 <strong>and</strong> 0.002. The maxima are at the contact l<strong>in</strong>e<br />
right after the cool<strong>in</strong>g <strong>and</strong> near the film edge after the precursor<br />
film formation. The substrate temperature also exhibits<br />
a smaller peak for =0.2, but it becomes nearly homogeneous<br />
for =0.002.<br />
In Fig. 6, we display time evolution of the pressure <strong>and</strong><br />
the temperature at the position z,r=0.48H,0.5L <strong>in</strong> the<br />
0.89<br />
0.88<br />
T/T c<br />
Λ=0.2<br />
T/T c<br />
Λ=0.002<br />
T p (t) 0.89<br />
T p (t)<br />
0.89<br />
T sp (t)<br />
0.88<br />
T sp (t)<br />
0.88<br />
0.87 0<br />
0.88<br />
0.87<br />
100 200<br />
0 100 200<br />
t<br />
t<br />
0.87<br />
0 2 4 6 8<br />
0.87<br />
0 2 4 6 8<br />
-3<br />
10 t<br />
0.89<br />
-3<br />
10 t<br />
FIG. 5. Color onl<strong>in</strong>e Maxima of the fluid temperature T p t<br />
upper curve <strong>and</strong> the substrate temperature T sp t lower curve vs<br />
time t <strong>in</strong> the cooled case T w =0.870T c <strong>with</strong> =0.2 left <strong>and</strong> <br />
=0.002 right. T p is the temperature at the hot spot after formation<br />
of a precursor film, while it is the temperature at the contact l<strong>in</strong>e at<br />
short times. Peak height T sp −T w on the substrate is still significant<br />
for =0.2 but is nearly zero for =0.002. Insets: behavior of T p<br />
<strong>and</strong> T sp <strong>in</strong> an early stage, where m<strong>in</strong>ima are produced by a lowpressure<br />
acoustic pulse reflected from the upper boundary see the<br />
<strong>in</strong>sets of Fig. 6.<br />
0.562<br />
0.554<br />
0.566<br />
0.556<br />
0 100 200<br />
0.546<br />
0 2 4<br />
-3<br />
6 8<br />
10 t<br />
t<br />
0.870<br />
0.866<br />
0.874<br />
0.868<br />
0.862<br />
0<br />
0.862<br />
0 2 4<br />
-3<br />
6 8<br />
10 t<br />
FIG. 6. Pressure left <strong>and</strong> temperature right vs t at the po<strong>in</strong>t<br />
z/H,r/L=0.48,0.5 far from the substrate <strong>in</strong> gas, where T w<br />
=0.870T c <strong>and</strong> =0.2. Their short-time behavior t200 is due to<br />
propagation of a low-pressure sound pulse <strong>in</strong> the cell <strong>and</strong> is adiabatic<br />
<strong>in</strong>set, while their long-time behavior is due to gradual<br />
<strong>condensation</strong>.<br />
gas region far from the substrate <strong>in</strong> the cooled case T w<br />
=0.870T c <strong>with</strong> =0.2. In the <strong>in</strong>set, their <strong>in</strong>itial deviations<br />
orig<strong>in</strong>ate from a lower-pressure sound pulse emitted from the<br />
adsorption layer <strong>in</strong> Eq. 3.10. This acoustic process is an<br />
example of the piston effect 61,62. In the present case, the<br />
thermal diffusion layer due to cool<strong>in</strong>g of the substrate gives<br />
rise to a smaller effect. The emitted pulse traverses the cell<br />
on the acoustic time H/c g 50 <strong>and</strong> is reflected at the top<br />
plate, where c g 4 is the sound velocity <strong>in</strong> the gas. The first<br />
deep m<strong>in</strong>ima of T below T w <strong>and</strong> that of p at t25 are due to<br />
its first passage. Here, the adiabatic relation T<br />
=T/p s p is well satisfied for the deviations T=T−T 0<br />
<strong>and</strong> p= p− p 0 . The adiabatic coefficient T/p s is equal to<br />
11T c / p c <strong>in</strong> the gas <strong>and</strong> is larger than that <strong>in</strong> the liquid by <strong>one</strong><br />
order of magnitude. On long time scales, Fig. 6 shows that<br />
the pressure gradually decreases <strong>with</strong> progress of <strong>condensation</strong>,<br />
while the temperature <strong>in</strong>creases for 200t1500,<br />
slowly decreases for 1500t3000, <strong>and</strong> aga<strong>in</strong> <strong>in</strong>creases for<br />
longer t. The gas temperature <strong>in</strong> the middle region is slightly<br />
higher than T w by 0.002T c at t=910 3 . We note that the gas<br />
temperature is <strong>in</strong>fluenced by a gas flow from the droplet <strong>and</strong><br />
behaves <strong>in</strong> a complicated manner.<br />
B. Profiles of density, temperature, <strong>and</strong> pressure<br />
Here, we <strong>in</strong>troduce the normal pressure p˜ by<br />
p˜ = ˆ iˆ j ij = p − CTn 2 n − n 2 /2, 4.5<br />
ij<br />
where ij is the reversible stress tensor <strong>in</strong> Eq. 2.13, p is the<br />
van der Waals pressure <strong>in</strong> Eq. 2.6, <strong>and</strong> ˆ =ˆ i<br />
= i n/n is the unit vector along the density gradient n.<br />
Obviously, p˜ p <strong>in</strong> the bulk region. In equilibrium, p˜ is <strong>in</strong>dependent<br />
of space <strong>and</strong> is equal to the saturation pressure<br />
p cx T across a planar <strong>in</strong>terface, while its deviation from<br />
p cx T is of order R −1 across a spherical <strong>in</strong>terface <strong>with</strong> radius<br />
R −1 see the Appendix. Even <strong>in</strong> n<strong>one</strong>quilibrium, we found<br />
that <strong>in</strong>homogeneity of p˜ around an <strong>in</strong>terface rema<strong>in</strong>s relatively<br />
weak smaller than that of p by <strong>one</strong> order of magnitude.<br />
In Fig. 7, we show the profiles of the density n, the temperature<br />
T, <strong>and</strong> the normal pressure p˜ along the density gra-<br />
t<br />
100<br />
200<br />
021603-7
RYOHEI TESHIGAWARA AND AKIRA ONUKI<br />
v 0 n<br />
10 4 (T-T w )/T c<br />
p/p c<br />
~<br />
0.7<br />
0.5<br />
0.3<br />
0.1<br />
0 0.04 0.08 0.12<br />
z/H<br />
0<br />
-4<br />
-8<br />
0.564<br />
0.562<br />
0.560<br />
0.558<br />
0.556<br />
r/L=0.125<br />
0 0.04 0.08 0.12<br />
z/H<br />
0 0.04 0.08 0.12<br />
z / H<br />
dient at t=210 3 for =0.2 <strong>and</strong> T w =0.870T c . In the left<br />
panels of Fig. 7 for r=0.125Lr th , we can see weak adsorption<br />
near the wall <strong>in</strong> Eq. 3.10, a well-def<strong>in</strong>ed <strong>in</strong>terface at<br />
z20, <strong>and</strong> a small negative temperature gradient <strong>with</strong><strong>in</strong> the<br />
droplet body. For this r, a heat flow is weakly from the solid<br />
to the fluid. This is because the gas region above the droplet<br />
was <strong>in</strong>itially cooled due to the piston effect, as Fig. 6 <strong>in</strong>dicates.<br />
On the other h<strong>and</strong>, <strong>in</strong> the right panels for r=0.55L<br />
r th , n decreases from a liquid density near the wall to a gas<br />
density <strong>with</strong>out a region of a flat density <strong>and</strong> T exhibits a<br />
peak. In this case, the hot peak is located at r=0.59L. The<br />
temperature variation around the film is larger than that <strong>in</strong><br />
the droplet body by <strong>one</strong> order of magnitude. Furthermore,<br />
Fig. 8 gives a bird’s eye view of the temperature near the<br />
edge from the same run, which corresponds to the middle<br />
right panel <strong>in</strong> Fig. 7. Here, the temperature <strong>in</strong>homogeneity <strong>in</strong><br />
the solid can also be seen.<br />
It is of <strong>in</strong>terest how the normal pressure <strong>and</strong> the temperature<br />
p˜ ,T at the <strong>in</strong>terface is close to the coexistence l<strong>in</strong>e<br />
(p cx T,T) <strong>in</strong> the p-T phase diagram. We def<strong>in</strong>e<br />
h = T − T 0<br />
T c<br />
t=2000 Λ=0.2<br />
0.1<br />
0 0.04 0.08 0.12<br />
z/H<br />
− T p˜ − p 0<br />
, 4.6<br />
pcx T c<br />
where the derivative T/p cx along the coexistence l<strong>in</strong>e is<br />
equal to 0.38T c / p c at T=0.875T c . The upper panel of Fig. 9<br />
displays h around the film at t=10 3 , while the lower panel of<br />
v 0 n<br />
p/p c<br />
~<br />
10 3 (T-T w )/T c<br />
0.5<br />
0.3<br />
6<br />
5<br />
4<br />
3<br />
0.563<br />
0.561<br />
0.559<br />
r/L=0.55<br />
0 0.04 0.08 0.12<br />
z/H<br />
0.557<br />
0 0.04 0.08 0.12<br />
z / H<br />
FIG. 7. Density top, temperature middle, <strong>and</strong> normal pressure<br />
bottom as functions of the distance z from the substrate at<br />
r/L=0.125 left <strong>and</strong> at r/L=0.55 right at t=210 3 , where T w<br />
=0.870T c T 0 <strong>and</strong> =0.2. The former path passes through the<br />
droplet body, while the latter passes through the film edge. The<br />
temperature peak is at r/L=0.59. Temperature variations are much<br />
smaller around the droplet body than around the film. The black dot<br />
on each curve <strong>in</strong>dicates the <strong>in</strong>terface position determ<strong>in</strong>ed by<br />
Eq. 4.2.<br />
0.876 T/<br />
Tc<br />
0.874<br />
0.872<br />
0.87<br />
0.868<br />
0<br />
0.2 0.4 0.6<br />
0.8<br />
r/L 1 -0.2<br />
z/H<br />
Fig. 9 gives h along the surface z=z <strong>in</strong>t at four times for <br />
=0.2 <strong>and</strong> 0.002. This quantity represents the distance from<br />
the coexistence l<strong>in</strong>e p= p cx T <strong>in</strong> the p-T phase diagram. In<br />
the bulk region, h is negative <strong>in</strong> stable liquid <strong>and</strong> metastable<br />
gas, while h is positive <strong>in</strong> stable gas <strong>and</strong> metastable liquid.<br />
We can see that h nearly vanishes <strong>in</strong> the droplet body <strong>in</strong> the<br />
region rr th <strong>and</strong> <strong>in</strong>creases <strong>in</strong> the film r th rr e t, but h<br />
rema<strong>in</strong>s less than 10 −2 even at the edge. Note that the<br />
Laplace pressure contribution to h is T/p cx 2/T c R,<br />
which is of order 0.01 <strong>in</strong> the droplet body rr th at t=10 3 .<br />
C. Condensation rate <strong>and</strong> gas velocity<br />
In our previous simulation 28, <strong>evaporation</strong> of a thick<br />
liquid droplet mostly takes place <strong>in</strong> the vic<strong>in</strong>ity of the contact<br />
0<br />
t=2000<br />
Λ=0.2<br />
FIG. 8. Color onl<strong>in</strong>e Temperature T around a film edge <strong>in</strong> the<br />
fluid z0 red <strong>and</strong> <strong>in</strong> the solid z0 black <strong>in</strong> the r-z plane at t<br />
=210 3 0, where T w =0.870T c <strong>and</strong> =0.2. A peak is at<br />
r/L,z/H=0.59,0.035. See Fig. 4 for the hot spot at t=10 3 <strong>in</strong><br />
color <strong>in</strong> the same run.<br />
z / H<br />
8<br />
4<br />
0<br />
-4<br />
-8<br />
0.2<br />
0.1<br />
(a)<br />
3<br />
10 h<br />
r/L<br />
(b) 10 3 (T-T<br />
0)/Tc<br />
(b) (b)<br />
1<br />
2<br />
1<br />
2<br />
3<br />
4<br />
0.2<br />
t =1000<br />
0<br />
0 0.1 0.2 0.3 0.4 0.5<br />
Λ=0.2<br />
PHYSICAL REVIEW E 82, 021603 2010<br />
(a) (a) (a) (a)<br />
2 3<br />
1<br />
4<br />
(b)<br />
3<br />
(b)<br />
4<br />
t=1000<br />
t=2000<br />
t=3000<br />
t=4000<br />
0 0.2 0.4 0.6 0.8<br />
r / L<br />
h<br />
0.4<br />
-0.006 0<br />
0.012<br />
FIG. 9. Color onl<strong>in</strong>e Top: distance from the coexistence l<strong>in</strong>e h<br />
<strong>in</strong> Eq. 4.6 at t=10 3 <strong>in</strong> color, which is negative <strong>in</strong> the droplet body<br />
<strong>and</strong> is positive <strong>in</strong> the film <strong>and</strong> <strong>in</strong> the gas. Here, T w =0.870T c <strong>and</strong><br />
=0.2. Bottom: a h <strong>and</strong> b T−T 0 /T c along the <strong>in</strong>terface at t<br />
=k10 3 <strong>with</strong> k=1, 2, 3, <strong>and</strong> 4. For rr th , h is much smaller than<br />
T 0 −T/T c , where local equilibrium holds. For rr th =0.26L, h<br />
<strong>in</strong>creases up to 410 −3 <strong>with</strong> <strong>in</strong>creas<strong>in</strong>g r.<br />
021603-8
SPREADING WITH EVAPORATION AND CONDENSATION …<br />
PHYSICAL REVIEW E 82, 021603 2010<br />
J<br />
10 4<br />
15<br />
10<br />
5<br />
0<br />
(a)<br />
(b)<br />
Λ=0.2<br />
Λ=0.002<br />
t=1000<br />
t=2000<br />
t=3000<br />
(a)<br />
(b)<br />
(a)<br />
(b)<br />
(a) (b)<br />
velocity v g <strong>and</strong> the gas density n g around the edge, we estimate<br />
W film t as<br />
W film t2r e n g v g c ,<br />
4.11<br />
where c is the width of the <strong>condensation</strong> area estimated to<br />
be about 30.<br />
We <strong>in</strong>troduce the number flux from the droplet body to<br />
the film at r=r th by<br />
-5<br />
0 0.2 0.4 0.6 0.8<br />
r = rth<br />
r/L<br />
FIG. 10. Color onl<strong>in</strong>e Flux Jr,t on the <strong>in</strong>terface <strong>in</strong> units of<br />
/v 0 0 vs r/L <strong>in</strong> the region 0rr e t at t=10 3 left, 210 3<br />
middle, <strong>and</strong> 310 3 right for T w =0.870T c <strong>in</strong> the two cases of<br />
=0.002 <strong>and</strong> 0.2. A precursor film is on the left of the arrow. In its<br />
positive region J is the <strong>condensation</strong> rate. In its negative region J<br />
is the <strong>evaporation</strong> rate.<br />
l<strong>in</strong>e <strong>in</strong> the partial wett<strong>in</strong>g condition. Here, we exam<strong>in</strong>e the<br />
space dependence of the <strong>condensation</strong> rate of a th<strong>in</strong> film <strong>in</strong><br />
the complete wett<strong>in</strong>g condition.<br />
We <strong>in</strong>troduce the number flux Jr,t from gas to liquid<br />
along ˆ =n −1 n through the <strong>in</strong>terface,<br />
Jr,t = nv − v <strong>in</strong>t · ˆ ,<br />
4.7<br />
where v <strong>in</strong>t is the <strong>in</strong>terface velocity. If J is regarded as a<br />
function of the coord<strong>in</strong>ate along the normal direction ˆ ,itis<br />
cont<strong>in</strong>uous through the <strong>in</strong>terface from the number conservation,<br />
while n <strong>and</strong> v·ˆ change discont<strong>in</strong>uously. Thus, we may<br />
well determ<strong>in</strong>e J on the <strong>in</strong>terface. For J0, it represents the<br />
local <strong>condensation</strong> rate. For J0, J represents the local<br />
<strong>evaporation</strong> rate. In Fig. 10, we plot Jr,t vs r/L <strong>in</strong> the<br />
region 0rr e t at three times for =0.002 <strong>and</strong> 0.2 <strong>in</strong> the<br />
cooled case T w =0.870T c . We recognize that Jr,t steeply<br />
<strong>in</strong>creases <strong>in</strong> the precursor film <strong>and</strong> is maximum at the edge.<br />
Moreover, it becomes negative <strong>in</strong> the body part rr th at t<br />
=310 3 , where <strong>evaporation</strong> occurs.<br />
The total <strong>condensation</strong> rate W tot t is the surface <strong>in</strong>tegral<br />
of Jr,t on all the surface. The surface area <strong>in</strong> the range<br />
r,r+dr is da=2drr/s<strong>in</strong> , where is the angle between ˆ<br />
<strong>and</strong> the r axis. Thus,<br />
r e t<br />
W tot t drrJr,t/s<strong>in</strong> . 4.8<br />
=20<br />
The particle number <strong>in</strong> the liquid region N t <strong>in</strong> Eq. 4.1<br />
<strong>in</strong>creases <strong>in</strong> time as<br />
d<br />
dt N t = W tot t.<br />
4.9<br />
We also def<strong>in</strong>e the <strong>condensation</strong> rate <strong>in</strong> the film region,<br />
r e t<br />
W film t drrJr,t/s<strong>in</strong> , 4.10<br />
=2r th<br />
where s<strong>in</strong> 1. In this <strong>in</strong>tegral the vic<strong>in</strong>ity of the edge gives<br />
rise to a ma<strong>in</strong> contribution. In fact, the contribution from the<br />
region r e −16rr e is about 50% of the total contribution<br />
from the region r th rr e . Therefore, <strong>in</strong> terms of the gas<br />
J flow t =2r th0z th<br />
dznrth ,z,tv r r th ,z,t, 4.12<br />
where v r r,z,t=v x x/r+v y y/r is the velocity <strong>in</strong> the plane<br />
<strong>with</strong><strong>in</strong> the film. In terms of the average density <strong>in</strong> the film n¯<br />
<strong>and</strong> the average fluid velocity v¯ at r=r th , we estimate<br />
J flow t2r th n¯v¯.<br />
More generally, we may <strong>in</strong>troduce the flux<br />
4.13<br />
J f r,t =2r0z th<br />
dznr,z,tvr r,z,t, 4.14<br />
for rr th <strong>with</strong> z th be<strong>in</strong>g the film thickness f . In the presence<br />
of <strong>condensation</strong> onto the film, J f r,t <strong>in</strong>creases from<br />
J f r th ,t=J flow t at r=r th <strong>with</strong> <strong>in</strong>creas<strong>in</strong>g r <strong>and</strong> reaches its<br />
maximum J f r e t,t at r=r e t. For =0.2, the ratio<br />
J f (r e t,t)/J f r th ,t was 1.1 at t=10 3 <strong>and</strong> 2.4 at t=410 3 .<br />
We consider the particle number <strong>in</strong> the droplet body N b t<br />
<strong>and</strong> that <strong>in</strong> the precursor film N film t. Here, N b t is the <strong>in</strong>tegral<br />
of 2rJr,t/s<strong>in</strong> <strong>in</strong> the region rr th <strong>and</strong> N film t <strong>in</strong><br />
the region r th rr e . Their sum N t=N b t+N film t <strong>in</strong> Eq.<br />
4.8 has been calculated <strong>in</strong> Fig. 2. In terms of W tot t,<br />
W film t, <strong>and</strong> J flow t, they change <strong>in</strong> time as<br />
d<br />
dt N bt = W tot t − W film t − J flow t,<br />
d<br />
dt N filmt = W film t + J flow t.<br />
Us<strong>in</strong>g the edge velocity ṙ e =dr e /dt, we also obta<strong>in</strong><br />
4.15<br />
4.16<br />
d<br />
dt N filmt =2r e ṙ e n¯ f ,<br />
4.17<br />
s<strong>in</strong>ce the film thickness is fixed <strong>in</strong> our case.<br />
In Fig. 11, we plot W tot t, W film t, <strong>and</strong> J flow t vs t for<br />
=0.002 <strong>and</strong> 0.2. In an early stage t1.510 3 for <br />
=0.002 <strong>and</strong> t2.610 3 for =0.2, W tot t is larger than<br />
W film t <strong>and</strong> <strong>condensation</strong> occurs on all the <strong>in</strong>terfaces. Afterward,<br />
the reverse relation W tot tW film t holds, where<br />
<strong>evaporation</strong> weakly occurs <strong>in</strong> the droplet body rr th . Moreover,<br />
W film t exceeds J flow t for t10 3 for these two values<br />
of . Therefore, <strong>condensation</strong> near the film edge is the ma<strong>in</strong><br />
mechanism of the precursor film growth except <strong>in</strong> the early<br />
stage see the discussion below Eq. 4.10, as speculated by<br />
Hardy 1,2. In pass<strong>in</strong>g, let us estimate W film t <strong>and</strong> J flow t<br />
us<strong>in</strong>g Eqs. 4.11 <strong>and</strong> 4.13. For example, at t=10 3 or 4<br />
10 3 <strong>in</strong> the case =0.2, the edge velocity is ṙ e =0.04 or<br />
0.012, the gas velocity near the edge is v g =0.012 or<br />
021603-9
RYOHEI TESHIGAWARA AND AKIRA ONUKI<br />
30<br />
20<br />
Λ=0.002<br />
0.0064, <strong>and</strong> the fluid velocity at r=r th is v¯=0.015 or<br />
0.005. These values then yield W film tJ flow t13 at t<br />
=10 3 <strong>and</strong> W film t3J flow t10 at t=410 3 , <strong>in</strong> agreement<br />
<strong>with</strong> their curves <strong>in</strong> the right panel of Fig. 11.<br />
In the left panel of Fig. 12, we plot the particle number <strong>in</strong><br />
r<br />
the droplet body N b t=2 th 0 drrJr,t/s<strong>in</strong> for =0.2 <strong>in</strong><br />
the cooled case. Here, the upper bound r th is longer than the<br />
real droplet radius on the substrate at short times t200.<br />
Because of this def<strong>in</strong>ition, a small peak of N b t arises at t<br />
200 <strong>in</strong> Fig. 12. We confirmed that the numerical N b t is<br />
consistent <strong>with</strong> the time <strong>in</strong>tegration of Eq. 4.15,<br />
N b t − N b 0 = S body t − S flow t. 4.18<br />
In the right-h<strong>and</strong> side, the first term is the <strong>in</strong>crease <strong>in</strong> the<br />
particle number due to <strong>condensation</strong> <strong>and</strong> <strong>evaporation</strong> expressed<br />
<strong>in</strong> the time <strong>in</strong>tegral<br />
t<br />
S body t dtW tot t − W film t. 4.19<br />
=0<br />
The m<strong>in</strong>ims of the second term is the decrease <strong>in</strong> the particle<br />
number due to flow from the body <strong>in</strong>to the film,<br />
t<br />
Λ=0.2<br />
10<br />
10 W tot<br />
W film<br />
W tot<br />
W film<br />
J flow<br />
J flow<br />
0<br />
0.3 1 3 5<br />
0<br />
7 0.33 1 3 5 7<br />
10 -3 t 10 -3 t<br />
FIG. 11. Color onl<strong>in</strong>e Total <strong>condensation</strong> rate W tot t green,<br />
<strong>condensation</strong> rate onto the film W film t red, <strong>and</strong> flow from the<br />
droplet body to the film J flow t blue <strong>in</strong> units of 3 /v 0 0 as functions<br />
of time. The time ranges are 310 2 ,710 3 for =0.002<br />
left <strong>and</strong> 3.310 2 ,710 3 for =0.2 right.<br />
S flow t dtJ flow t. 4.20<br />
=0<br />
In the right panel of Fig. 12, S body t <strong>and</strong> S flow t are displayed<br />
for =0.2 <strong>in</strong> the cooled case. We notice that S flow t<br />
N (t) /N (0)<br />
b<br />
b<br />
1<br />
0.8<br />
0.6<br />
0.4<br />
0.2<br />
0<br />
-3<br />
10 t<br />
Λ=0.2<br />
2 4 6 8<br />
20<br />
4<br />
3<br />
2<br />
1<br />
0<br />
Λ=0.2<br />
10 -4 S flow<br />
10 -4 S body<br />
-0.6<br />
0.36 2 4 6 8<br />
-3<br />
10 t<br />
FIG. 12. Color onl<strong>in</strong>e Left: particle number <strong>in</strong> the droplet body<br />
N b t vs time t obey<strong>in</strong>g Eq. 4.18. Right: S body t <strong>in</strong> Eq. 4.19<br />
green <strong>and</strong> S flow t <strong>in</strong> Eq. 4.20 vs time t red. S body t is considerably<br />
smaller than S flow t <strong>and</strong> its sign is changed at t=610 3 .<br />
PHYSICAL REVIEW E 82, 021603 2010<br />
is considerably larger than S body t <strong>and</strong> the droplet body<br />
shr<strong>in</strong>ks ma<strong>in</strong>ly due to the flow from the body to the film,<br />
lead<strong>in</strong>g to N b 0−N b tS flow t. S<strong>in</strong>ce S body t changes its<br />
sign, <strong>condensation</strong> dom<strong>in</strong>ates <strong>evaporation</strong> for t610 3 <strong>and</strong><br />
vice versa at later times on the droplet body shr<strong>in</strong>kage.<br />
We f<strong>in</strong>ally derive an approximate expression for the gas<br />
velocity v g near the edge. The heat flux is of order T p<br />
−T w / f there, where T p is the peak temperature <strong>and</strong> is the<br />
liquid thermal conductivity. It balances <strong>with</strong> the convective<br />
latent heat flux n g T 0 sv g <strong>in</strong> the gas, where n g is the gas<br />
density <strong>and</strong> s is the entropy difference per particle. Therefore,<br />
v g T p − T w / f n g T 0 sT p − T w n¯ 0 /T 0 n g f ,<br />
4.21<br />
where we set =k B 0 n¯ <strong>and</strong> s =2.1k B here <strong>in</strong> the second<br />
l<strong>in</strong>e. Let us check the validity of the above estimate <strong>in</strong> our<br />
simulation. i In the upper plate of Fig. 4 at t=10 3 we have<br />
v g =0.014, while the second l<strong>in</strong>e of Eq. 4.21 becomes a<br />
close value of 0.012 <strong>with</strong> f /5 <strong>and</strong> n¯/n g 5. ii From<br />
Eq. 4.21 the comb<strong>in</strong>ation v g /T p −T w should be a constant<br />
<strong>in</strong>dependent of time. In the cooled case T w =0.870T c <strong>with</strong><br />
=0.2, our data yield v g T c /T p −T w =2.48, 1.49, 1.64, <strong>and</strong><br />
1.60 for t=200, 10 3 ,210 3 , <strong>and</strong> 410 3 , respectively, so it<br />
is roughly equal to 1.6 <strong>in</strong> the late stage.<br />
V. SPREADING AND EVAPORATION ON A HEATED<br />
SUBSTRATE<br />
For =0.2, we next present simulation results of a heated<br />
liquid droplet <strong>in</strong> the complete wett<strong>in</strong>g condition, where T w is<br />
<strong>in</strong>creased above T 0 =0.875T c at t=0. The other parameter<br />
values are the same as those <strong>in</strong> the previous section. The<br />
preparation method of a droplet is unchanged. Then a precursor<br />
film develops <strong>in</strong> an early stage at least for small T w<br />
−T 0 because of the complete wett<strong>in</strong>g condition at 1<br />
=0.061 see Eq. 3.5. A new aspect is that <strong>evaporation</strong><br />
dom<strong>in</strong>ates over <strong>condensation</strong> <strong>with</strong> <strong>in</strong>creas<strong>in</strong>g T w −T 0 0.<br />
The experiment by Guéna et al. 22 corresponds to this<br />
situation see Sec. I.<br />
The <strong>evaporation</strong> rate −J for negative J from our simulation<br />
is very different from the phenomenological <strong>one</strong><br />
r e t 2 −r 2 −1/2 24–26 as <strong>in</strong> Figs. 14 <strong>and</strong> 15 below. Also<br />
see Sec. I <strong>and</strong> Ref. 35 for this aspect.<br />
A. Time evolution<br />
In Fig. 13, we show the edge position r e t <strong>and</strong> the particle<br />
number <strong>in</strong> the liquid N t as functions of t for three<br />
cases T w =0.8855T c Fig. 13a, T w =0.888T c Fig. 13b,<br />
<strong>and</strong> T w =0.890T c Fig. 13c. First, Fig. 13a is a special<br />
case, where the overall balance between <strong>condensation</strong> <strong>and</strong><br />
<strong>evaporation</strong> is achieved at long times. That is, <strong>in</strong> Fig. 13a,<br />
r e t <strong>and</strong> N t tend to constants at long times <strong>and</strong> a steady<br />
th<strong>in</strong> pancakelike film is realized <strong>with</strong> radius 0.5L <strong>and</strong><br />
thickness 4. Second, for higher T w , <strong>evaporation</strong> dom<strong>in</strong>ates<br />
over <strong>condensation</strong> <strong>and</strong> the liquid region eventually disappears<br />
at some time t 0 . In other words, if T w −T 0 exceeds a<br />
critical value =0.0105T c here, a liquid droplet has a f<strong>in</strong>ite<br />
021603-10
SPREADING WITH EVAPORATION AND CONDENSATION …<br />
PHYSICAL REVIEW E 82, 021603 2010<br />
r c /L<br />
r c /L<br />
r c /L<br />
0.5<br />
0.4<br />
0.3<br />
0.2<br />
(a) T w =0.8855T c<br />
0 1 2 3<br />
10 -4<br />
0.4<br />
0.3<br />
0.2<br />
0.1<br />
0<br />
0 2 4 6 8 10<br />
0.4<br />
0.3<br />
0.2<br />
0.1<br />
0<br />
(b) T w =0.888T c<br />
10 -4 t<br />
0 2 4 6 8 10 12<br />
t<br />
(c) T w =0.890T c<br />
N (t) /N (0)<br />
N (t) /N (0)<br />
N (t) /N (0)<br />
0<br />
0 2 4 6 8 10<br />
lifetime t 0 even <strong>in</strong> the complete wett<strong>in</strong>g condition. The lifetime<br />
t 0 grows strongly as T 0 −T w approaches the critical<br />
value. In our examples, t 0 =1.0710 5 for T w −T 0 =0.018T c <strong>in</strong><br />
Fig. 13b, while t 0 =1.1210 4 for T w −T 0 =0.020T c <strong>in</strong> Fig.<br />
13c.Ast approaches t 0 , r e t may be fitted to the power-law<br />
form<br />
r e tt 0 − t c ,<br />
5.1<br />
where c0.30 <strong>in</strong> Fig. 13b <strong>and</strong> c0.43 <strong>in</strong> Fig. 13c. Inour<br />
previous simulation of droplet <strong>evaporation</strong> <strong>in</strong> the partial wett<strong>in</strong>g<br />
condition 28, this behavior was obta<strong>in</strong>ed <strong>with</strong> c<br />
=0.42. In experiments 22,24–27, macroscopic droplets<br />
evaporated <strong>in</strong> air obey<strong>in</strong>g the power law <strong>with</strong> the classical<br />
exp<strong>one</strong>nt c=0.5.<br />
B. Evaporation rate <strong>and</strong> temperature profile<br />
In Fig. 14, we show the mass flux through the <strong>in</strong>terface<br />
Jr,t def<strong>in</strong>ed <strong>in</strong> Eq. 4.7 <strong>in</strong> the weakly heated case a T w<br />
=0.8855T c . Its negativity implies <strong>evaporation</strong>. In the region<br />
far from the edge, <strong>evaporation</strong> is marked <strong>in</strong> transient states<br />
t410 3 , but it tends to vanish at long times. We can also<br />
see the region of positive J <strong>with</strong> width of order 10 near the<br />
edge r e −10rr e , where the film is still flat <strong>and</strong> the angle<br />
1<br />
0.9<br />
0.8<br />
0.7 (a) T w =0.8855T c<br />
0 1 2 3<br />
1<br />
0.8<br />
0.6<br />
0.4<br />
0.2<br />
1<br />
0.8<br />
0.6<br />
0.4<br />
0.2<br />
10 -4 t<br />
(b) T w =0.888T c<br />
10 -4 t<br />
(c) T w =0.890T c<br />
0<br />
0 2 4 6 8 10<br />
10 -3 t 10 -3 t<br />
FIG. 13. Time evolutions of the edge position r e t divided by L<br />
left <strong>and</strong> the particle number <strong>in</strong> the droplet N t divided by N 0<br />
right for =0.2. The temperature T w at the solid bottom was<br />
raised at t=0 from 0.875T c to a 0.8855T c top, b 0.888T c<br />
middle, <strong>and</strong> c 0.890T c bottom. The fluid tends to a steady<br />
two-phase state <strong>in</strong> a, where the liquid region assumes a pancake<br />
th<strong>in</strong> film. The liquid evaporates to vanish on a time scale of 10 5 <strong>in</strong><br />
b <strong>and</strong> 10 4 <strong>in</strong> c.<br />
J<br />
10 4<br />
5<br />
0<br />
-5<br />
-10<br />
-15<br />
20000<br />
5000<br />
4000<br />
3000<br />
t=2000<br />
(a) T w =0.8855T c<br />
-20 0 0.1 0.2 0.3 0.4 0.5<br />
r/L<br />
0<br />
t=20000<br />
0.4 0.5 0.6<br />
<strong>in</strong> Eq. 4.8 is nearly /2. In Fig. 14, however, we do not<br />
show J just at the edge rr e t <strong>and</strong> 0z f , where <br />
changes from /2 to zero <strong>in</strong> the z direction <strong>and</strong> <strong>evaporation</strong><br />
occurs J0. As a balance of <strong>condensation</strong> <strong>and</strong> <strong>evaporation</strong><br />
<strong>in</strong> these two regions, the total <strong>condensation</strong> rate W tot <strong>in</strong> Eq.<br />
4.8 tends to vanish at long times, while there is no velocity<br />
field <strong>in</strong> the region rr e −10. In the <strong>in</strong>set of Fig. 14, the<br />
velocity field around the edge is displayed at t=210 3 ,<br />
where the maximum gas velocity is v g =1.110 −3 / 0 .<br />
In Fig. 15, we show Jr,t at several times <strong>in</strong> the highest<br />
heat<strong>in</strong>g case c T w =0.890T c . In the whole surface, J is negative<br />
<strong>and</strong> <strong>evaporation</strong> is tak<strong>in</strong>g place. For t410 4 <strong>evaporation</strong><br />
is strongest at the film center, <strong>in</strong> sharp contrast to the<br />
case of a thick evaporat<strong>in</strong>g droplet 28. At long times t<br />
=810 3 here, however, it becomes weakest at the film center.<br />
Figure 16 is produced by the same run. It gives a bird’s<br />
eye view of the temperature <strong>in</strong> the upper panel <strong>and</strong> a snap-<br />
z/H<br />
0.2<br />
0.1<br />
0.8825 0.8855<br />
T/T c<br />
FIG. 14. Color onl<strong>in</strong>e Mass flux Jr,t through the <strong>in</strong>terface <strong>in</strong><br />
Eq. 4.6 for the weakly heated case T w =0.8855T c correspond<strong>in</strong>g to<br />
a <strong>in</strong> Fig. 13. Evaporation takes place <strong>in</strong> the region J0 except<br />
close to the edge. Here, J decreases <strong>in</strong> time. A steady two-phase<br />
state is approached at long times, where J is nonvanish<strong>in</strong>g only near<br />
the edge. Inset: temperature <strong>in</strong> color <strong>and</strong> velocity represented by<br />
arrows at t=210 4 .<br />
J<br />
10 3<br />
0<br />
-1<br />
-2<br />
8000<br />
4000<br />
3500<br />
3000<br />
Z<br />
(c) T w =0.890T c<br />
2000<br />
t=3000<br />
t=1000<br />
0 r<br />
L<br />
0 0.1 0.2<br />
0.3<br />
r/L<br />
FIG. 15. Color onl<strong>in</strong>e Mass flux through the <strong>in</strong>terface Jr,t <strong>in</strong><br />
Eq. 4.7 for the highest heat<strong>in</strong>g case T w =0.890T c correspond<strong>in</strong>g to<br />
c <strong>in</strong> Fig. 13. Here, <strong>evaporation</strong> takes place over the whole surface<br />
<strong>and</strong> the liquid disappears at t=1.110 4 . The <strong>in</strong>set displays the film<br />
shape at t=310 3 , where N t is half of the <strong>in</strong>itial value.<br />
021603-11
RYOHEI TESHIGAWARA AND AKIRA ONUKI<br />
T/T c<br />
z/H<br />
0.2<br />
0.1<br />
0.888<br />
0.884<br />
0.880<br />
0.876<br />
0.4<br />
0.3<br />
0.2<br />
0.1<br />
r/L<br />
t=1000<br />
Λ=0.2<br />
(c)<br />
T w = 0.890 T c<br />
0<br />
0<br />
-0.05<br />
0 0.1 0.2 0.3<br />
0.4<br />
r/L T/<br />
T c<br />
0.876<br />
0.890<br />
shot of the velocity field <strong>in</strong> the vic<strong>in</strong>ity of the film edge at<br />
t=10 3 <strong>in</strong> the lower panel. A similar bird’s eye view of the<br />
temperature was presented for a thick evaporat<strong>in</strong>g droplet<br />
28. Remarkably, we can see a very steep temperature gradient<br />
<strong>with</strong><strong>in</strong> the film, which is much larger than <strong>in</strong> the gas,<br />
lead<strong>in</strong>g to a strong heat flux from the solid to the film. In this<br />
manner, <strong>evaporation</strong> is <strong>in</strong>duced all over the surface <strong>and</strong> is<br />
strongest at the film center <strong>in</strong> the early stage. It is remarkable<br />
that the temperature gradient nearly vanishes <strong>in</strong> the gas region<br />
above the film away from the edge, where heat is transported<br />
by a gas flow. We also notice a significant temperature<br />
<strong>in</strong>homogeneity <strong>in</strong> the solid part <strong>in</strong> contact <strong>with</strong> the film.<br />
VI. SUMMARY AND REMARKS<br />
t=1000<br />
Λ=0.2<br />
For <strong>one</strong>-comp<strong>one</strong>nt fluids we have exam<strong>in</strong>ed spread<strong>in</strong>g of<br />
a small droplet on a smooth substrate <strong>in</strong> the complete wett<strong>in</strong>g<br />
condition <strong>in</strong> the axisymmetric geometry. In the dynamic van<br />
der Waals theory 48,49, we have <strong>in</strong>tegrated the entropy<br />
equation <strong>in</strong> Eq. 2.16 together <strong>with</strong> the cont<strong>in</strong>uity <strong>and</strong> momentum<br />
equations. On the boundary walls, the velocity vanishes<br />
<strong>and</strong> the density derivative <strong>in</strong> the normal direction is a<br />
constant as <strong>in</strong> Eq. 3.5. This method may remove artificial<br />
flows around an <strong>in</strong>terface 59. In our phase field scheme, we<br />
need not <strong>in</strong>troduce any <strong>in</strong>terface boundary conditions. The<br />
<strong>condensation</strong> rate on the <strong>in</strong>terface is a result <strong>and</strong> not a prerequisite<br />
of the calculation. We have also assumed that the<br />
substrate wall has a f<strong>in</strong>ite thickness H w <strong>and</strong> the solid temperature<br />
obeys the thermal diffusion equation, whereas an<br />
isothermal substrate is usually assumed <strong>in</strong> the literature. The<br />
temperature T w at the solid bottom z=−H w is a new control<br />
0.6<br />
0.4<br />
0.2<br />
z/H<br />
FIG. 16. Color onl<strong>in</strong>e Top: temperature T <strong>in</strong> the region 0<br />
r/L0.4 <strong>and</strong> −0.1z/H0.7 at t=10 3 <strong>in</strong> the highest heat<strong>in</strong>g<br />
T w =0.890T c correspond<strong>in</strong>g to c <strong>in</strong> Fig. 13. Bottom: temperature <strong>in</strong><br />
color <strong>and</strong> velocity by arrows at the same time <strong>in</strong> the same run. A<br />
liquid film supports a large temperature gradient <strong>and</strong> <strong>evaporation</strong><br />
occurs all over the surface, while the temperature above the film is<br />
nearly flat due to a gas flow. The maximum gas velocity is v g<br />
=0.024.<br />
0<br />
-0.1<br />
PHYSICAL REVIEW E 82, 021603 2010<br />
parameter <strong>in</strong> our simulation. Cool<strong>in</strong>g heat<strong>in</strong>g the fluid is<br />
realized by sett<strong>in</strong>g T w lower higher than the <strong>in</strong>itial fluid<br />
temperature T 0 . We give salient results <strong>in</strong> our simulation.<br />
i In the cooled <strong>and</strong> noncooled cases <strong>with</strong> T w T 0 ,a<br />
precursor film <strong>with</strong> a constant thickness has appeared ahead<br />
of the droplet body. Here, the volume of the liquid region has<br />
<strong>in</strong>creased <strong>in</strong> time due to <strong>condensation</strong> on the film as <strong>in</strong> Fig.<br />
2, while that of the droplet body has decreased <strong>in</strong> time<br />
ma<strong>in</strong>ly due to flow from the body <strong>in</strong>to the film as <strong>in</strong> Fig. 12.<br />
In a very early stage, the piston effect comes <strong>in</strong>to play due to<br />
sound propagation 61,62. At long times, the <strong>condensation</strong><br />
rate has become localized near the film edge <strong>and</strong> the film has<br />
exp<strong>and</strong>ed due to <strong>condensation</strong>. As a result, a hot spot has<br />
appeared near the film edge because of the latent heat released.<br />
ii At a critical value of T w slightly higher than T 0 ,we<br />
have realized a steady-state th<strong>in</strong> liquid film, where <strong>condensation</strong><br />
<strong>and</strong> <strong>evaporation</strong> are localized <strong>and</strong> balanced at the<br />
edge. For higher T w , <strong>evaporation</strong> has dom<strong>in</strong>ated <strong>and</strong> the liquid<br />
region has disappeared eventually. This lifetime decreases<br />
<strong>with</strong> <strong>in</strong>creas<strong>in</strong>g T w −T 0 . For a th<strong>in</strong> film, <strong>evaporation</strong><br />
has appeared all over the film surface upon heat<strong>in</strong>g. In our<br />
previous simulation for <strong>one</strong>-comp<strong>one</strong>nt fluids 28, onthe<br />
other h<strong>and</strong>, <strong>evaporation</strong> of a thick droplet was mostly localized<br />
near the contact l<strong>in</strong>e <strong>in</strong> the partial wett<strong>in</strong>g condition.<br />
We give some critical remarks. 1 Our results cannot be<br />
directly compared <strong>with</strong> most of the previous experimental<br />
results on large <strong>in</strong>volatile droplets such as Tanner’s law. For<br />
our small droplet, the volume of the precursor film has exceeded<br />
the <strong>in</strong>itial droplet volume <strong>in</strong> relatively short times <br />
10 3 0 . We propose future experiments us<strong>in</strong>g volatile fluids<br />
to <strong>in</strong>vestigate a hot spot, for example. 2 If the mesh length<br />
x=/2 is a few Å, our system length is on the order of<br />
several ten manometers <strong>and</strong> the particle number treated is of<br />
order 10 6 see Sec. III C. Our cont<strong>in</strong>uum description should<br />
be imprecise on the angstrom scale. Thus, exam<strong>in</strong>ation of<br />
our results by large-scale molecular-dynamics simulations<br />
should be <strong>in</strong>formative. We should also <strong>in</strong>vestigate how our<br />
numerical results can be used or modified for much larger<br />
droplet sizes. 3 In future work, we should exam<strong>in</strong>e the role<br />
of the long-range van der Waals <strong>in</strong>teraction <strong>in</strong> the wett<strong>in</strong>g<br />
dynamics. As is well known, it crucially <strong>in</strong>fluences the film<br />
thickness 1. 4 We should also <strong>in</strong>clude the slip effect at the<br />
contact l<strong>in</strong>e <strong>in</strong> our scheme 57,58. 5 We should study the<br />
two-phase hydrodynamics <strong>in</strong> fluid mixtures, where a Marangoni<br />
flow decisively governs the dynamics even at small<br />
solute concentrations 25,29,34.<br />
ACKNOWLEDGMENTS<br />
We would like to thank Professor T. Qian for valuable<br />
discussions. This work was supported by Grants-<strong>in</strong>-Aid for<br />
scientific research on Priority Area “Soft Matter Physics”<br />
<strong>and</strong> the Global COE program “The Next Generation of Physics,<br />
Spun from Universality <strong>and</strong> Emergence” of Kyoto University<br />
from the M<strong>in</strong>istry of Education, Culture, Sports, Science<br />
<strong>and</strong> Technology of Japan. R.T. was supported by the<br />
Japan Society for Promotion of Science.<br />
021603-12
SPREADING WITH EVAPORATION AND CONDENSATION …<br />
APPENDIX: EQUILIBRIUM TWO-PHASE COEXISTENCE<br />
First we consider a planar <strong>in</strong>terface at z=0 separat<strong>in</strong>g gas<br />
<strong>and</strong> liquid <strong>in</strong> equilibrium <strong>with</strong> a homogeneous T below T c .<br />
Here, we may start <strong>with</strong> the Helmholtz free energy <strong>in</strong> Eq.<br />
2.23 54. All the quantities change along the z axis. From<br />
the homogeneity of the generalized chemical ˆ <strong>in</strong> Eq. 2.3<br />
we obta<strong>in</strong> the equation for the <strong>in</strong>terface density profile n<br />
=n <strong>in</strong> z as<br />
n <strong>in</strong> − CTn <strong>in</strong> = cx ,<br />
A1<br />
where n <strong>in</strong> =d 2 n <strong>in</strong> /dz 2 <strong>and</strong> cx is the equilibrium chemical potential<br />
<strong>in</strong> two-phase coexistence. We assume that n g =n <strong>in</strong> <br />
is the gas density <strong>and</strong> n =n <strong>in</strong> − is the liquid density <strong>in</strong><br />
equilibrium. The van der Waals pressure p= p(n <strong>in</strong> z) satisfies<br />
pn <strong>in</strong> − CTn <strong>in</strong> n <strong>in</strong> − n <strong>in</strong> 2 /2 = p cx , A2<br />
where n <strong>in</strong> =dn <strong>in</strong> /dz <strong>and</strong> p cx is the equilibrium coexistence<br />
pressure. If differentiated <strong>with</strong> respect to z, the left-h<strong>and</strong> side<br />
of Eq. A2 vanishes from Eq. A1, ensur<strong>in</strong>g its homogeneity.<br />
Notice that the left-h<strong>and</strong> side of Eq. A2 is equal to p˜ <strong>in</strong><br />
Eq. 4.5 or the zz comp<strong>one</strong>nt of the stress tensor. The van<br />
der Waals pressure pn <strong>in</strong> itself exhibits a large variation of<br />
order / <strong>in</strong> the <strong>in</strong>terface region. In fact, Eq. A2 gives<br />
dzpn <strong>in</strong> − p cx =−3/2. A3<br />
If use is made of Eq. A1, this relation readily follows from<br />
the usual expressions for the surface tension 54,<br />
= dzf − cx n + p cx + CTn <strong>in</strong> 2 /2 = dzCTn <strong>in</strong> 2 ,<br />
A4<br />
where f =n− p is the Helmholtz free-energy density.<br />
Second, we consider a spherical liquid droplet <strong>with</strong> radius<br />
R <strong>in</strong> gas <strong>in</strong> equilibrium. The radius R is much longer than the<br />
<strong>in</strong>terface thickness . All the quantities depend only on the<br />
distance r from the droplet center. The homogeneity of ˆ<br />
gives the equation of the density nr as<br />
PHYSICAL REVIEW E 82, 021603 2010<br />
n − CTn +2n/r = cx + cx , A5<br />
where n=dn/dr, n=d 2 n/dr 2 , <strong>and</strong> cx is the correction<br />
aris<strong>in</strong>g from the curvature. For large R we set<br />
nr = n <strong>in</strong> r − R + nr,<br />
A6<br />
where nR −1 . We may replace 2n/r <strong>with</strong> 2n/R <strong>in</strong> Eq.<br />
A5. To l<strong>in</strong>ear order <strong>in</strong> the deviations we f<strong>in</strong>d<br />
n <strong>in</strong> − CT d2<br />
dr 2n = 2CT<br />
R n <strong>in</strong> + cx , A7<br />
where n <strong>in</strong> =/n T =1/n 2 K T at n=n <strong>in</strong> <strong>with</strong> K T be<strong>in</strong>g<br />
the compressibility. We multiply Eq. A7 by n <strong>in</strong> <strong>and</strong> <strong>in</strong>tegrate<br />
both h<strong>and</strong> sides <strong>with</strong> respect to r across the <strong>in</strong>terface to<br />
obta<strong>in</strong><br />
cx n = p =−2/R,<br />
A8<br />
where n=n g −n is the density difference. Here, we have<br />
used Eq. A4 <strong>and</strong> the relation n <strong>in</strong> n <strong>in</strong> −CTd 3 n <strong>in</strong> /dz 3 =0.<br />
Thus, we have calculated the pressure difference between the<br />
two phases p <strong>and</strong> the chemical potential deviation cx to<br />
l<strong>in</strong>ear order <strong>in</strong> R −1 . In the bulk gas <strong>and</strong> liquid regions far<br />
from the <strong>in</strong>terface, n tends to n g <strong>in</strong> gas <strong>and</strong> n <strong>in</strong><br />
liquid. From Eq. A7 we obta<strong>in</strong> these bulk density deviations,<br />
n g n g = n n =−2/Rn.<br />
The bulk pressure deviations are<br />
A9<br />
p g =−2n g /Rn, p =−2n /Rn, A10<br />
<strong>in</strong> gas <strong>and</strong> <strong>in</strong> liquid, respectively. The deviation of the normal<br />
pressure p˜ <strong>in</strong> Eq. 4.5 from p cx may also be exp<strong>and</strong>ed <strong>in</strong><br />
powers of R −1 . To l<strong>in</strong>ear order we obta<strong>in</strong><br />
CT p˜ = 2n <strong>in</strong><br />
Rn + 2 R n <strong>in</strong>n <strong>in</strong> − n <strong>in</strong> n + n <strong>in</strong> n. A11<br />
In Fig. 7, the <strong>in</strong>terface variation of p˜ is smaller than that of<br />
p= p− p cx / by <strong>one</strong> order of magnitude.<br />
1 P. G. de Gennes, Rev. Mod. Phys. 57, 827 1985.<br />
2 W. Hardy, Philos. Mag. 38, 491919; see Ref. 1 for comments<br />
on this orig<strong>in</strong>al work.<br />
3 V. E. Dussan, Annu. Rev. Fluid Mech. 11, 371 1979.<br />
4 L. H. Tanner, J. Phys. D 12, 1473 1979.<br />
5 J.-D. Chen, J. Colloid Interface Sci. 122, 601988.<br />
6 G. McHale, M. I. Newton, S. M. Rowan, <strong>and</strong> M. Banerjee, J.<br />
Phys. D 28, 1925 1995; <strong>in</strong> this paper, spread<strong>in</strong>g of a stripe<br />
was studied.<br />
7 L. Leger <strong>and</strong> J. F. Joanny, Rep. Prog. Phys. 55, 431 1992.<br />
8 D. Bonn, J. Eggers, J. Indekeu, J. Meunier, <strong>and</strong> E. Rolley, Rev.<br />
Mod. Phys. 81, 739 2009.<br />
9 L. M. Hock<strong>in</strong>g <strong>and</strong> A. D. Rivers, J. Fluid Mech. 121, 425<br />
1982.<br />
10 D. Ausserré, A. M. Picard, <strong>and</strong> L. Léger, Phys. Rev. Lett. 57,<br />
2671 1986.<br />
11 F. Heslot, A. M. Cazabat, <strong>and</strong> P. Lev<strong>in</strong>son, Phys. Rev. Lett. 62,<br />
1286 1989; F. Heslot, A. M. Cazabat, P. Lev<strong>in</strong>son, <strong>and</strong> N.<br />
Fraysse, ibid. 65, 599 1990.<br />
12 D. Beaglehole, J. Phys. Chem. 93, 893 1989.<br />
13 H. P. Kavehpour, B. Ovryn, <strong>and</strong> G. H. McK<strong>in</strong>ley, Phys. Rev.<br />
Lett. 91, 196104 2003.<br />
14 J.-X. Yang, J. Koplik, <strong>and</strong> J. R. Banavar, Phys. Rev. A 46,<br />
7738 1992.<br />
15 J. A. Niem<strong>in</strong>en, D. B. Abraham, M. Karttunen, <strong>and</strong> K. Kaski,<br />
Phys. Rev. Lett. 69, 124 1992.<br />
16 T. Ala-Nissila, S. Herm<strong>in</strong>ghaus, T. Hjelt, <strong>and</strong> P. Leiderer, Phys.<br />
Rev. Lett. 76, 4003 1996; T. Hjelt, S. Herm<strong>in</strong>ghaus, T. Ala-<br />
Nissila, <strong>and</strong> S. C. Y<strong>in</strong>g, Phys. Rev. E 57, 1864 1998.<br />
17 J. A. Niem<strong>in</strong>en <strong>and</strong> T. Ala-Nissila, Phys. Rev. E 49, 4228<br />
021603-13
RYOHEI TESHIGAWARA AND AKIRA ONUKI<br />
1994; M. Haataja, J. A. Niem<strong>in</strong>en, <strong>and</strong> T. Ala-Nissila, ibid.<br />
52, R2165 1995.<br />
18 J. De Con<strong>in</strong>ck U. D’Ortona, J. Koplik, <strong>and</strong> J. R. Banavar,<br />
Phys. Rev. Lett. 74, 928 1995; U. D’Ortona, J. De Con<strong>in</strong>ck,<br />
J. Koplik, <strong>and</strong> J. R. Banavar, Phys. Rev. E 53, 562 1996.<br />
19 J. Koplik, S. Pal, <strong>and</strong> J. R. Banavar, Phys. Rev. E 65, 021504<br />
2002.<br />
20 A. Milchev <strong>and</strong> K. B<strong>in</strong>der, J. Chem. Phys. 116, 7691 2002;<br />
<strong>in</strong> this paper, Tanner’s law was observed <strong>in</strong> a simulation of<br />
cha<strong>in</strong>like molecules.<br />
21 E. B. Webb III, G. S. Grest, <strong>and</strong> D. R. He<strong>in</strong>e, Phys. Rev. Lett.<br />
91, 236102 2003.<br />
22 G. Guéna, C. Poulard, <strong>and</strong> A. M. Cazabat, J. Colloid Interface<br />
Sci. 312, 164 2007.<br />
23 J. Hegseth, A. Oprisan, Y. Garrabos, V. S. Nikolayev, C.<br />
Lecoutre-Chabot, <strong>and</strong> D. Beysens, Phys. Rev. E 72, 031602<br />
2005.<br />
24 R. D. Deegan, O. Bakaj<strong>in</strong>, T. F. Dupont, G. Huber, S. R. Nagel,<br />
<strong>and</strong> T. A. Witten, Nature London 389, 827 1997.<br />
25 H. Hu <strong>and</strong> R. G. Larson, Langmuir 21, 3963 2005; 21, 3972<br />
2005.<br />
26 N. Shahidzadeh-Bonn, S. Rafai, A. Azouni, <strong>and</strong> D. Bonn, J.<br />
Fluid Mech. 549, 307 2006.<br />
27 H. J. Butt, D. S. Glovko, <strong>and</strong> E. Bonaccurso, J. Phys. Chem. B<br />
111, 5277 2007.<br />
28 R. Teshigawara <strong>and</strong> A. Onuki, EPL 84, 36003 2008.<br />
29 J. Straub, Int. J. Therm. Sci. 39, 490 2000.<br />
30 V. S. Nikolayev, D. A. Beysens, G.-L. Lagier, <strong>and</strong> J. Hegseth,<br />
Int. J. Heat Mass Transfer 44, 3499 2001.<br />
31 C. Höhmann <strong>and</strong> P. Stephan, Exp. Therm. Fluid Sci. 26, 157<br />
2002; <strong>in</strong> this boil<strong>in</strong>g experiment, the substrate temperature<br />
exhibited a sharp drop by 0.2 K near a contact l<strong>in</strong>e <strong>in</strong> a narrow<br />
region of 10 m length.<br />
32 D. Beysens, Y. Garrabos, V. S. Nikolayev, C. Lecoutre-Chabot,<br />
J.-P. Delville, <strong>and</strong> J. Hegseth, EPL 59, 245 2002.<br />
33 A. Onuki <strong>and</strong> K. Kanatani, Phys. Rev. E 72, 066304 2005.<br />
34 A. Onuki, Phys. Rev. E 79, 046311 2009.<br />
35 This phenomenological expression for Jr is not valid <strong>in</strong><br />
<strong>evaporation</strong> <strong>in</strong> <strong>one</strong>-comp<strong>one</strong>nt fluids, where <strong>evaporation</strong> is<br />
much more localized near the contact l<strong>in</strong>e 28. However, <strong>in</strong><br />
the presence of air, the Marangoni effect can <strong>in</strong>duce convection<br />
<strong>in</strong>side the droplet caus<strong>in</strong>g overall <strong>evaporation</strong>. This aspect<br />
should be further studied <strong>in</strong> the future.<br />
36 P. Ehrhard <strong>and</strong> S. H. Davis, J. Fluid Mech. 229, 365 1991;D.<br />
M. Anderson <strong>and</strong> S. H. Davis, Phys. Fluids 7, 248 1995.<br />
37 P. Seppecher, Int. J. Eng. Sci. 34, 977 1996.<br />
38 D. Jasnow <strong>and</strong> J. Viñals, Phys. Fluids 8, 660 1996; R. Chella<br />
<strong>and</strong> J. Viñals, Phys. Rev. E 53, 3832 1996.<br />
39 D. M. Anderson, G. B. McFadden, <strong>and</strong> A. A. Wheeler, Annu.<br />
Rev. Fluid Mech. 30, 139 1998.<br />
40 D. Jacqm<strong>in</strong>, J. Comput. Phys. 155, 961999.<br />
PHYSICAL REVIEW E 82, 021603 2010<br />
41 D. Jamet, O. Lebaigue, N. Coutris, <strong>and</strong> J. M. Delhaye, J. Comput.<br />
Phys. 169, 624 2001.<br />
42 R. Borcia <strong>and</strong> M. Bestehorn, Phys. Rev. E 67, 066307 2003;<br />
75, 056309 2007.<br />
43 T. Araki <strong>and</strong> H. Tanaka, EPL 65, 214 2004.<br />
44 B. J. Palmer <strong>and</strong> D. R. Rector, Phys. Rev. E 61, 5295 2000;<br />
<strong>in</strong> an erratum to 69, 049903E 2004, they po<strong>in</strong>ted out a<br />
difficulty of the lattice Boltzmann algorithm <strong>in</strong> simulations of<br />
<strong>evaporation</strong>.<br />
45 A. J. Briant, A. J. Wagner, <strong>and</strong> J. M. Yeomans, Phys. Rev. E<br />
69, 031602 2004.<br />
46 T. Inamuro, T. Ogata, S. Tajima, <strong>and</strong> N. Konishi, J. Comput.<br />
Phys. 198, 628 2004.<br />
47 C. M. Pooley, O. Kuksenok, <strong>and</strong> A. C. Balazs, Phys. Rev. E<br />
71, 030501R 2005.<br />
48 A. Onuki, Phys. Rev. Lett. 94, 054501 2005.<br />
49 A. Onuki, Phys. Rev. E 75, 036304 2007; <strong>in</strong> this paper, the<br />
energy equation 2.13 was <strong>in</strong>tegrated, result<strong>in</strong>g <strong>in</strong> a parasitic<br />
flow around an <strong>in</strong>terface <strong>in</strong> Figs. 3 <strong>and</strong> 6.<br />
50 N. Takada <strong>and</strong> A. Tomiyama, Int. J. Mod. Phys. C 18, 536<br />
2007.<br />
51 G. Gonnella, A. Lamura, <strong>and</strong> A. Piscitelli, J. Phys. A: Math.<br />
Theor. 41, 105001 2008.<br />
52 A. Kawasaki, J. Onishi, Y. Chen, <strong>and</strong> H. Ohashi, Comput.<br />
Math. Appl. 55, 1492 2008.<br />
53 G. Fang <strong>and</strong> C. A. Ward, Phys. Rev. E 59, 417 1999.<br />
54 A. Onuki, Phase Transition Dynamics Cambridge University<br />
Press, Cambridge, Engl<strong>and</strong>, 2002.<br />
55 L. D. L<strong>and</strong>au <strong>and</strong> E. M. Lifshitz, Fluid Mechanics Pergamon,<br />
New York, 1959.<br />
56 If we set e T =e+v 2 /2 not <strong>in</strong>clud<strong>in</strong>g the potential U, the term<br />
−v·U appears <strong>in</strong> the right-h<strong>and</strong> side of Eq. 2.13 49.<br />
57 J. Koplik, J. R. Banavar, <strong>and</strong> J. F. Willemsen, Phys. Rev. Lett.<br />
60, 1282 1988; P. A. Thompson <strong>and</strong> M. O. Robb<strong>in</strong>s, ibid.<br />
63, 766 1989; J. L. Barrat <strong>and</strong> L. Bocquet, ibid. 82, 4671<br />
1999.<br />
58 T. Qian, X.-P. Wang, <strong>and</strong> P. Sheng, Phys. Rev. E 68, 016306<br />
2003; T. Qian, C. Wu, S. L. Lei, X.-P. Wang, <strong>and</strong> P. Sheng, J.<br />
Phys.: Condens. Matter 21, 464119 2009.<br />
59 B. Lafaurie, C. Nard<strong>one</strong>, R. Scardovelli, S. Zaleski, <strong>and</strong> G.<br />
Zanetti, J. Comput. Phys. 113, 134 1994; I. G<strong>in</strong>zburg <strong>and</strong> G.<br />
Wittum, ibid. 166, 302 2001; D. Jamet, D. Torres, <strong>and</strong> J. U.<br />
Brackbill, ibid. 182, 262 2002; S. Sh<strong>in</strong>, S. I. Abdel-Khalik,<br />
V. Daru, <strong>and</strong> D. Juric, ibid. 203, 493 2005.<br />
60 D. Beysens, C. R. Phys. 7, 1082 2006.<br />
61 A. Onuki <strong>and</strong> R. A. Ferrell, Physica A 164, 245 1990; A.<br />
Onuki, Phys. Rev. E 76, 061126 2007.<br />
62 Y. Miura, S. Yoshihara, M. Ohnishi, K. Honda, M. Matsumoto,<br />
J. Kawai, M. Ishikawa, H. Kobayashi, <strong>and</strong> A. Onuki, Phys.<br />
Rev. E 74, 010101R 2006.<br />
021603-14