CONNECTIONS - INSNA
CONNECTIONS - INSNA
CONNECTIONS - INSNA

Create successful ePaper yourself
Turn your PDF publications into a flip-book with our unique Google optimized e-Paper software.
<strong>CONNECTIONS</strong><br />
Multiplicity and Redundancy<br />
Beginning with the set of visualizations in<br />
Figure 3, the analyses use the network of<br />
corporate ties as a point of departure. Note that<br />
the widths of the arcs vary to represent the<br />
strength of the particular tie and the colors of the<br />
vertices are coded to represent their highest level<br />
of multiplicity. For example, in the network of<br />
corporate ties alone, we see two pairs of<br />
directors that are red indicating that each has at<br />
least one tie that is of strength 3 – meaning that<br />
there are three corporate ties linking these two<br />
directors. Further, the tie between the two red<br />
vertices is clearly thicker than the other edges in<br />
the network which have strengths of 1 or 2.<br />
Finally, all of the other vertices in the network<br />
are green indicating that they have at least one<br />
tie with a strength value of 2.<br />
In the subsequent networks in Figure 3, ties from<br />
each set of noncorporate organization are<br />
superimposed on the network of corporate ties.<br />
This is accomplished by treating corporate ties<br />
as arcs in one direction while the ties from say<br />
museums are graphed as arcs in the opposite<br />
direction. Looking at the network of corporate<br />
ties with museum ties added, we see first, that<br />
there are relatively few ties added. Furthermore,<br />
if we examine the yellow orange ties that are<br />
added from shared affiliations with museums,<br />
the majority of the arcs are bi-directed indicating<br />
that they simply reinforce an existing corporate<br />
tie. In contrast, note the third graph in which the<br />
red ties in the lower right corner of the graph are<br />
clearly new ties formed through university board<br />
affiliations (although the tie between Rockefeller<br />
and Livingston is slightly obscured by other<br />
corporate ties). Finally, the fourth graph with<br />
cyan ties dramatically underscores the number<br />
of ties between these 20 directors that are<br />
formed through shared club memberships.<br />
While the different configuration of each<br />
individual set of ties is certainly noteworthy, the<br />
sociographs in Figure 3 do not allow us to<br />
display the simultaneous set of ties from all<br />
organizations. To pull all of this information<br />
together and to capture multiple types of ties<br />
between a given pair of directors, it is necessary<br />
to aggregate the ties so as to preserve the types<br />
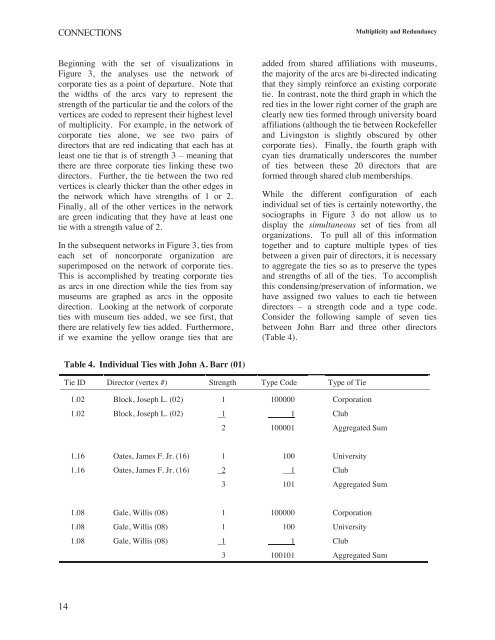
and strengths of all of the ties. To accomplish<br />
this condensing/preservation of information, we<br />
have assigned two values to each tie between<br />
directors – a strength code and a type code.<br />
Consider the following sample of seven ties<br />
between John Barr and three other directors<br />
(Table 4).<br />
Table 4. Individual Ties with John A. Barr (01)<br />
Tie ID Director (vertex #) Strength Type Code Type of Tie<br />
1.02 Block, Joseph L. (02) 1 100000 Corporation<br />
1.02 Block, Joseph L. (02) 1 1 Club<br />
2 100001 Aggregated Sum<br />
1.16 Oates, James F. Jr. (16) 1 100 University<br />
1.16 Oates, James F. Jr. (16) 2 1 Club<br />
3 101 Aggregated Sum<br />
1.08 Gale, Willis (08) 1 100000 Corporation<br />
1.08 Gale, Willis (08) 1 100 University<br />
1.08 Gale, Willis (08) 1 1 Club<br />
3 100101 Aggregated Sum<br />
14